We turn cycling data into meaningful charts to help you gain insights about the world's most heroic sport.
Tour de france.
- stories and insights
- data visualizations

Tour de France: explained in charts
- November 2023
By Deepali Kank
The Tour de France, an iconic, multiple-stage bicycle race, is a yearly spectacle that captivates cycling enthusiasts worldwide. Renowned for its prestige and demanding nature, this historic event traces its roots back to 1903, when it was conceived by the French newspaper L’Auto to boost its circulation. Today, it stands as a symbol of both cycling excellence and French cultural heritage.
How many kilometers are covered annually?
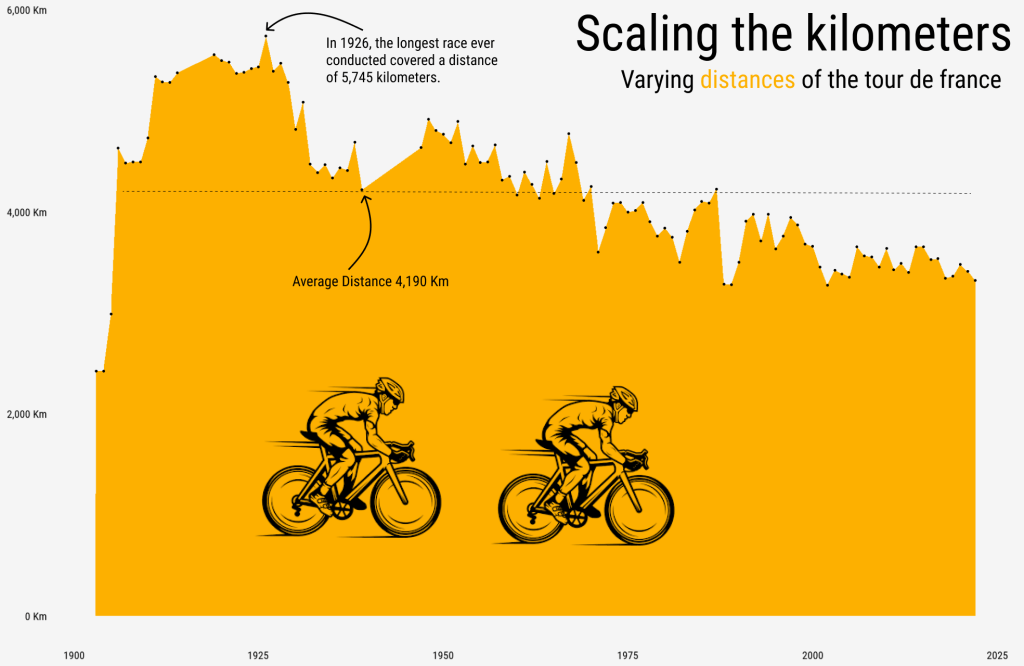
The Tour de France covers a challenging distance each year, typically ranging from 3,500 to 3,600 kilometers (2,175 to 2,237 miles) over a three-week period. The race consists of individual stages, including time trials and mountain stages, with varying distances. The start and finish locations change annually, showcasing different regions of France and occasionally other countries. The total distance covered in the Tour de France can vary from year to year, depending on the route chosen by the race organizers.
The chart reveals a noticeable decreasing trend in the distance traveled over time. This trend signifies a deliberate shift in the race’s format, reflecting changes in race strategies and considerations for the physical well-being of the cyclists.
Which countries have produced the most tour de france winners?
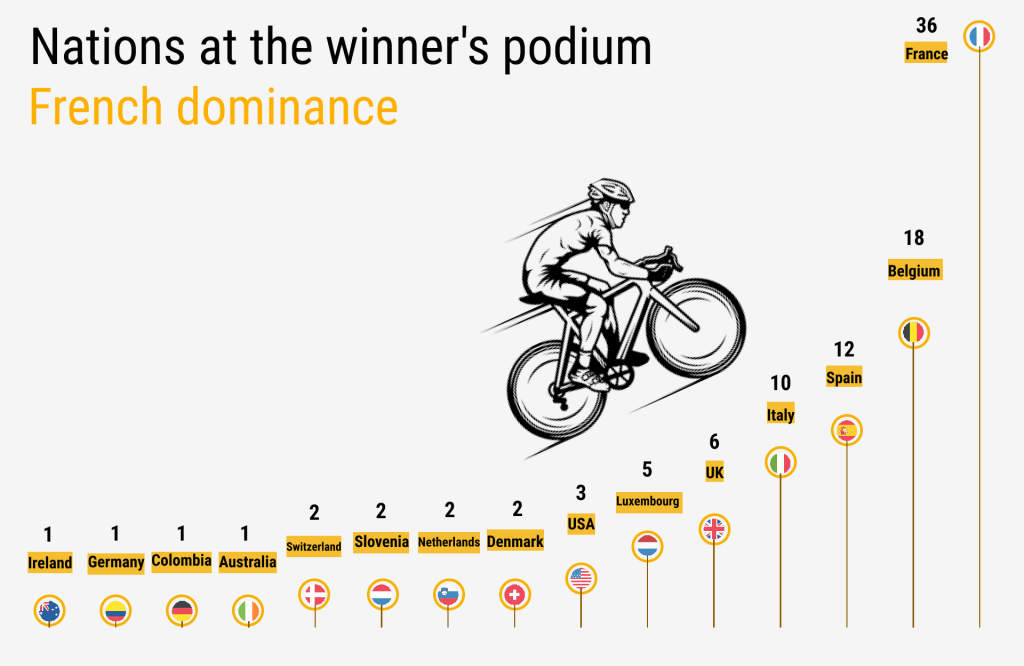
French cyclists initially dominated the race, with notable champions like Maurice Garin and Lucien Petit-Breton. In the post-war era, riders such as Louison Bobet and Jacques Anquetil continued French success. Anquetil became the first five-time winner, followed by the legendary Eddy Merckx. Bernard Hinault, known as “The Badger,” achieved five victories as well.
In 2023, defending champion Jonas Vingegaard from Denmark won the general classification for the second year in a row.
Is every stage an equal opportunity?
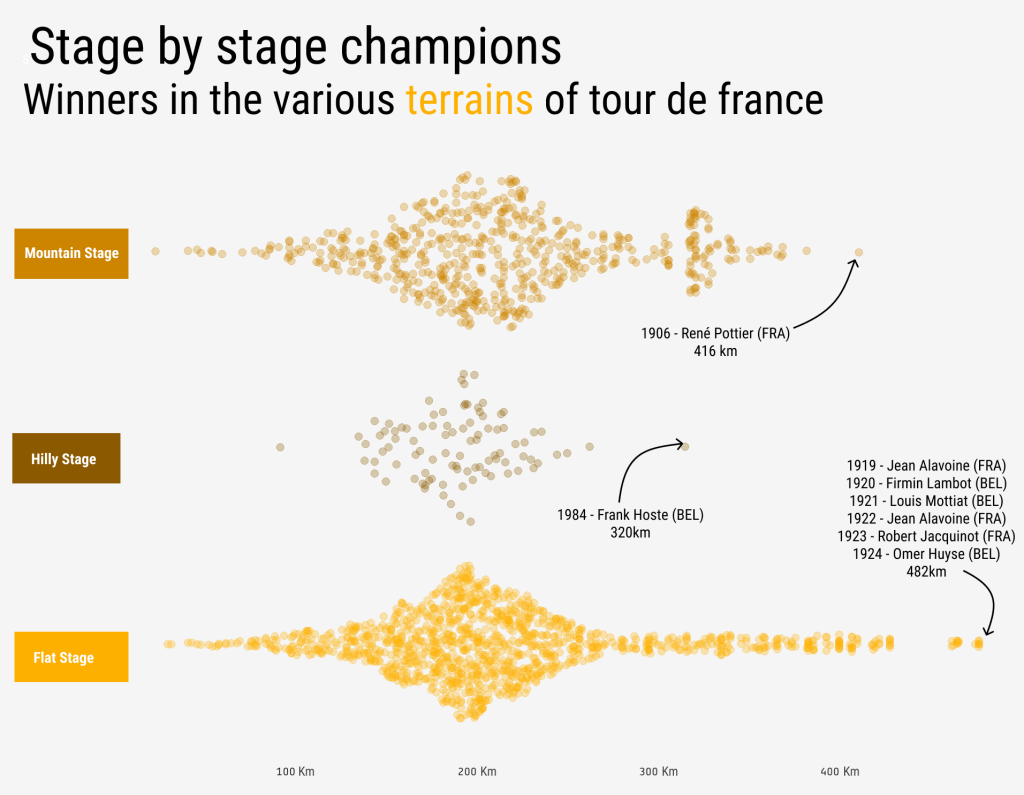
The Tour de France typically consists of 21 stages. However, it is important to note that the exact number of stages can vary from year to year as the organizers of the race occasionally make changes to the route. Each stage presents a different terrain and challenge for the riders, including flat stages, mountain stages, individual time trials, and team time trials. These stages are spread over a period of three weeks, with rest days interspersed between some of the stages to allow the riders some recovery time.
There are 3 main stages in the race i.e., Flat, Mountain and Hilly.
In the above chart, the winners who have completed the stages with maximum distance in each terrain are highlighted.
How many start the race, and who makes it to the end?
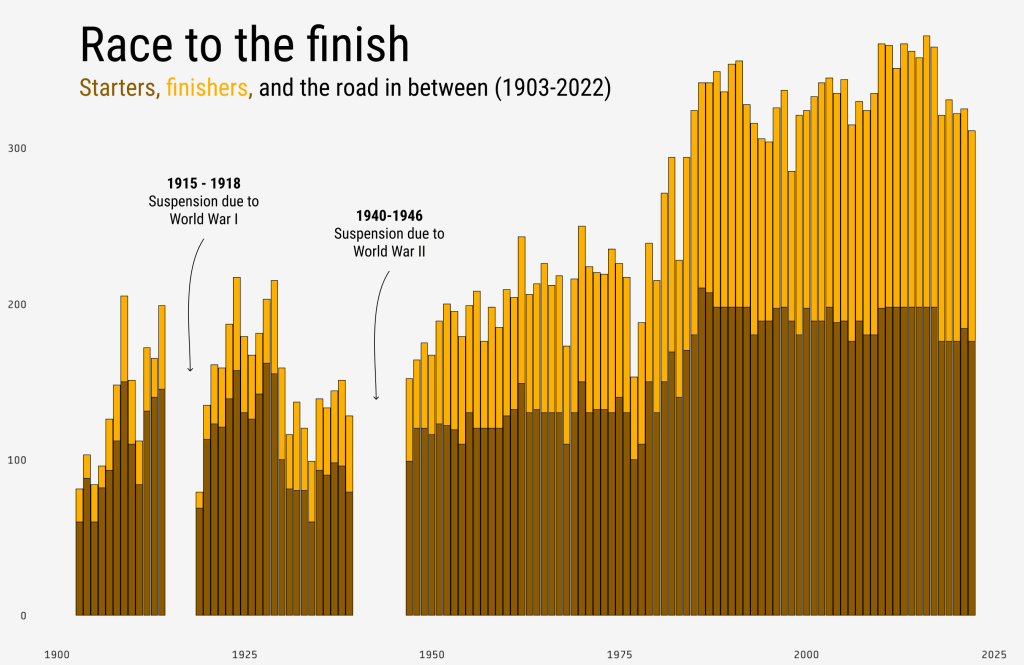
The chart shows that the number of starters and finishers has increased over time, while the number of runners who did not finish the race has decreased. This suggests that the race has become more popular over time. In 2023, there were 176 participants, of which 150 finished the race.
The Tour de France has become deeply ingrained in French culture and has a significant economic impact on the regions it visits. It is a celebrated event that draws passionate fans from around the world.
source: Maven Tour de France Challenge | Maven Analytics
sharing our work
If you’d like to use our visuals in your reports, news articles, educational materials, etc, contact us for pricing. We can grant non-exclusive rights to reproduce, store, publish, and distribute.
- Charts and Graphs , Cool Infographics & Data Visualizations
Tour de France – Distance & Pace over time – Radial Charts
- Last updated on July 19, 2019

This is an Excel replica of excellent Tableau visual made by Marc Reid here .
Last week, I saw a stunning visualization on Tour de France using of radial charts on twitter.
???? @Marc_DS5 combined #SportsVizSunday (Tour de France) and #SWDChallenge (radial charts) to create this #VOTD ! Learn about the fastest and longest tours in history: https://t.co/Xge6mtyVYE pic.twitter.com/6luDs9Riwp — Tableau Public (@tableaupublic) July 9, 2019
As an amateur cyclist, somewhat pro data analyst, I jumped with joy seeing that visual. I immediately thought, this needs to be redone in Excel . So here is an implementation of radial charts in Excel.
Demo of Excel Replica – TdF Distance & Pace Radial charts
Download tour de france radial charts viz in excel.
Click here to download the completed workbook . Have a play with the viz tab or explore the data&calc tab to see how it’s put together.
How is this chart made?
This will be a brief recipe with links to other articles that explain the technical elements. Feel free to poke around the download file to discover odd missing elements.
Step 0: Inspiration
As mentioned earlier, the inspiration for this came from Marc Reid’s excellent visual . I loved the visual instantly and wanted to replicate it in Excel as much as possible.

Step 1: Getting data
The data for this came from Thomas Camminady’s page on Every cyclist of Tour de France in a single CSV file . As the name suggests, it’s a CSV file, so there was no post processing needed. For each year, each finisher there is one row in the data set with columns like name, team name, duration, distance, pace, position and few other bits.
Step 2: Calcs for radial visualization
Meet ometry s. You might have seen them back in high school.
- Trigonometry
They will help us take the cycling data and transform that in to a radial chart.
Since there is 94 years of data (between 1913 and 2017 there were 94 editions of the tour) each spoke will be separated by 2pi / 94 radians.
Let’s take a look the anatomy of radial chart spokes.

We could simply draw one line per spoke, but to get the thick edge, thin center look, I went with triangle approach .
As you can see, if we can calculate points a,b,c & d for each year, our job is done.
The center is (0,0). Points a & d lie on the inner ring. Points b & c depend on the actual distance (or pace) we are plotting for the given year.
Let’s say inner ring size (radius) is defined by a named range hole.size and triangle edges are separated by 1 degree (2pi/360 radians).
- point a (x,y) = (hole.size * SIN(theta), hole.size *COS(theta))
- point d (x,y) = (hole.size * SIN(theta + 2pi/360), hole.size *COS(theta + 2pi/360))
To calculate b & c, we need to use the distance in that year too. As the distances (and paces) are all over the places, I have used a scale.factor to scale them down or up to make the radial charts uniform. This is how the formula looks for points b & c.
- point b (x,y) = (dist/scale.factor.d * SIN(theta), dist/scale.factor.d * COS(theta))
- point c (x,y) = (dist/scale.factor.d * SIN(theta + 2pi/360), dist/scale.factor.d * COS(theta + 2pi/260))
As we need 4 points for each year, we need to calculate 4 x 94 values to plot the radial chart for distance. Similar set of values need to be calculated for pace too.
Once all these values are ready, it is a simple matter of creating XY scatter plot, formatting it to get the spokes.
This method of drawing spokes / radials in Excel is explained in great detail here . For more also see network relationships chart in Excel .
The calculations for line charts are rather straight forward, so I am not explaining them here.
Step 3: Extra series for highlighting max, min and selected values
Once the calculations are done, we can add additional x,y values for each of these scenarios.
- If the pace is maximum, then get (x,y) else (NA(), NA())
- Pace is minimum, get (x,y) else NA()
- Year is selected by the user, get (x,y) else NA()
Related: How to conditionally format charts?
Step 4: User interaction for year selection – scrollbar form control
I added a scrollbar control to the visuals area and then set it up to go from 1913 to 2017. We can use the linked cell value to drive the calculations needed for “year selection” bit.

Related: Introduction to Excel Form Controls
Step 5: Stats for selected year with Picture Link
For the selected year, we can easily calculate stats (winner’s name, duration, distance, pace and percentage changes compared to previous edition of the tour). Once these stats are calculated, we can show them on the visual by using picture link . As you play with the scrollbar, the picture link changes.
Here is a re-cap of all the 5 steps in construction.

Other bits & pieces
- We can add labels for important points on radial chart by using “value from cell” option for data labels.
- But the labels on XY charts tend to be poorly positioned. I needed more space between edge of spoke and label. To get this, I added an extra label series that is offset 12 points from the edge.
- We can add number of finishers in each year and see that trend too. As you can see, over the years, the competition has gone intense.
The final output – Tour de France distance & pace over time as radial charts
How do you like the visualization.
My love for cycling, data and story-telling coincided perfectly in this. That said, if I remove my rose-tinted glasses, I can see a couple of issues with the visualization.
- Redundancy: The line charts at bottom depict the same info as radials, but do a better job. They can work even with 500 data points, where as the radial spokes will get very busy with such large volume of data.
- Obvious: The conclusion from visualization is “as distance goes down, pace has gone up”. But this is kind of obvious.
That said, I loved the challenge of replicating it in Excel. I would say, barring the trigonometry part, it is rather simple to re-create this in Excel. I suggest giving it a try to improve your charting skills.
What about you? What do you think about the original Tableau visual and its replica in Excel? Please share your thoughts in comment section.
Do you like sport & data – Check out these stories too:
My first 200km bike ride as a dashboard

Roger Federer’s 7th Wimbledon Title – Timeline

Commonwealth Games 2018 – Medal Tally Report (Power BI)

Share this tip with your colleagues

Get FREE Excel + Power BI Tips
Simple, fun and useful emails, once per week. Learn & be awesome.
- Ask a question or say something...
- Tagged under Advanced Charting , charting , cycling , downloads , form controls , picture link , radial charts , scatter plot , screencasts , Spoke Chart , tableau , tour de france
- Category: Charts and Graphs , Cool Infographics & Data Visualizations

Welcome to Chandoo.org
Thank you so much for visiting. My aim is to make you awesome in Excel & Power BI. I do this by sharing videos, tips, examples and downloads on this website. There are more than 1,000 pages with all things Excel, Power BI, Dashboards & VBA here. Go ahead and spend few minutes to be AWESOME. Read my story • FREE Excel tips book

Want an AWESOME Excel Class?

– Brenda
FREE Goodies for you...

From simple to complex, there is a formula for every occasion. Check out the list now.

Calendars, invoices, trackers and much more. All free, fun and fantastic.

Power Query, Data model, DAX, Filters, Slicers, Conditional formats and beautiful charts. It's all here.

Still on fence about Power BI? In this getting started guide, learn what is Power BI, how to get it and how to create your first report from scratch.

Announcing Power BI Dashboard Contest (win $500 prizes!)
Hey there, I have a SUPER exciting announcement! April is about to get a whole lot sweeter with our Power BI Dashboard Contest! Your mission, should you choose to accept it: Craft the most EPIC dashboard for the Awesome Chocolates CEO with sales & financial insights! Winners stand a chance to score up to $500 in Amazon Gift Cards, plus some serious bragging rights!

Compound Interest Formula in Excel

How to convert test scores to letter grades in Excel?

How to calculate the Gender Pay Gap using Excel Formulas? (Free Calculator Template)

Weighted Average in Excel [Formulas]
- Excel for beginners
- Advanced Excel Skills
- Excel Dashboards
- Complete guide to Pivot Tables
- Top 10 Excel Formulas
- Excel Shortcuts
- #Awesome Budget vs. Actual Chart
- 40+ VBA Examples
Related Tips
Make an impressive interactive map chart in excel.

How to Create a Dynamic Excel Dashboard in Just 5 Steps

How to create a fully interactive Project Dashboard with Excel – Tutorial

9 Box grid for talent mapping – HR for Excel – Template & Explanation

6 Must Know Line Chart variations for Data Analysis
How to make stream graphs in excel, 2 responses to “tour de france – distance & pace over time – radial charts”.
Simply Awesome....
The idea is awesome. Please can you help me to use this approach to build time spent duration in minutes.
Leave a Reply
Name (required)
Mail (will not be published) (required)
XHTML: You can use these tags: <a href="" title=""> <abbr title=""> <acronym title=""> <b> <blockquote cite=""> <cite> <code> <del datetime=""> <em> <i> <q cite=""> <s> <strike> <strong>
Notify me of when new comments are posted via e-mail
Get FREE Excel & Power-BI Newsletter
One email per week with Excel and Power BI goodness. Join 100,000+ others and get it free.
Get Started
- Excel Basics
- Advanced Excel
- 100+ Formulas
- Free Crash Course
- Pivot Tables
Online Classes
- Excel School
- VBA Classes
- Power BI Classes
- 50 ways to analyze data
- Mini Courses
- Welcome Message
- Forum & Community
- 20+ Excel Templates
- 200+ Dashboards
- 40+ VBA Code samples
- Ebooks & More
© All rights reserved.
Tour de France 2023: The stage-by-stage story of the race
- Published 23 July 2023

Jonas Vingegaard (middle) won the 2023 Tour de France from Tadej Pogacar (left) and Adam Yates (right)
Denmark's Jonas Vingegaard sealed his second successive Tour de France triumph after the 110th edition of the race ended in Paris on Sunday.
The 26-year-old Jumbo-Visma rider beat two-time winner Tadej Pogacar by seven minutes 29 seconds, as Britain's Adam Yates finished third overall.
Starting in Bilbao, the riders had to tackle eight mountain stages and an individual time trial on trips to the Pyrenees and Alps during the 3,404km (2,115-mile) race.
Here is the story of the 2023 race.
Saturday, 1 July - stage one: Bilbao - Bilbao, 182km

Adam Yates had never won a Tour de France stage before
Winner: Adam Yates
Report: Britain's Adam Yates beats identical twin Simon to win stage one
Britain's Adam Yates beat identical twin brother Simon to win stage one of the Tour de France in Bilbao, Spain and take the leader's yellow jersey. UAE Team Emirates' Adam, 30, pulled away from Jayco AlUla rider Simon in the final stages of the uphill finish to win his first Tour stage.
Sunday, 2 July - stage two: Vitoria-Gasteiz to San Sebastian, 208.9km

Lafay's win was his first at the Tour de France and the first by his team, Cofidis, since 2008
Winner: Victor Lafay
Report: Lafay wins stage two as Yates retains yellow jersey
Frenchman Victor Lafay produced a brilliantly timed attack to win the second stage of the Tour de France. Belgium's Wout van Aert had appeared perfectly placed to take the 208.9km stage, which ended in San Sebastian, but Lafay burst clear with 900m to go and Van Aert was left banging his handlebars in frustration after being unable to reel him in.
Monday, 3 July - stage three: Amorebieta-Etxano - Bayonne, 193.5km

Jasper Philipsen has now won three stages of the Tour de France in his career
Winner: Jasper Philipsen
Report: Philipsen sprints to victory on stage three
Belgium's Jasper Philipsen sprinted to victory on stage three of the Tour de France as Britain's Adam Yates retained the leader's yellow jersey. Philipsen, 25, edged out Germany's Phil Bauhaus with Australia's Caleb Ewan in third in the first bunch-sprint finish of this year's Tour.
Tuesday, 4 July - stage four: Dax - Nogaro, 181.8km

Jasper Philipsen (left) beat Caleb Ewan by half a wheel on the finish line
Report: Philipsen claims second straight stage win
Jasper Philipsen won for the second day in a row amid a chaotic finish to stage four of the Tour de France in Nogaro. The Belgian was again led out perfectly by his team-mate Mathieu van der Poel and edged out Australia's Caleb Ewan with Germany's Phil Bauhaus third. Britain's Mark Cavendish, chasing a record-breaking 35th stage win, was further back in fifth.
Wednesday, 5 July - stage five: Pau - Laruns, 162.7km

Jai Hindley is competing in the Tour for the first time after winning the Giro d'Italia in 2022
Winner: Jai Hindley
Report: Hindley wins stage five to take yellow jersey
Jai Hindley claimed stage five to take the yellow jersey as Jonas Vingegaard dented Tadej Pogacar's hopes of a third Tour triumph. Australia's Hindley was part of an early breakaway and soloed to victory after attacking with 20km left. Meanwhile, Denmark's defending champion Vingegaard rode clear of two-time winner Pogacar, pulling out more than a minute on the man regarded as his main rival in the general classification.
Thursday, 6 July - stage six: Tarbes - Cauterets, 144.9km

Tadej Pogacar has won 10 stages over his career at the Tour
Winner: Tadej Pogacar
Report:Pogacar beats Vingegaard in epic mountain battle
Tadej Pogacar delivered a stunning attack on the final climb to Cauterets-Cambasque as he soloed clear of defending champion Jonas Vingegaard to win stage six. The two-time winner moved second overall, 25 seconds behind Vingegaard, who took the leaders yellow jersey after Australia's Jai Hindley was dropped on the penultimate climb up the iconic Col du Tourmalet.
Friday, 7 July - stage seven: Mont-de-Marsan - Bordeaux, 169.9km

Jasper Philipsen has won the last five sprint stages across two editions of the Tour
Report: Cavendish denied new Tour wins record by Philipsen
Mark Cavendish suffered a gear issue as Jasper Philipsen pipped him to victory in a sprint finish of stage seven. Cavendish had looked to be closing in on a record-breaking 35th stage win at the Tour until the Belgian powered past him in sight of the line. Denmark's defending champion Jonas Vingegaard retained the overall leader's yellow jersey.
Saturday, 8 July - stage eight: Libourne - Limoges, 200.7km

Mark Cavendish has not reached Paris in seven of his 14 Tour de France appearances
Winner: Mads Pedersen
Report: Cavendish denied record as crash puts him out of final Tour
Mark Cavendish was denied the opportunity to set a new record for stage wins after crashing out on his final Tour de France, as Denmark's Mads Pedersen won an uphill sprint finish in Limoges.
Sunday, 9 July - stage nine: Saint-Leonard-de-Noblat - Puy de Dome, 182.4km

Michael Woods claimed his first Tour victory as the race returned to Puy de Dome for the first time in 35 years
Winner: Michael Woods
Report: Woods wins first Tour stage on Puy de Dome
Michael Woods claimed a breakaway victory on stage nine of the Tour de France as Tadej Pogacar took more time out of race leader Jonas Vingegaard. Canada's Woods made up about two minutes on American Matteo Jorgenson on the steep final section of the dormant volcano, the Puy de Dome. Pogacar's late attack saw him reduce Vingegaard's overall lead to 17 seconds.
Tuesday, 11 July - stage 10: Vulcania - Issoire, 162.7km

Bilbao celebrated his first win at the Tour de France, at the age of 33
Winner: Pello Bilbao
Report: Bilbao claims first Tour stage win
Spain's Pello Bilbao timed his sprint finish to perfection as he claimed his first stage victory in the Tour de France. Krists Neilands attacked his breakaway companions over the top of the final climb on stage 10 but was caught with 3km to go and Bilbao was fastest in the final 200m.
Wednesday, 12 July - stage 11: Clermont-Ferrand - Moulins, 179.8km

Jasper Philipsen extended his green jersey lead with his fourth stage win
Report: Philipsen sprints to fourth stage victory of Tour
Jasper Philipsen timed his sprint to perfection to claim a fourth stage win of this year's edition. The Belgian worked his way up through the bunch and then kicked off the wheel of Dylan Groenewegen, who came second in Moulins.
Thursday, 13 July - stage 12: Roanne - Belleville-en-Beaujolais, 168.8km

Ion Izagirre has won stages at all three of cycling's Grand Tours
Winner: Ion Izagirre
Report: Izagirre cruises to victory as Vingegaard retains overall lead
Ion Izagirre soloed to victory on stage 12 after launching a superb attack 31km from the finish in Belleville-en-Beaujolais. The Spanish rider was 58 seconds clear of Mathieu Burgaudeau and Matteo Jorgenson, who were second and third. Jonas Vingegaard retained the overall leader's yellow jersey.
Friday, 14 July - stage 13: Chatillon-Sur-Chalaronne - Grand Colombier, 137.8km

Michal Kwiatkowski's only previous stage victory at the Tour came in 2020 in Morzine
Winner: Michal Kwiatkowski
Report: Kwiatkowski wins stage 13 as Pogacar gains ground
Michal Kwiatkowski took a superb solo win on stage 13 as Tadej Pogacar gained more time on race leader Jonas Vingegaard. Poland's Kwiatkowski rode clear on the summit finish on Grand Colombier on the race's first day in the Alps. An explosive attack by two-time race winner Pogacar in the final 400 metres cut Vingegaard's overall lead to nine seconds.
Saturday, 15 July - stage 14: Annemasse - Morzine Les Portes du Soleil, 137.8km

This was Carlos Rodriguez's first Grand Tour stage win
Winner: Carlos Rodriguez
Report: Vingegaard keeps yellow as Rodriguez wins epic stage
Denmark's Jonas Vingegaard retained the leader's yellow jersey after an intense stage 14. Spain's Carlos Rodriguez, been dropped on the final climb, won the stage after he mugged Vingegaard and Tadej Pogacar on the final descent.
Sunday, 16 July - stage 15: Les Gets les Portes du Soleil - Saint-Gervais Mont-Blanc, 179km

Wout Poels finished two minutes eight seconds clear of second-placed Wout van Aert
Winner: Wout Poels
Report: Poels wins as fan taking selfie causes huge crash
Dutchman Wout Poels won his first stage at a Grand Tour as Jonas Vingegaard and Tadej Pogacar crossed the finish line together. Stage 15 saw an early crash involving about 20 riders caused by a spectator trying to take a selfie with their phone.
Tuesday, 18 July - stage 16: Passy - Combloux, 22.4km

Denmark's Jonas Vingegaard had started the day only 10 seconds ahead of his nearest rival Tadej Pogacar
Winner: Jonas Vingegaard
Report: Vingegaard closes in on title after time trial win
Jonas Vingegaard tightened his grip on the yellow jersey after he blew away Tadej Pogacar in the individual time trial on stage 16. The Dane won the 22.4km route from Passy to Combloux in 32 minutes 36 seconds on a decisive day of the Tour.
Wednesday, 19 July - stage 17: Saint-Gervais Mont-Blanc - Courchevel,165.7km

Vingegaard kissed his hand in celebration as he crossed the finish line at Courchevel
Winner: Felix Gall
Report: Jonas Vingegaard on brink of retaining title after stretching lead
Jonas Vingegaard is on the brink of retaining his Tour de France title after opening up a lead of more than seven minutes on a gruelling stage 17. The Dane powered up the final climb of the queen stage of the Tour but saw his main rival, Tadej Pogacar, crumble.
Thursday, 20 July - stage 18: Moutiers - Bourg-en-Bresse,184.9km

Kasper Asgreen had the strongest legs among the breakaway group to take victory as the peloton closed in behind
Winner: Kasper Asgreen
Report: Kasper Asgreen holds on to win stage 18 from epic breakaway
Kasper Asgreen claimed his first Tour de France stage victory as he held on to win stage 18 from an epic four-man breakaway to deny the sprinters in the dramatic closing stages in Bourg-en-Bresse. Fellow Dane Jonas Vingegaard maintained his comfortable overall lead with just three stages left.
Friday, 21 July - stage 19: Moirans-en-Montagne - Poligny, 172.8km

Matej Mohoric (r) pipped Kasper Asgren (l) in a thrilling finale to claim the third Tour stage win of his career
Winner: Matej Mohoiric
Report: Mohoric wins stage 19 of Tour de France
Matej Mohoric won stage 19 in a thrilling photo finish ahead of Kasper Asgreen in Poligny. The pair sprinted for the line at the end of a frantic day of racing, with the Slovenian denying Asgreen back-to-back stage wins by the width of a rim.
Saturday, 22 July - stage 20: Belfort - Le Markstein Fellering 133.5km

Tadej Pogacar clawed back six bonus seconds on Jonas Vingegaard but the yellow jersey rider has a comfortable lead heading into Sunday's processional stage to Paris
Report: Tadej Pogacar salvages pride by winning stage 20
Tadej Pogacar salvaged some pride by taking stage 20 of this year's Tour de France as Jonas Vingegaard all but sealed the defence of his title. Pogacar has been unable to challenge Vinegaard's supremacy in the past week, but sprinted past the Dane to win on the final day of competitive racing.
Sunday, 23 July - stage 21: Saint-Quentin-en-Yvelines - Paris Champs-Elysees, 115.1km

Meeus was riding in his first Tour de France
Winner: Jordi Meeus
Report: Jonas Vingegaard retains title as Jordi Meeus claims surprise win in Paris
Denmark's Jonas Vingegaard sealed his second successive Tour de France triumph as Jordi Meeus sprinted to a surprise win on the final stage. Meeus, 25, edged out Jasper Philipsen in a photo finish in Paris to deny his fellow Belgian a repeat of last year's win on the iconic Champs Elysees.
Related Topics
Related internet links.
British Cycling
International Cycling Union
How are Tour de France numbers assigned?
We take a look at how La Grande Boucle decides on each rider’s number

In sport, a number can carry a lot of weight. In rugby or American football, a number denotes a position on the field. In American football clubs, a number is often so closely associated with a player that when that player retires, the number is retired alongside them - never to be used again. In ice hockey, skaters choose their own numbers, usually picked for personal or historical significance. In the Tour de France, and cycling more broadly, the meaning is a little more arbitrary.
You’d be forgiven for assuming that at the Tour de France the numbers on a rider’s back mean little to nothing. And you’d be correct. Almost. But what they lack in meaning, they very much make up for in satisfying logic. With one or two interesting exceptions. Here’s a quick run-down of what is, admittedly, an inexact science.
Tour de France: Who is Number 1?
If you have any knowledge at all about numbers in cycling, you probably know that number 1 is worn by the previous year’s victor. Jonas Vingegaard (Jumbo-Visma) wore 1 in 2023 and he will wear it again at the 2024 Tour de France , following his successful defence of the maillot jaune.
Tour de France 2024 route The jerseys of the 2024 Tour de France Tour de France 2024 - The GC favourites form guide
Statistically speaking, the number 1 bib, or dossard , to use the French term, is the most successful in terms of previous victories. A total of 27 Tour wins have come from riders sporting the single digit on their backs; the highest of any bib number.
In many ways it’s a self-fulfilling prophecy - the previous year’s best rider has an above-average chance of winning the race once again. In fact, it’s one of the few races within the sport of cycling where defending your title has any real meaning.
The team of the previous year’s winner fills out the rest of the single digits. Dossards 2-8 were worn by Jumbo-Visma last year, ordered alphabetically.
Why is Number 13 upside down?

The next predetermined number is 11. This number goes to the previous year’s runner-up. In 2023, this number went to Tadej Pogačar of UAE Team Emirates. The rest of his team normally would've filled out numbers 12-18, although they went different from the norm without any rider wearing the number 13. Adam Yates was instead riding number 19 with Felix Großschartner, the rider meant to wear the upside-down 13, likely opting not to wear the unlucky digit.
Get The Leadout Newsletter
The latest race content, interviews, features, reviews and expert buying guides, direct to your inbox!
That means the last rider to don the upside-down dossard was Steven Kruijswijk in 2022 for Jumbo-Visma. Where cycling is pragmatic about its numbering system, many riders still retain a superstition over that number and choose to wear it upside down. (Kruijswijk crashed hard on stage 15 in 2022 and was forced to abandon the race.)
The third set of numbers is 21-28, traditionally worn by the team of the rider who was third placed in the previous year’s Tour. In 2022, this was Geraint Thomas, so Ineos Grenadiers claimed the right to these dossards despite the Welshman not being present. The British team opted to grant former Tour winner Egan Bernal the number 21 despite not being the leader, with young star Carlos Rodríguez ending up as their best rider despite starting with the number 27 on his back.
If any of the previous year’s top three are not present at the race, their teams will award the numbers 1, 11, or 21 to whichever rider is their designated leader.
Beyond the three previous podium spots is where things get a little sketchy. Theoretically, the numbers proceed 31-38 for the next team, 41-48 for the one after, and so on, but the reasons behind the exact placement of teams are not entirely clear; blocks have been allocated alphabetically, or by team ranking. There are exceptional cases though.
In 2023, the next highest available number, 31, was awarded to David Gaudu after he finished fourth in the 2022 Tour de France - the highest-placed French rider. The rest of the 30s were taken up by his teammates on the long-standing French squad.
The Tour de France’s mythical number 51

The number 51 retains an almost mythical significance to the French. Named the dossard anise after a brand of aniseed aperitif launched by Pernod in 1951, the legend was born following a successful decade for the number: four riders won wearing 51 within 10 years, beginning with Eddy Merckx in 1969 and ending with Bernard Hinault in 1978.
Since then, it’s been regarded as lucky, and is often awarded to a prominent French rider – Pierre Rolland wore 51 in 2013, Thibaut Pinot in 2019 and 2020 and Julian Alaphilippe wore it in 2023 for the second time in his career - In reality, it’s actually only the fourth-most successful dossard, after 11 and 2, sharing the ranking with 15 and 21.
Red and yellow
After the numbers have been allocated, that’s that. In terms of digits, at least. Once the race kicks in, there are colours that can be added to dossards to denote different things. Most notably, it used to be red but is now gold. Each day, the rider wearing the red number used to be the rider deemed to have been most aggressive during the previous day’s stage. In 2023, this red number was exchanged for a gold dossard due to the competition's sponsor, Century 21. Combativity is decided by a jury following each stage alongside a new vote made by members of the Tour de France Club.
The second colour visible within the peloton is yellow. Not to be confused with the yellow of the leader’s jersey, yellow numbers are awarded to the riders from the team who are recognised with the team classification at that point in the race. As a result, these may change hands just as the maillot jaune may shift from one set of slender shoulders to another, as the race progresses. Jumbo-Visma won the team competition in 2023 alongside the yellow jersey itself.

Thank you for reading 5 articles in the past 30 days*
Join now for unlimited access
Enjoy your first month for just £1 / $1 / €1
*Read any 5 articles for free in each 30-day period, this automatically resets
After your trial you will be billed £4.99 $7.99 €5.99 per month, cancel anytime. Or sign up for one year for just £49 $79 €59

Try your first month for just £1 / $1 / €1

James Moultrie is a gold-standard NCTJ journalist who joined Cyclingnews as a News Writer in 2023 after originally contributing as a freelancer for eight months, during which time he also wrote for Eurosport, Rouleur and Cycling Weekly. Prior to joining the team he reported on races such as Paris-Roubaix and the Giro d’Italia Donne for Eurosport and has interviewed some of the sport’s top riders in Chloé Dygert, Lizzie Deignan and Wout van Aert. Outside of cycling, he spends the majority of his time watching other sports – rugby, football, cricket, and American Football to name a few.
Tadej Pogačar can dominate the Giro d’Italia but nobody can control its chaos – Analysis
Best bike phone mounts 2024: Stylish and practical phone holders
Trek USCX confirmed for fourth season with $15,000 purse and finale in Waterloo
Most Popular
Your cart is empty

The closest winning margins in Tour de France history
We take a look at the tightest battles and biggest thrashings since the Tour de France began in 1903.
Words: Joe Timms
The Tour de France now has well over 100 editions under its belt, in a lifespan that's just shy of 120 years. Over this period, the race has changed dramatically. In the good old days, riders often raced over 400km per day and had to make any mechanical repairs themselves (though many argue that the illicit use of trains, planes and automobiles often played its part).
So, through the years of the ever-evolving race, between dozens of riders racing hours apart, to tightly-tuned team strategies targeting bonus seconds here and there, what are the closest finishes in Tour de France history?
The smallest winning margin at the Tour de France

Laurent Fignon in 1989 (Image credit: AFP via Getty Images)
- Greg LeMond - 8 seconds, 1989
- Alberto Contador - 23 seconds, 2007
- Oscar Pereiro - 32 seconds, 2006
- Jan Janssen - 38 seconds, 1968
- Stephen Roche - 40 seconds, 1987
- Bernard Thevenet - 48 seconds, 1977
- Chris Froome - 54 seconds, 2017
- Jacques Anquetil - 55 seconds, 1964
- Carlos Sastre - 58 seconds, 2008
- Tadej Pogacar - 59 seconds, 2020
The closest ever Tour de France took place in 1989, where Greg LeMond defeated Laurent Fignon by just eight seconds in one of the most pulsating finishes to a Tour you are ever likely to see. In contrasting fashion to modern-day racing, that race featured five time trials, including the opening prologue in Luxembourg and a mammoth 73-kilometre individual time trial between Dinard and Rennes, where LeMond and Fignon were first and third respectively.
The duo seesawed between the top two positions throughout the race, regularly taking turns in the yellow jersey before handing it back to their rival. LeMond regained the lead after the stage 15 time trial to Orcières-Merlette, but Fignon grappled the yellow jersey back on Alpe d’Huez and entered the final stage with a 50 second lead.
Nowadays, this would mean that Fignon was the winner of the Tour de France as no time can realistically be won and lost — the final stage is used as a celebration before a sprint finish. However, in 1989, Paris hosted a 24.5-kilometre time trial which concluded on the Champs-Élysées.
LeMond and Fignon finished the stage first and third respectively again, but LeMond had averaged 54.5 kilometres per hour and defeated Fignon by 58 seconds. The margin was enough for LeMond to win the Tour de France by just eight seconds. Fignon, who had won the Giro d’Italia earlier that year, never returned to a Grand Tour podium again, though he did win stage 11 of the ‘92 Tour.
The Tour de France has never concluded with a time trial since, but will do so in 2024. The riders face a 35km hilly time trial in the south of France as the traditional finish in Paris is moved to accommodate the Olympic Games.
The largest winning margin at the Tour de France
In contrast, the largest margin between the winner of the Tour de France and the runner up occurred at the 1903 Tour de France, the first edition of the race. Maurice Garin finished two hours, 59 minutes and 21 seconds ahead of Lucien Pothier. For context, the same time gap separated Tadej Pogačar and Greg Van Avermaet at the 2020 Tour de France, who finished first and 50th respectively.
In general, the margin of victory at the Tour de France has decreased as time has passed. Prior to the Second World War, the Tour de France was regularly decided in hours rather than minutes. The first Tour de France post-World War II took place in 1947 and was the first Tour not organised by L’Auto . Since, the time gap between the winner and runner-up has never been more than 30 minutes.

- Fausto Coppi, 28 minutes and 17 seconds, 1952
- Gino Bartali, 26 minutes and 16 seconds, 1948
- Hugo Koblet, 22 minutes, 1951
- Eddy Merckx, 17 minutes and 54 seconds, 1969
Luis Ocaña, 15 minutes and 51 seconds, 1973
(Largest Tour de France winning margins since 1947)
Fausto Coppi won the 1952 Tour de France by just over 28 minutes, which is the largest margin since the Tour de France restarted after the Second World War. Coppi also won five stages that year in a dominant performance.
Cover image: Jean-Yves Ruszniewski/Corbis/VCG via Getty Images

Team Cars | Service Des Courses - Organic Unisex T-shirt

Rouleur Team Cars Bone China Mugs

Rouleur ELITE Jet Water Bottle Bidon - 550ml
Rouleur Logo Organic Unisex T-Shirt - Black/White

Team Cars | Campagnolo - Organic Cotton Unisex T-Shirt

Rouleur Logo Organic Unisex T-Shirt – White
Rouleur Logo - Organic Sweatshirt - Unisex - Burgundy

Team Cars | Peugeot - Organic Cotton Unisex T-Shirt

Colours of the Peloton - Short Sleeve Base Layer - Men's
Rouleur Logo Organic Unisex T-Shirt – Tonal Grey

Team Cars | Raleigh - Organic Cotton Unisex T-Shirt
Rouleur Logo Organic Sweatshirt - Unisex - Grey

Coppi - Rouleur Notebook

Rouleur Logo - Organic Sweatshirt - Unisex - French Navy

Rouleur Logo - Organic Hooded Sweatshirt - Unisex - Heather Blue

Rouleur Logo - Organic Jogger Pants - Unisex - French Navy

Rouleur x Kaweco Rollerball Pen - Black + Gold foil logo

Allez - Organic Cotton Unisex T-Shirt

Tours Issue - Rouleur Tote Bag

Dai! - Organic Cotton Unisex T-Shirt

True Grit - Rouleur Notebook

Rouleur Water Bottle Bidon - Ride Fast, Read Slow - Cream + Green

Rouleur Water Bottle Bidon - Green + Pink

Rouleur x Kaweco Rollerball Pen - Brass + Black etched logo

Rouleur Embroidered Organic Cotton Unisex T-Shirt - Natural Cotton + Green

!Vamos! - Organic Cotton Unisex T-Shirt

Colours of the Peloton - Short Sleeve Jersey - Women's
Rouleur Logo Women's T-Shirt - Navy

Rouleur x Kaweco Aluminium Rollerball Pen - Silver + Engraved logo

Rouleur Logo - Organic Jogger Pants - Unisex - Heather Grey
- Integrations
- Customer stories
- Our newsletter
- Corporate information
- Opportunities
- Cambridge Intelligence Life
- Request a trial
Visualizing the Tour de France in the year I tackle the route
by Julia Robson , 28th June 2023
On Saturday 24th June 2023, I set off from Bilbao, Spain, to ride the Tour de France route with Le Loop . In the lead up to this, my day job as a software developer gave me a break from hard training rides, but my love of cycling sparked a mini side project: building web apps with the data visualization tools I help to develop, and using them to analyze and visualize Tour de France data.

Through custom filtering, styling and grouping techniques, I’ll use different Tour de France datasets to explore the history, legends, nationalities, locations and exciting 2022 finale in a visual way, finding insights in hidden connections.
Visualizing Tour de France race history
Keen to see what the entire history of Tour de France teams and riders looks like, I visualized thomascamminady’s LeTourDataset .

Green bike nodes represent teams, and they’re sized by the number of times riders listed that team as the one they rode the tour for. The time bar across the bottom shows how race participation increased steadily, with two gaps showing when the race wasn’t held due to the first and second world wars.
It’s a busy chart, but I’m drawn to the cluster of larger team nodes in the top left.

Hmmmm. Those “TDF 190# ***” don’t look right – they’re clearly not teams – but I know what’s happened. Before 1930, any amateur rider could compete: they didn’t make team memberships compulsory until 1930. So in the original data, these individuals have the year they took part listed as their team name. (It’s a reminder that every source dataset can benefit from a review and clean-up exercise before visualizing it!)
If we look at the teams that did exist in the early years, we can see how the team strategy paid off. A closer look at the Peugeot-Wolber team performance in 1914 shows that, of the 11 riders in the team, eight finished in the top ten general classification race (GC), including the top three places.

The winner was Belgian rider Philippe Thys , who claimed victory despite incurring a 30-minute penalty for buying a new wheel to fix a mechanical problem on stage 14 .

Cyclists in the chart are sized according to a ‘success’ score based on the number of tours completed and their rankings. When I select Thys, details on the right-hand side show he competed six times and won three.

Let’s look at what’s happened with more recent tours and teams. I use the time bar sliders to filter the data and show results from the last 20 years.
One larger rider node in the bottom right corner stands out. Closer investigation reveals it’s British 4-times Tour de France winner, Chris Froome.
Most cycling fans know that his victories came as part of Sky-sponsored teams, but he’s also linked to a third, much smaller team in this chart. I select it and see it’s Barloworld , a South African team that received wild card entries for the tour in 2007 and 2008.
The largest of the other nodes linked to this team is Froome’s future super domestique turned 2018 winner (and 2019 runner up), Geraint Thomas.
Tour de France legends
This visualization focuses on riders and stage wins. Each rider is linked to the type of stage won, which reveals a lot about how race specialists have evolved over the years.

As you’d expect, British sprint specialist Mark Cavendish – the largest node in the cluster on the right of the chart – has only ever won flat stages (a massive 34 in total):

The other large node in the chart shows that Belgian legend of the sixties and seventies – the great Eddy Merckx – has won the same number of stages. But he was as strong in the mountains as he was on the flat, so he’s linked to multiple stage types.

Stage winners by nationality
I simplified the data further by grouping stage winners by their countries of origin. French nationals have won the most stages (over 700), although a Frenchman hasn’t won the GC since Bernard Hinault in 1985.

I can dig deeper inside these group nodes to see the riders from each country sized according to how many stages they’ve won. Here’s Belgium’s winners, prominently featuring our friends Eddy Merckx and Phillipe Thys:

When I click on Eddy Merckx, I go deeper still and see details of each stage victory, including the year, stage number, and distance:

Location, location, location
Obviously, the Tour de France is no longer just a sporting event: it’s a huge commercial enterprise. European neighbors bid millions of euros to host the grand départ (opening race stages), while French towns and cities pay handsomely for the privilege of hosting a stage.
I’m interested to see what the hundreds of different locations that’ve been used as the start or finish of a stage look like. I’ve sized them according to how many times they’ve hosted.
Unsurprisingly, Paris – venue of the race finish every year since 1975 – is the largest node, followed by Bordeaux in the southwest and Pau on the edge of the Pyrenees.

The links show the direction between locations and I’ve sized them by how many times that stage route has featured. They’re also colored by stage type: green for flat, blue for time trials, red for hilly, orange for mountains.
Zooming in shows how many iconic mountain finishes there’ve been on Alpe d’Huez – a grueling 13.8km climb with an average 8.1% gradient and 21 hairpin turns.

The crescent of nodes on the right-hand side show outliers in our data that don’t link directly to the other, more popular stages. These are where grand départ locations outside France feature. We can zoom in to spot London, which hosted the start and finish of the 7.9km 2007 prologue time trial plus the start of a flat stage to Canterbury. In 2014, London also hosted the finish of a stage that started in my hometown, Cambridge.
How the 2022 Tour de France was won
22 teams of eight riders set off from Copenhagen on July 1st 2022. I’ve arranged them here in club colors and grid formation to give an idea of the peloton’s size.

As in 2021, the favorites for GC were from UAE Team Emirates and Team Jumbo-Visma. It was a fantastic battle with Jumbo-Visma’s Jonas Vingegaard from Denmark beating Slovenian UAE rider and 2020 champion, Tadej Pogačar.
Watch how the race between the two teams unfolded. You can see that Vingegaard’s Jumbo-Visma teammate Wout Van Aert took the yellow jersey early on before Pogačar (top left for UAE) won it from him. Vingegaard took it over from stage 11 and never relinquished it.
You can see how UAE Team Emirates was decimated by COVID-19 (it also ended my 2022 Le Loop attempt on stage 8). Jumbo-Visma were also down to 5 riders by the end, but claimed GC, points race, and king of the mountains victories.
Chapeau to every rider
Building these web apps and exploring the Tour de France data in a visual way was great fun. It also shows how easy it is to explore large and complex datasets with interactive graph visualization.
I could take this exploration further – plot stages on a real map to spot geographic patterns, combine nationalities with mountain stage winners to see if riders from high altitude countries have an advantage, or include financial data to reveal correlations between team success and investment. If you want to learn more about what our toolkits can do, get in touch .
Right now I’ll enjoy my own Tour de France adventure before watching the final week of the professional race from the comfort of my sofa.

FREE: Start your trial today
Visualize your data! Request full access to our SDKs, demos and live-coding playgrounds.
TRY OUR TOOLKITS
How can we help you?

Ready to start?
Request a free trial

Want to learn more?
Read our white papers

Looking for success stories?
Browse our case studies
- Our customers
- Our partners
- Connected Insights
- Paid internships
- How we work
- Meet the team
- Company news
- Evaluation FAQs
- Procurement FAQs
Register for news & updates
Registered in England and Wales with Company Number 07625370 | VAT Number 113 1740 61 6-8 Hills Road, Cambridge, CB2 1JP. All material © Cambridge Intelligence 2024. Read our Privacy Policy .

Home > Sports > List > Cycling > Testing > Anthropometry > Tour de France > Tables

Body Size Tables of Tour de France Participants
See the discussion about the body size of professional cyclists using the data from the tables below.
Table of Tour de France Cyclists Average Stats
The table below lists average age, heights and weights of Tour de France participants (data from https://www.procyclingstats.com/), plus the calculated average BMI measurement . There was no average data from before 1990, and from the earlier years on this list it is probably not a complete sample of all the participants (the database did not indicate how many sample points). See the graphs on the discussion page for a better indication of the trends.
source: the data was originally taken from https://www.procyclingstats.com/, and has been addded to over time
Table of Tour de France Winner's Body Size
The table below lists all known heights and weights of Tour de France champions. There is a lot of missing data from prior to the 1940s. Weight values are to the nearest kg or lb. Body mass index has been calculated from the height and weight data.
The data is being used to get a general view of the riders' body size and changes over time. They may not be accurate, the measurements were taken at different times, under different conditions and using unknown methods. Most of the height and weight values in the table are taken from the Wikipedia page for each rider, and though they are believed to be somewhat accurate, they may not reflect the true racing weight of the cyclists during the tour.
The anthropometric data of Lance Armstrong has been included even though he is now not the winner (there is no official winner for those years).
source: most of the height and weight values in the table are taken from the Wikipedia page for each rider .
Check These
different data from sport-reference:
- Froome 6-0.5 (185 cm)
- Miguel Indurain Height: 6-2 (188 cm) Weight: 174 lbs (79 kg)
- Wiggins Weight: 181 lbs (82 kg)
Related Pages
- Discussion about the Body Size of Tour de France Participants
- fitness testing for cycling
- anthropometry for cycling
- Olympic Games Anthropometry for other sports in 2012
- Athlete Body Size Changes Over Time
- All about fitness testing , including anthropometry testing
- Poll about the fitness components for cycling
- How to measure Height and Weight , and calculate BMI measurement
Search This Site
More cycling.
- Cycling Home
- Fitness Testing
- Tour de France
- Cyclist Profiles
Sport Extra
Check out the 800+ sports in the Encyclopedia of Every Sport . Well not every sport, as there is a list of unusual sports , extinct sports and newly created sports . How to get on these lists? See What is a sport? We also have sports winners lists , and about major sports events and a summary of every year .
Latest Pages
- World Friendship Games
- How We Watch Sport
- Sound Reaction Time
- Trisome Games
Current Events
- Kentucky Derby
- French Open
- Paris Olympics
- 2024 Major Events Calendar
Popular Pages
- Super Bowl Winners
- Ballon d'Or Winners
- World Cup Winners
Latest Sports Added
- Wheelchair Cricket
- SUP Jousting
- Virtual Golf
home search sitemap store
SOCIAL MEDIA
newsletter facebook X (twitter )
privacy policy disclaimer copyright
contact author info advertising
The average speed reached by the winners of the Tour de France increased by 53.9% since the first race in 1903 through 2016. This means an average speed increase rate of 0.42% each Tour.
The upward trend reached its peak at 41.65 km/h with the 7th consecutive win by the US cyclist Lance Armstrong in 2005. Average speeds fell since then until 2010, in spite of the participation of the same fast riders, which suggests more stringent anti-doping regulations and controls (see areppim's insight ). Since 2010, the average speed of the Tour winner resumed its ascending trend, approaching the long-term linear trend (red line in the chart), before slowing down a bit in 2015 and especially in 2016.
One cannot avoid suspecting the doings of illegal sports medical practices to be responsible for such high level performances. Indeed, the 2015 Tour had one rider excluded for positive control on drugs, and hot controversy surrounded the Tour winner's allegedly extraordinary performance. The doping affairs that tarnished the Tour champions' reputations since 1996 cast a dubious halo on the popular sports event. But, for that matter, other sports are not immune: tennis, soccer, running, practically all sport disciplines have been subject to on-going controversy after whistle blowers alerted to a variety of doping practices.
Sources: Le Tour de France
10% off WHOOP memberships!
How Strenuous is the Tour de France? Plus Other Biometric Data Insights

WHOOP tracked pro cyclists’ heart rates, sleep, strain, and HRV during the Tour de France.
Tour de France Cycling Data: Strain, Resting Heart Rate, HRV, Sleep & More
“The Tour de France is arguably the pinnacle of endurance sport performance. WHOOP has allowed us to quantify both the strain and daily recovery of some of the fittest athletes in the world, and the numbers are impressive,” said Kevin Sprouse, Head of Medicine for EF Pro Cycling . The EF squad finished 4th out of 22 teams at the 2020 Tour de France, and was the top team overall for 7 of the race’s 21 stages. Below we’ll share many of the insights gained from monitoring these athletes’ physiological data while competing in one of the most grueling events in sports.
3 Weeks of All-Out Strain
WHOOP quantifies the strain (cardiovascular load) your body takes on each day on a 0-21 scale. Through the Tour’s 21 stages (which spanned just 23 days total with only a pair of days off), the EF riders posted average day strains of 20 or more 13 times . Additionally, on other days they averaged 19.5, 19.4, 19.2, 18.8 and 18.0 (see graphic below). To put that into perspective, WHOOP classifies anything above 18 as an “all-out” effort , meaning the EF athletes basically pushed themselves to the limit nearly every time they got on the bike, for 3 weeks straight. It’s also important to note that the WHOOP strain metric is highly individualized--so if an elite athlete and an average athlete do the same thing, the activity will almost certainly cause less strain for the better athlete. Considering that the EF riders are among the most physically fit humans on the planet (with the ability to take on significantly more cardiovascular load than the average person), the fact that they still put up strains in the 20s on a regular basis is somewhat mind-boggling.

THE AVERAGE DAILY WHOOP STRAIN AND RECOVERY FOR EF RIDERS DURING THE 2020 TOUR DE FRANCE.
Phenomenal resting heart rate and hrv.
Curious just how fit the EF team is? On the day the Tour began, the team members’ average resting heart rate was 42 beats per minute (the American Heart Association says that anything between 60 and 100 bpm is normal to push the standard amount of oxygen through your bloodstream), and their average heart rate variability was 139 milliseconds (the average HRV for all WHOOP members is 64 ms ). As the Tour progressed, it naturally took a toll on these impressive metrics. After the first week, the team’s average RHR had risen to 51 bpm, and its average HRV had dropped to 73 ms. However, it took just one day of rest for these numbers to bounce back. Following the riders’ day off prior to Stage 10, the EF team’s average RHR and HRV were actually better than they were before the race began, at 40 bpm and 152 ms, respectively. The team also averaged a 90% WHOOP recovery (a measure of the body’s readiness to take on strain) after the first rest day, better than the 73% on the morning of Stage 1.
Incredible Recovery
It’d be natural to assume that day after day of all-out strain would significantly hurt the team’s recovery each morning, but that was not the case with the EF riders. “I’ve seen lots of 20.7 [strains],” said Sprouse, “rarely is it lower than 20. What’s just as amazing is the fact that recovery scores tend to be good as well, often 55% and higher. That is a huge testament to the amazing staff we have supporting these guys at the Tour. From the finish line to bedtime, everything is set up to encourage recovery so that they can perform again the following day.” In fact, over the entire 23-day Tour, the team’s average daily recovery never dipped into the red (33% and below). Amazingly, it even stayed in the green (67% and higher) 4 times following stages where the average strain was 20+ (see above).
Pushing Heart Rate to the Limits
Another indication of just how hard these riders pushed themselves is the amount of time they spent at close to their max heart rate . For example, in Stage 8, Neilson Powless was on the bike for a little more than 4 hours. His average heart rate was 165 bpm, and he spent 51% of the time at 80-90% of his max heart rate. Amazingly, he was in the 90-100% of max heart rate zone for 38% of the stage, or 1 hour and 35 minutes .
The Power of Sleep
After crushing themselves on the road all day, effective sleep is obviously an essential aspect of recovery. Powless, in particular, was spectacular at this. The team averaged just shy of 8 hours per night during the Tour, however Powless regularly got about half an hour more than his teammates did. On the night of the race’s second rest day (between Stages 15 and 16), Powless got just over 9 hours of sleep. He also spent 5:51 (a whopping 64% of his time asleep) in what we call the “restorative stages” of sleep ( REM and deep sleep ). People usually only spend about 40-45% of their sleep time in these stages when the body repairs itself. Similarly, following the first rest day, Powless slept for 7:59 and spent 5:02 in REM and deep sleep (63%). This helped him achieve a 92% recovery the next morning. Photo Credits: Getty Images, Jered and Ashley Gruber
Le Tour de France is set to roll, so what makes a perfect bike wheel?

PhD, Sport Performance Analysis, ISEAL, Victoria University
Disclosure statement
David Rouffet does not work for, consult, own shares in or receive funding from any company or organisation that would benefit from this article, and has disclosed no relevant affiliations beyond their academic appointment.
Victoria University provides funding as a member of The Conversation AU.
View all partners

And so, once again, some of the world’s top athletes are about to set forth on the highlight of the professional road racing calendar, Le Tour de France . Before a pedal has even turned, top riders have come into form , fallen out of form and retired from the event due to injury .
As with the riders, the bikes need to be in best shape possible to perform well across the three-week event. And of great concern to both the elite and serious recreational cyclist are wheels – and the engineering that goes into them.
A bike wheel is composed of three main components:
1) the rim ( peripheral part of the wheel) has the specific inner width and diameter of the bead seat (a hoop that forms one edge of a tire) so that it can only be fitted with tyres of matching dimensions. Rims are made for both high-pressure beaded tyres or tubular glue-on tyres.
2) the hub (central part of the wheel) consists of an axle, bearings and a hub shell.
3) the spokes, which lace the rim and hub together under tension
The rules of the Union Cycliste Internationale (UCI) indicate that any wheel can be used during cycling competitions, provided:
- the wheel’s diameter is between 70cm and 55cm, including the tyre
- there are at least 12 spokes with different shapes allowed (i.e. round, flattened or oval), provided no dimension of their various sections exceeds 10mm
- the wheel comes with certification that its rupture characteristics are compatible with those resulting from an impact sustained during a “normal use of the wheel” test (to be obtained from a laboratory approved by the UCI)
Within these broad parameters, wheel manufacturers have come up with a large number of designs that have been approved by the UCI , all of which have been guided by the following considerations:
The power required to accelerate a bike is affected by the weight of the bike plus the rider system. The weight of the system influences its inertia – the term given to the resistance the system offers to changes in its motion.
Both the total weight of the wheel and the weight distribution across the different wheel components have an effect on the longitudinal and rotational components of the wheel’s inertia.
By using lighter wheels, cyclists can accelerate with less energy, but they can also enjoy a better handling of their bike. There are different ways to reduce the weight of the bike wheel, such as reducing the number of spokes or using carbon fiber.
Low density carbon rims (top-end wheels) allow a reduction of wheel weight compared to alloy rimmed wheels or high-density carbon rims (basic wheels).
Studies have shown that, for road grades steeper than 6%, novice and recreational cyclists can maintain a higher bike speed using a light and non-aerodynamic wheel compared to a 500g-heavier aerodynamic wheel.
2) Aerodynamics
The amount of power required to accelerate a bike or maintain a given speed is also affected by the aerodynamics of the wheels. Wheels contribute 10% to 15% of the total aerodynamic resistances/ drag force cyclists have to overcome.
Because it’s located just behind the seat tube, the resistance caused by the rear wheel is about 25% lower than front wheel. The aerodynamic characteristics of bike wheels are generally tested in wind tunnels, at relative wind velocities (velocity of air relative to the bike) and yaw angles that are typically observed on the road (between 30 and 60km/h).
A reduction of 2-3% of the total aerodynamic resistance can be obtained through optimisation of the bike wheel aerodynamics. Over a 40km time trial, aerodynamic wheels can provide performance improvements ranging from 60 seconds in elite cyclists to 67 seconds in recreational cyclists, compared to conventional wheels.
Different methods are employed to improve the aerodynamics of bike wheels, such as designing deeper rims with toroidal (doughnut-shaped) cross sections to replace thin rims with flat profiles. The different shapes can have an effect on how well the wheel works at yaw such as a crosswind.
Rim depths of between 45-60mm seem to offer a good aerodynamic compromise (low aerodynamic resistances and good handling). Thanks to the ease of molding carbon, subtle improvements in rim design can be readily incorporated to improve wheels aerodynamics.
Reducing the number of spokes and also using shaped spokes can also reduce the drag of the wheel. Solid disc wheels generally have low aerodynamic resistances. This is why pursuit track cyclists are using solid disc wheels on their front and rear wheels. The video below – of the Australian Olympic men’s pursuit squad – is illustrative.
However, road cyclists should not run a disk on their front wheel if there is any chance of wind, as the side forces that apply to the front wheel will make the bike difficult to handle.
3) Stiffness
Because of their structure (rim and hub laced together with spokes under tension) bike wheels are designed to minimise power losses rather than to reduce the vibrations generated across road irregularities, although shallow rims give a smoother ride than deep rims.
The stiffness of the wheel will help determine how much power can be transferred from the hub to the rim. This is particularly important for the rear wheel, as cyclists expect the power they generate at the pedals to be translated into sharp accelerations of the bike.
The power transfer is also influenced by the lacing pattern of the spokes. These include no crossings (radial spoking), paired spokes, multiple crossings in both dimensions (lateral and longitudinal).
The rigidness of the hub is also important for maintaining the wheel’s bearing alignment and minimising power losses.
Generally speaking, stiffness is improved by using a stiff and deep rim, large spokes, a high bracing angle, and high-tensioned spokes.
4) Material resistance
Heat dissipation from braking is an important design consideration in wheels, given carbon composite is a poor conductor of heat compared with aluminium. Some carbon rims have failed after heavy braking, such as that employed while descending mountains, due to the resin becoming soft due to overheating.
If you are riding on cobblestones – such as during Paris-Roubaix or Strade Bianche races (see video above and top) – the wheel’s impact resistance becomes a very important factor. In such conditions, wheel design is adjusted through an increase in the number of spokes in order to ensure durability.
Because light carbon composite materials can have less impact resistance than other available materials, their use for the rims has to be carefully considered if good impact resistance is expected.
Will any of these factors make enough of a difference to influence the Tour results come July 22 in Paris? Will they make enough a difference on your local crit race or sprint effort at the end of a weekend group ride? They just might.
This article was co-authored by Raoul Luescher, Director of Luescher Teknik .
Further reading:
- High-end bikes for sale … but what are you really buying?
- Cadel Evans and other machines: the science of the Tour de France time trial
- Science of elite cycling: Tour de France (stage 1 to 11)
- Science of elite cycling: Tour de France (stage 12 to 21)
- Tour de France
Project Offier - Diversity & Inclusion
Senior Lecturer - Earth System Science
Sydney Horizon Educators (Identified)
Deputy Social Media Producer
Associate Professor, Occupational Therapy
Official games
2023 Edition
- Stage winners
- All the videos
Tour Culture
- Commitments
- key figures
- Sporting Stakes
- "Maillot Jaune" Collection
- The jerseys
"Tour de France Cycle City" label: soon 150 towns and 10 countries in the loop?
As part of its "Riding into the Future" programme to promote sustainable mobility, the Tour de France launched the "Tour de France Cycle City" label in 2021, encouraging all the initiatives taken by towns and cities that have already hosted the Grande Boucle to promote everyday cycling.
For this fourth edition, the Tour de France and the Tour de France Femmes avec Zwift have received bids from 24 cities, including six outside France. This year, 16 towns on the 2024 Tour de France route have applied, and two are on the 2024 Tour de France Femmes avec Zwift map, which should take the number of approved cities to 150... in 10 different countries!
The results will be announced on 15 May as part of the “Mai à vélo” (Bike in May) campaign.
150! That's the symbolic milestone the "Tour de France Cycle City" label could reach in its fourth edition. This initiative, created in 2021, enables towns that have already hosted the Grande Boucle to have their commitment to developing cycling in all its forms assessed and rewarded. Whether they are French or foreign, rural or urban, towns applying for the label must highlight all the existing measures to encourage cycling in their application and present local short- and medium-term development plans (infrastructure deployment, improving rider safety, learning to cycle with the "How to ride a bike" campaign, parking and combating theft, maintenance and repair, etc.). All these measures contribute to the growth of cycling as a means of daily transport, a source of leisure, and exercise.
Since 2021, 133 cities in eight countries have already received at least one level of accreditation. With 24 applications, the 2024 campaign could see the number of towns and cities recognised for promoting cycling rise to 150. In addition to the new French and Belgian cities that could appear on the map, two new territories are about to join the club, representing ten countries with towns awarded the label! Italy, where the Tour de France will set off on 29 June for the first time in its history, has three candidates: Rimini, Piacenza and Pinerolo. More exotic still, Japan, which for over ten years has welcomed the champions of the Grande Boucle to Saitama in the middle of autumn as part of a festive criterium reminiscent of the Asian craze for the event, could also be in the running!
Sixteen French towns on the route of the 2024 Tour and two others on the Tour de France Femmes avec Zwift submitted bids, from Evaux-les-Bains, the least populous of the candidate towns, to Nice, the host town of a new and spectacular finish of the Tour de France on 21 July, reflecting the diversity of bids once again this year for a label that allows towns to showcase their assets on their scale. Four French cities that have hosted the event in the past have also applied, while two municipalities that have already received the label have requested a reassessment of their rating. The jury is now studying all the applications. The results will be announced to the candidate cities on 15 May 2024 as part of the "Bike in May" campaign.
Composition of the jury for the "Tour de France Cycle City" label: Christian Prudhomme, Director of the Tour de France; Émilie Defay, deputy editor-in-chief at France Bleu Paris; Jean Ghedira, director of communications, sponsorship and general secretariat at LCL; David Lazarus, mayor of Chambly and chairman of the "Sports" working group of the Association des Maires de France; Olivier Schneider, president of the FUB (French Federation of Bicycle Users); Karine Bozzacchi, CSR manager for the Tour de France.
Candidate cities for the 2024 label:
You may also enjoy

Tourtel Twist to continue to add zest to the Tour de France

Predict the winner of Liège-Bastogne-Liège

Predict the winner of La Flèche Wallonne 2024!
Receive exclusive news about the Tour

Accreditations
Privacy policy, your gdpr rights.
- Topics ›
- Sports in Europe ›
Can the Tour de France Shake Its Tarnished Past?
Tour de france.
The 2017 Tour de France hasn’t even started yet but it is already overshadowed by another doping case. Portuguese rider André Cardoso of team Trek-Segafredo was tested positive for EPO and subsequently suspended. A teammate to former Tour de France champion and convicted doping offender Alberto Contador, Cardoso asserted his innocence in a Facebook post , asking the public not to judge him prematurely. The Tour de France, which is set to start in Düsseldorf (Germany) on Saturday, has been trying to restore its image for several years after more than a decade of doping scandal after doping scandal. As our chart illustrates, 2 in 3 winners of the past 20 years were tested positive for performance enhancing drugs or admitted to doping at a some stage during or after their career. American cyclist Lance Armstrong, who won the Tour seven consecutive times after surviving testicular cancer, was perhaps the most prominent case. Having fought off doping accusations for years, Armstrong had publicly admitted to systematic doping in a TV interview in 2013. He was subsequently stripped of all his Tour de France titles.
Description
This chart shows which Tour de France winners of the past 20 years have a doping history.
Can I integrate infographics into my blog or website?
Yes, Statista allows the easy integration of many infographics on other websites. Simply copy the HTML code that is shown for the relevant statistic in order to integrate it. Our standard is 660 pixels, but you can customize how the statistic is displayed to suit your site by setting the width and the display size. Please note that the code must be integrated into the HTML code (not only the text) for WordPress pages and other CMS sites.

Infographic Newsletter
Statista offers daily infographics about trending topics, covering: Economy & Finance , Politics & Society , Tech & Media , Health & Environment , Consumer , Sports and many more.
Related Infographics
The countries dominating the tour de france, where cycling has an uphill battle for fans, doping in sports, russia: the gold standard in olympic doping, tour de france: too fast to be clean, americans lose interest in post-armstrong tour de france, fortnite world champion bags $3 million prize, tour de france: the 20-year fight against doping, how esport prize purses compare to traditional sports, winter olympics, the most successful nations at the olympic winter games, countries with athletes in rio who have had a doping suspension, the vast extent of russia's state sponsored doping scandal.
- Who may use the "Chart of the Day"? The Statista "Chart of the Day", made available under the Creative Commons License CC BY-ND 3.0, may be used and displayed without charge by all commercial and non-commercial websites. Use is, however, only permitted with proper attribution to Statista. When publishing one of these graphics, please include a backlink to the respective infographic URL. More Information
- Which topics are covered by the "Chart of the Day"? The Statista "Chart of the Day" currently focuses on two sectors: "Media and Technology", updated daily and featuring the latest statistics from the media, internet, telecommunications and consumer electronics industries; and "Economy and Society", which current data from the United States and around the world relating to economic and political issues as well as sports and entertainment.
- Does Statista also create infographics in a customized design? For individual content and infographics in your Corporate Design, please visit our agency website www.statista.design
Any more questions?
Get in touch with us quickly and easily. we are happy to help.
Feel free to contact us anytime using our contact form or visit our FAQ page .
Statista Content & Design
Need infographics, animated videos, presentations, data research or social media charts?
More Information
The Statista Infographic Newsletter
Receive a new up-to-date issue every day for free.
- Our infographics team prepares current information in a clear and understandable format
- Relevant facts covering media, economy, e-commerce, and FMCG topics
- Use our newsletter overview to manage the topics that you have subscribed to
IMAGES
COMMENTS
Tour de France 2024 - Official site of the famed race from the Tour de France. Includes route, riders, teams, and coverage of past Tours. Club 2024 route 2024 Teams 2023 Edition Rankings Stage winners All the videos. Grands départs Tour Culture news ...
The Countries Dominating the Tour de France. The 2023 Tour de France stopped rolling yesterday, with Denmark's Jonas Vingegaard once again taking the prestigious lion on the Champs Elysees. At 26 ...
The 2024 Tour de France includes 52,230 metres of vertical gain across 3,492km of climbs, sprints and time trialling from Italy into France, with fewer high climbs than in the past and shorter ...
We turn cycling data into meaningful charts to help you gain insights about the world's most heroic sport. Home; Performance. Individual performance; Team performance; Country performance; ... Tour de France 2021 GC Breakdown; The most exciting grand tour 2014 - 2018; Flat races of the Tour de France are boring; Categories. General (2 ...
By Deepali Kank The Tour de France, an iconic, multiple-stage bicycle race, is a yearly spectacle that captivates cycling enthusiasts worldwide. Renowned for its prestige and demanding nature, this historic event traces its roots back to 1903, when it was conceived by the French newspaper L'Auto to boost its circulation. Today, it stands as a… Read More »Tour de France: explained in charts
This is an Excel replica of excellent Tableau visual on Tour de France winner data made by Marc Reid. Last week I saw a stunning visualization on Tour de France using radial charts. I wanted to replicate it in Excel. So here we go.
The total distance of the Tour de France 2022 is 3,328 kilometres (2,068 miles), with only two rest days for riders along the way. It takes in the second-shortest total distance of the past decade.
The 2022 edition of the Tour was the fastest in the race's history. The average speed of winner Jonas Vingegaard for the 21-stage race set a new record at 42.03km/h (26.12mph) Combining every ...
Summary. Stage four of the Tour de France starts in Dax and ends in Nogaro; Bunch sprint expected at the finish of flat 181.8km route; Britain's Mark Cavendish would break Eddy Merckx's record for ...
Denmark's Jonas Vingegaard sealed his second successive Tour de France triumph after the 110th edition of the race ended in Paris on Sunday. The 26-year-old Jumbo-Visma rider beat two-time winner ...
The Tour de France's mythical number 51 Eddy Merckx won the 1969 Tour de France clad in number 51; that number would win again four times in the next 10 years. (Image credit: Getty Images)
Jul 24, 2023. Denmark's Jonas Vingegaard claimed his second Tour de France victory on Sunday, completing the grueling 3-week, 3,401 kilometer competition with an average speed of 41.12 km/h (25.55 ...
The smallest winning margin at the Tour de France. Laurent Fignon in 1989 (Image credit: AFP via Getty Images) Greg LeMond - 8 seconds, 1989. Alberto Contador - 23 seconds, 2007. Oscar Pereiro - 32 seconds, 2006. Jan Janssen - 38 seconds, 1968. Stephen Roche - 40 seconds, 1987. Bernard Thevenet - 48 seconds, 1977. Chris Froome - 54 seconds, 2017.
Jonas Vingegaard claimed back-to-back Tour de France titles beating main rival Tadej Pogacar into second place in a repeat of the 2022 result.. Jordi Meeus (Bora-Hansgrohe) produced the best result of his career, winning the final stage on his Le Tour debut. He triumphed in a photo finish beating Jasper Philipsen and Dylan Groenewegen into second and third place, respectively.
How the 2022 Tour de France was won. 22 teams of eight riders set off from Copenhagen on July 1st 2022. I've arranged them here in club colors and grid formation to give an idea of the peloton's size. The 186 riders who started the 2022 race. Data from procyclingstats.com and letour.fr.
Tour de France riders with the most stage wins 1903-2023 Tour de France: Spanish winners 1903-2023 + Premium statistics
There have been allegations of doping in the Tour de France since the race began in 1903. Early Tour riders consumed alcohol and used ether, among other substances, as a means of dulling the pain of competing in endurance cycling. Riders began using substances as a means of increasing performance rather than dulling the senses, and organizing bodies such as the Tour and the International ...
Table of Tour de France Winner's Body Size. The table below lists all known heights and weights of Tour de France champions. There is a lot of missing data from prior to the 1940s. Weight values are to the nearest kg or lb. Body mass index has been calculated from the height and weight data.
areppim chart of average speeds of the Tour de France since 1903.The average speed reached by the winners of the Tour de France increased by 53.9% since the first race in 1903 through 2016. This means an average speed increase rate of 0.42% each Tour.
"The Tour de France is arguably the pinnacle of endurance sport performance. WHOOP has allowed us to quantify both the strain and daily recovery of some of the fittest athletes in the world, and the numbers are impressive," said Kevin Sprouse, Head of Medicine for EF Pro Cycling. The EF squad finished 4th out of 22 teams at the 2020 Tour de ...
Tour de France 2024 - Official site of the famed race from the Tour de France. Includes route, riders, teams, and coverage of past Tours. Club 2024 route 2024 Teams 2023 Edition Rankings Stage winners All the videos. Grands départs Tour Culture news ...
Blood, sweat and tears goes into Le Tour, and the design of high-performance bike wheels. Guillaume Horcajuelo/EPA. X (Twitter) And so, once again, some of the world's top athletes are about to ...
150! That's the symbolic milestone the "Tour de France Cycle City" label could reach in its fourth edition. This initiative, created in 2021, enables towns that have already hosted the Grande Boucle to have their commitment to developing cycling in all its forms assessed and rewarded. Whether they are French or foreign, rural or urban, towns applying for the label must highlight all the ...
The Tour de France, which is set to start in Düsseldorf (Germany) on Saturday, has been trying to restore its image for several years after more than a decade of doping scandal after doping ...