We may earn money when you buy through our links.
Home | News | Florida’s Safest Cities of 2024

Florida’s Safest Cities of 2024

Here are the 5 Safest Cities in Florida for 2024
- Marco Island
- Sunny Isles Beach
See crime rates for the safest cities .
With crime rates that are lower than nationwide averages, it's surprising that Floridians are among the most concerned about crime and safety in the US. From those we surveyed, more than one in two Floridians (53%) feel a high daily level of concern for their safety—but that's a 13% decline year over year.
Just four in 10 Floridians (39%) surveyed say they feel safe in their state, the eighteenth-lowest safety confidence in the nation.
In this report
- Property crime rates
- Violent crime rates
- Interesting findings
- The Safest Cities
- Methodology
How to make a safe home anywhere
- How other cities compare
- How other states compare

By signing up, you agree to our Terms and Conditions and Privacy Policy.
NOTE: If your city is missing from our full report, it means that it was below the population threshold or didn’t submit a complete crime report to the FBI in 2022 .
2024 Florida crime rates
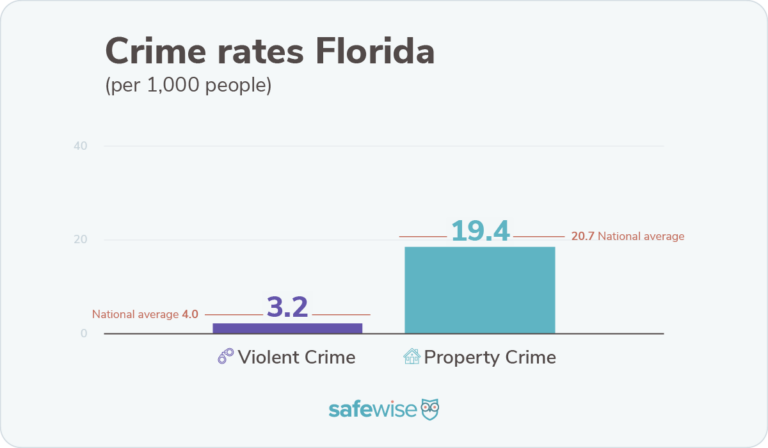
Image: SafeWise
Both violent crime and property crime are below national averages in Florida. Violent crime is lower than it was in 2022 (the last year for which we had data), with 3.2 incidents per 1,000 people, putting Florida below the national violent crime rate of 4.0 per 1,000.
But the Sunshine State saw a rise in property crime since our 2022 report—seeing 19.4 incidents per 1,000. That still puts Florida below the nationwide rate of 20.7.
Compared to the rest of the US, Florida has the fourteenth lowest violent crime rate and the twenty-second lowest property crime rate.
Property crime in Florida: Fear vs. reality
Property crime is more of a concern for Floridians than most other issues, and that concern seems to drive residents to take proactive action when it comes to home security. Florida shows a higher number of residents who use crime-deterring measures like security cameras and security systems .
- Property crime is a top concern for 55% of the Floridians we talked to (US 52%).
- Florida's property crime rate is 19.4 incidents per 1,000 people—that's 6% below the nationwide rate of 20.7.
- 19% of respondents experienced property crime in the year prior to the survey—31% below the national average and the third lowest in the nation.
- Package theft is the least worrisome crime issue in Florida, with 53% concerned about it every day (US 53%).
- 27% of Florida residents in our survey said they experienced package theft in the 12 months prior to the survey—the third-lowest in the US.
- 8 in 10 Floridians (81%) use some kind of property protection. Security cameras (49%) and security systems (39%) are the most popular in The Sunshine State.
- 35% of respondents told us they increased security measures in the 12 months prior to the survey.
What security measures do Floridians use most?

How to stay safe in Florida
Florida is #4 in the US for worry about gun violence.

Florida is #9 in the US for increasing security measures in the past year.

What crimes are Florida residents most concerned about?

Violent crime in Florida: Fear vs. reality
Florida’s violent crime rate went down from 3.8 incidents per 1,000 people in our 2022 report to 3.2. The US held course year over year, remaining at 4.0 violent crime incidents per 1,000 people. Bucking nationwide trends, survey respondents reported experience with violent crime in Florida went down 19% year over year.
- Florida's violent crime rate is 19% below the nationwide rate.
- Concern about violent crime increased from 53% to 54% year over year (US 50%).
- 13% of survey respondents reported an experience with violent crime in the 12 months prior to the survey. That's a 19% decrease year over year, and the fourteenth lowest level of experience in the US.
- 33% of Florida residents use some form of personal protection , with pocket knives, pepper spray , and concealed firearms each named by 42% of respondents.
- 39% of Florida respondents said they feel safe in their state—a 7% drop year over year (US 45%).
Attitudes about gun violence in Florida
- Nearly 7 in 10 Florida respondents (68%) said that gun violence is their top daily safety concern (US 51%), and 17% reported a personal experience with gun violence in the past 12 months, exceeding the US average of 12%.
- There were 30 mass shooting incidents reported in Florida in 2023, 1 fewer than the previous year.
- Concealed carry firearms are one of the most popular forms of personal protection, carried by 42% of survey respondents that use personal safety devices.
- Firearms are the fourth choice for property protection in Florida, with 23% of respondents using them.
A closer look at the safest cities in Florida
For the purposes of this report, the terms “dangerous” and “safest” refer explicitly to crime rates as calculated from FBI crime data—no other characterization of any community is implied or intended.
- 8 cities met criteria to be considered for ranking.
- Marco Island is the safest city in Florida, with fewer than 100 total crimes reported.
- 3 cities reported zero murders: Marco Island, Sunny Isles , and Doral .
- Kissimmee is the only city to report a higher per capita violent crime rate than the nationwide average, reporting 4.1 incidents per 1,000 people. But the city fared better with property crime, reporting 3 fewer incidents per 1,000 people than the nationwide average.
- Largo is the largest city on the list with over 80,000 residents, making its low violent crime rate of 3.6 even more impressive.
- The collective violent crime rate of the safest cities is 2.8 incidents per 1,000—12% lower than the statewide rate.
- The collective property crime rate of the safest cities is 17.8 incidents per 1,000—8% below the statewide rate.
The 5 safest cities in Florida

How we determined the safest cities
Learn how we identified the safest cities on our methodology page .
Over 6 in 10 Americans surveyed don't have a home security system, despite over 50% of all burglaries being residential. Unfortunately, a majority of people who have a security system added it after they had a break-in. One of the best ways to stop a burglary before it happens—and get immediate help if a break-in is detected—is to add a monitored home security system.
Find out which companies we recommend for every budget and lifestyle in our roundup of the Best Home Security Systems —and learn the basics with our guide on Everything You Need to Know About Home Security .
Find security and safety resources in your area
Alabama Alaska Arizona Arkansas California Colorado Connecticut Delaware Florida Georgia Hawaii Idaho Illinois
Indiana Iowa Kansas Kentucky Louisiana Maine Maryland Massachusetts Michigan Minnesota Mississippi Missouri Montana
Nebraska Nevada New Hampshire New Jersey New Mexico New York North Carolina North Dakota Ohio Oklahoma Oregon Pennsylvania
Rhode Island South Carolina South Dakota Tennessee Texas Utah Vermont Virginia Washington West Virginia Wisconsin Wyoming
Find the safest cities in each state
Click on the state below to check out the safest cities for each state.
Related articles on SafeWise
- Best Home Security Systems
- Best Home Security Cameras
- Best Video Doorbell Cameras
- Burglary Stats & Facts
- Over 50% Of All Burglaries Are Residential—How To Protect Your Family
- The Best Personal Safety Devices for Every Situation
Endnotes and sources
Find all endnotes and sources in our full methodology .
FBI Crime Data Explorer, " Documents & Downloads ." Accessed March 18, 2024.
- Offenses Known to Law Enforcement
- 2022 NIBRS Estimation Tables
Bureau of Justice Statistics, " National Incident-Based Reporting System (NIBRS) ." Accessed March 18, 2024.
Gun Violence Archive, " Mass Shootings ." Accessed March 18, 2023.
SafeWise experts have years of firsthand experience testing the products we recommend. Learn how we test and review .
Recent Articles

About Contact Press News Deals
Home Security Internet Security Home Safety Family Safety Senior Safety
Car Safety Smart Home Emergency Prep Pet Safety Personal Safety
Subscribe to SafeWise for updates on safety news, product releases, and deals!
Terms of Service | Privacy Policy | How We Rank and Review |
*SafeWise has conducted impartial research to recommend products. This is not a guarantee. Each individual’s unique needs should be considered when deciding on chosen products.
©2024 SafeWise. All rights reserved.
Florida's 25 Safest Cities - Updated 2023
Safe Havens Unveiled: Exploring the 25 Safest Cities in Florida
Author: CrimeData.io Research Team
Last Updated: 2024-04-03 (7 days ago)
In a world where safety and security are paramount, finding the perfect place to call home becomes a top priority. Join us on a journey as we uncover the 25 safest cities across Florida. From tranquil suburbs to vibrant urban centers, these communities offer not only peace of mind but also a high quality of life.
Where does the crime data come from?
This comprehensive list of the safest and most dangerous cities in Florida is backed by credible data sourced directly from the FBI's National Incident-Based Reporting System (NBIRS). By relying on this authoritative database, we ensure that the information presented here is not only accurate but also up-to-date. The FBI's NBIRS system is a trusted source for crime statistics, providing valuable insights into the security landscapes of cities and communities across the nation.
How do we rank the cities?
Our ranking system is based on the total number of crimes reported in each city. We then calculated the crime rate per 100,000 population for each city. The cities with the lowest crime rates were ranked as the safest cities in Florida. Conversely, the cities with the highest crime rates were ranked as the most dangerous cities in Florida.
To ensure the relevance and accuracy of our rankings, this list includes only cities and communities in Florida with a population of more than 5,000 residents. This population threshold allows us to focus on areas where a significant number of people live and work, providing a meaningful perspective on safety for the majority of our readers.
The data presented in this report spans a period from 2012 to 2021. By aggregating information over this decade, we gain valuable insights into the trends and changes in safety and crime rates within Florida. This long-term perspective allows us to identify both short-term fluctuations and broader patterns, providing a comprehensive view of the security landscape in the state.
#25 Middleburg
County: Clay
Crime per 100,000 population
vs. Florida average
vs. US average 🇺🇸
Chart of total crime rate in Middleburg from 2012 to 2022
Middleburg is an area in Clay, Florida with population of 12,127. The total crime rate in Middleburg is based on the nearest law agency agency, Clay County Sheriff's Office (FL0100000). Middleburg total crime rate is 272 per 100,000 population, compared to Florida average of 2,904.06 per 100,000 population and United States average of 2,912.43 per 100,000 population.
#24 Asbury Lake
Chart of total crime rate in Asbury Lake from 2012 to 2022
Asbury Lake is an area in Clay, Florida with population of 11,629. The total crime rate in Asbury Lake is based on the nearest law agency agency, Clay County Sheriff's Office (FL0100000). Asbury Lake total crime rate is 272 per 100,000 population, compared to Florida average of 2,904.06 per 100,000 population and United States average of 2,912.43 per 100,000 population.
#23 Ave Maria
County: Collier
Chart of total crime rate in Ave Maria from 2012 to 2022
Ave Maria is an area in Collier, Florida with population of 5,018. The total crime rate in Ave Maria is based on the nearest law agency agency, Collier County Sheriff's Office (FL0110000). Ave Maria total crime rate is 267 per 100,000 population, compared to Florida average of 2,904.06 per 100,000 population and United States average of 2,912.43 per 100,000 population.
#22 Tavares
County: Lake
Chart of total crime rate in Tavares from 2012 to 2022
Tavares is an area in Lake, Florida with population of 18,290. The total crime rate in Tavares is based on the nearest law agency agency, Lake County Sheriff's Office (FL0350000). Tavares total crime rate is 266 per 100,000 population, compared to Florida average of 2,904.06 per 100,000 population and United States average of 2,912.43 per 100,000 population.
#21 West Vero Corridor
County: Indian River
Chart of total crime rate in West Vero Corridor from 2012 to 2022
West Vero Corridor is an area in Indian River, Florida with population of 10,158. The total crime rate in West Vero Corridor is based on the nearest law agency agency, Indian River County Sheriff's Office (FL0310000). West Vero Corridor total crime rate is 257 per 100,000 population, compared to Florida average of 2,904.06 per 100,000 population and United States average of 2,912.43 per 100,000 population.
#20 Sugarmill Woods
County: Citrus
Chart of total crime rate in Sugarmill Woods from 2012 to 2022
Sugarmill Woods is an area in Citrus, Florida with population of 10,629. The total crime rate in Sugarmill Woods is based on the nearest law agency agency, Hernando County Sheriff's Office (FL0270000). Sugarmill Woods total crime rate is 254 per 100,000 population, compared to Florida average of 2,904.06 per 100,000 population and United States average of 2,912.43 per 100,000 population.
#19 Spring Hill
County: Hernando
Chart of total crime rate in Spring Hill from 2012 to 2022
Spring Hill is an area in Hernando, Florida with population of 179,668. The total crime rate in Spring Hill is based on the nearest law agency agency, Hernando County Sheriff's Office (FL0270000). Spring Hill total crime rate is 254 per 100,000 population, compared to Florida average of 2,904.06 per 100,000 population and United States average of 2,912.43 per 100,000 population.
#18 North Weeki Wachee
Chart of total crime rate in North Weeki Wachee from 2012 to 2022
North Weeki Wachee is an area in Hernando, Florida with population of 7,257. The total crime rate in North Weeki Wachee is based on the nearest law agency agency, Hernando County Sheriff's Office (FL0270000). North Weeki Wachee total crime rate is 254 per 100,000 population, compared to Florida average of 2,904.06 per 100,000 population and United States average of 2,912.43 per 100,000 population.
#17 Key Biscayne
County: Miami-Dade
Chart of total crime rate in Key Biscayne from 2012 to 2022
Key Biscayne is an area in Miami-Dade, Florida with population of 14,530. The total crime rate in Key Biscayne is based on the nearest law agency agency, Key Biscayne Police Department (FL0134300). Key Biscayne total crime rate is 250 per 100,000 population, compared to Florida average of 2,904.06 per 100,000 population and United States average of 2,912.43 per 100,000 population.
#16 Winter Springs
County: Seminole
Chart of total crime rate in Winter Springs from 2012 to 2022
Winter Springs is an area in Seminole, Florida with population of 38,021. The total crime rate in Winter Springs is based on the nearest law agency agency, Winter Springs Police Department (FL0590600). Winter Springs total crime rate is 248 per 100,000 population, compared to Florida average of 2,904.06 per 100,000 population and United States average of 2,912.43 per 100,000 population.
County: Orange
Chart of total crime rate in Bithlo from 2012 to 2022
Bithlo is an area in Orange, Florida with population of 10,507. The total crime rate in Bithlo is based on the nearest law agency agency, Seminole County Sheriff's Office (FL0590000). Bithlo total crime rate is 243 per 100,000 population, compared to Florida average of 2,904.06 per 100,000 population and United States average of 2,912.43 per 100,000 population.
Chart of total crime rate in Ojus from 2012 to 2022
Ojus is an area in Miami-Dade, Florida with population of 16,530. The total crime rate in Ojus is based on the nearest law agency agency, Aventura Police Department (FL0139100). Ojus total crime rate is 175 per 100,000 population, compared to Florida average of 2,904.06 per 100,000 population and United States average of 2,912.43 per 100,000 population.
#13 North Miami Beach
Chart of total crime rate in North Miami Beach from 2012 to 2022
North Miami Beach is an area in Miami-Dade, Florida with population of 43,357. The total crime rate in North Miami Beach is based on the nearest law agency agency, Aventura Police Department (FL0139100). North Miami Beach total crime rate is 175 per 100,000 population, compared to Florida average of 2,904.06 per 100,000 population and United States average of 2,912.43 per 100,000 population.
#12 Aventura
Chart of total crime rate in Aventura from 2012 to 2022
Aventura is an area in Miami-Dade, Florida with population of 39,734. The total crime rate in Aventura is based on the nearest law agency agency, Aventura Police Department (FL0139100). Aventura total crime rate is 175 per 100,000 population, compared to Florida average of 2,904.06 per 100,000 population and United States average of 2,912.43 per 100,000 population.
#11 St. Augustine Beach
County: St. Johns
Chart of total crime rate in St. Augustine Beach from 2012 to 2022
St. Augustine Beach is an area in St. Johns, Florida with population of 6,688. The total crime rate in St. Augustine Beach is based on the nearest law agency agency, St. Johns County Sheriff's Office (FL0550000). St. Augustine Beach total crime rate is 163 per 100,000 population, compared to Florida average of 2,904.06 per 100,000 population and United States average of 2,912.43 per 100,000 population.
#10 St. Augustine
Chart of total crime rate in St. Augustine from 2012 to 2022
St. Augustine is an area in St. Johns, Florida with population of 78,386. The total crime rate in St. Augustine is based on the nearest law agency agency, St. Johns County Sheriff's Office (FL0550000). St. Augustine total crime rate is 163 per 100,000 population, compared to Florida average of 2,904.06 per 100,000 population and United States average of 2,912.43 per 100,000 population.
Chart of total crime rate in Nocatee from 2012 to 2022
Nocatee is an area in St. Johns, Florida with population of 19,601. The total crime rate in Nocatee is based on the nearest law agency agency, St. Johns County Sheriff's Office (FL0550000). Nocatee total crime rate is 163 per 100,000 population, compared to Florida average of 2,904.06 per 100,000 population and United States average of 2,912.43 per 100,000 population.
#8 Wedgefield
Chart of total crime rate in Wedgefield from 2012 to 2022
Wedgefield is an area in Orange, Florida with population of 7,912. The total crime rate in Wedgefield is based on the nearest law agency agency, Oviedo Police Department (FL0590400). Wedgefield total crime rate is 161 per 100,000 population, compared to Florida average of 2,904.06 per 100,000 population and United States average of 2,912.43 per 100,000 population.
#7 Union Park
Chart of total crime rate in Union Park from 2012 to 2022
Union Park is an area in Orange, Florida with population of 10,334. The total crime rate in Union Park is based on the nearest law agency agency, Oviedo Police Department (FL0590400). Union Park total crime rate is 161 per 100,000 population, compared to Florida average of 2,904.06 per 100,000 population and United States average of 2,912.43 per 100,000 population.
Chart of total crime rate in Oviedo from 2012 to 2022
Oviedo is an area in Seminole, Florida with population of 39,405. The total crime rate in Oviedo is based on the nearest law agency agency, Oviedo Police Department (FL0590400). Oviedo total crime rate is 161 per 100,000 population, compared to Florida average of 2,904.06 per 100,000 population and United States average of 2,912.43 per 100,000 population.
Chart of total crime rate in Alafaya from 2012 to 2022
Alafaya is an area in Orange, Florida with population of 92,080. The total crime rate in Alafaya is based on the nearest law agency agency, Oviedo Police Department (FL0590400). Alafaya total crime rate is 161 per 100,000 population, compared to Florida average of 2,904.06 per 100,000 population and United States average of 2,912.43 per 100,000 population.
County: Santa Rosa
Chart of total crime rate in Milton from 2012 to 2022
Milton is an area in Santa Rosa, Florida with population of 10,040. The total crime rate in Milton is based on the nearest law agency agency, Santa Rosa County Sheriff's Office (FL0570000). Milton total crime rate is 139 per 100,000 population, compared to Florida average of 2,904.06 per 100,000 population and United States average of 2,912.43 per 100,000 population.
#3 East Milton
Chart of total crime rate in East Milton from 2012 to 2022
East Milton is an area in Santa Rosa, Florida with population of 14,566. The total crime rate in East Milton is based on the nearest law agency agency, Santa Rosa County Sheriff's Office (FL0570000). East Milton total crime rate is 139 per 100,000 population, compared to Florida average of 2,904.06 per 100,000 population and United States average of 2,912.43 per 100,000 population.
#2 South Miami
Chart of total crime rate in South Miami from 2012 to 2022
South Miami is an area in Miami-Dade, Florida with population of 11,997. The total crime rate in South Miami is based on the nearest law agency agency, Coral Gables Police Department (FL0130200). South Miami total crime rate is 135 per 100,000 population, compared to Florida average of 2,904.06 per 100,000 population and United States average of 2,912.43 per 100,000 population.
#1 Coral Gables
Chart of total crime rate in Coral Gables from 2012 to 2022
Coral Gables is an area in Miami-Dade, Florida with population of 49,269. The total crime rate in Coral Gables is based on the nearest law agency agency, Coral Gables Police Department (FL0130200). Coral Gables total crime rate is 135 per 100,000 population, compared to Florida average of 2,904.06 per 100,000 population and United States average of 2,912.43 per 100,000 population.
Factors Influencing Crime Rates in Florida
Numerous factors contribute to the prevalence of violent crimes within a given area. It's important to note that FBI statistics primarily focus on population figures and reported violent crimes, often overlooking the intricate dynamics behind these numbers. Each city in-->