Developer Tools
Database Plugins
Isochrone API
Distance Map API
v4/distance-map
Travel Time Matrix API
Geocoding API
/v4/geocoding
Additional API Reference
Error Handling
About the plugin

Quick tools
Toolbox tools
About the macros
Reference manual
This reference manual covers all features of the traveltime plugin for qgis..
For an introduction about how to use it, you may prefer to have a look at the tutorials first. To learn more about TravelTime and to discuss commercial licences visit our website .
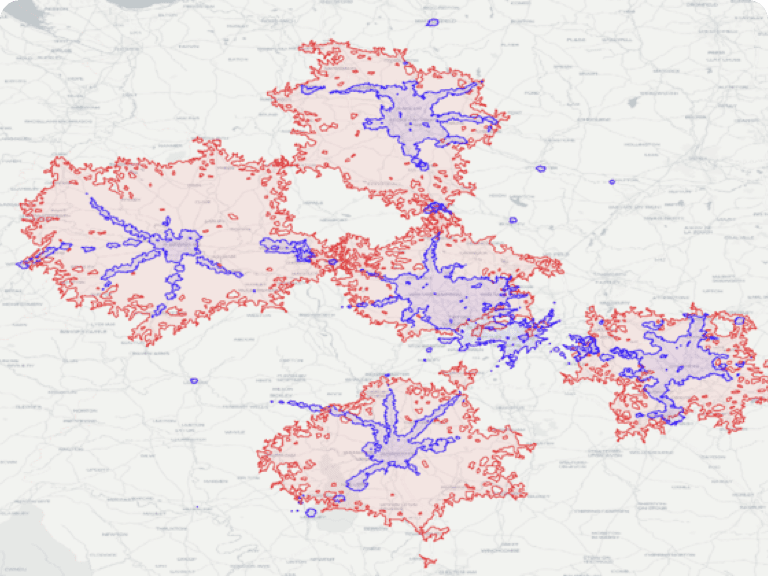
Returns a polygon corresponding to the area that can be covered in a certain amount of time by your chosen mode of transport.
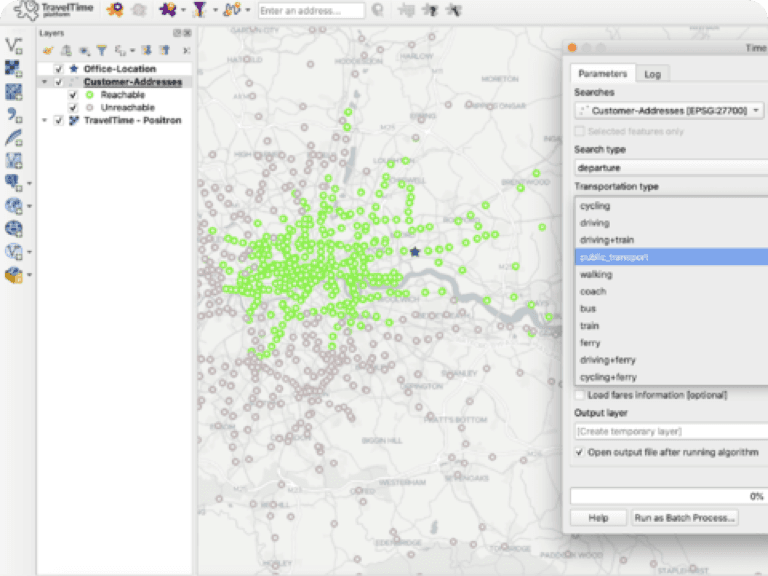
Filter a set of points according to the travel time from a certain origin.
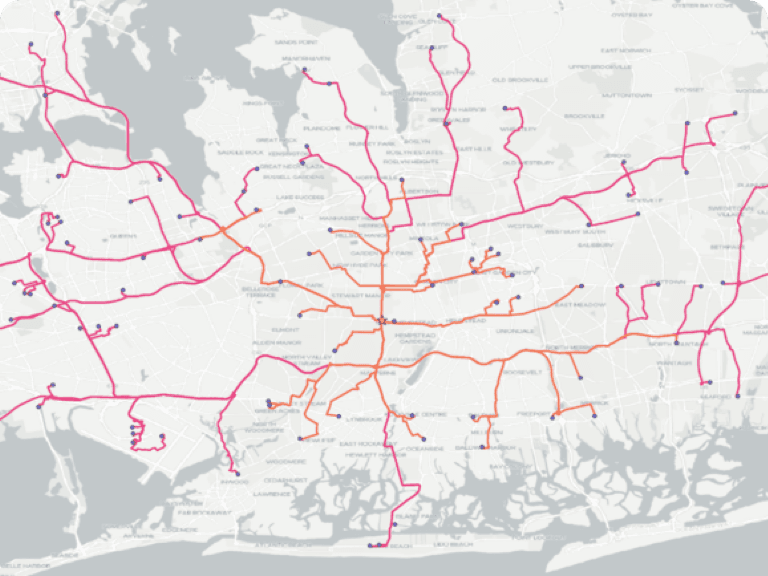
Returns the door to door directions for an optimal route.
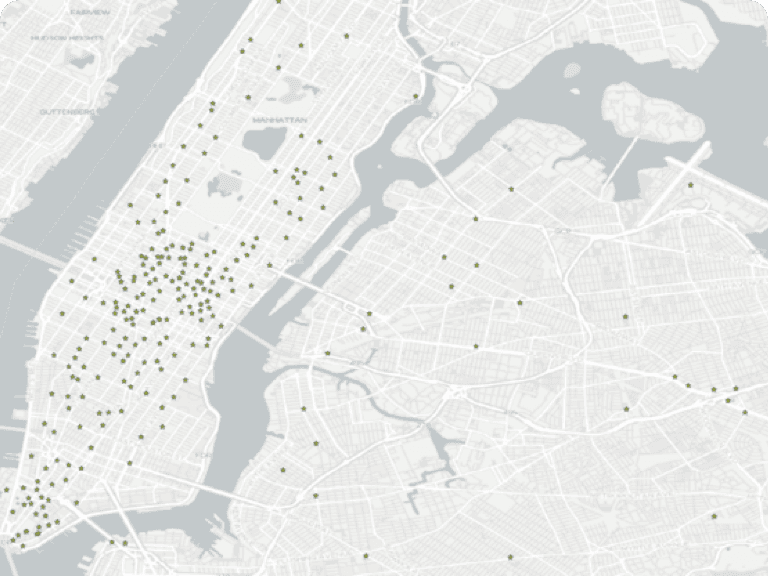
Translate addresses into coordinates or vice versa.
Installation
Requirements.
This plugin works on QGIS version 3.0 or higher.
The plugin can be installed using the QGIS plugin manager. Choose Manage and install plugins from the Plugin menu .
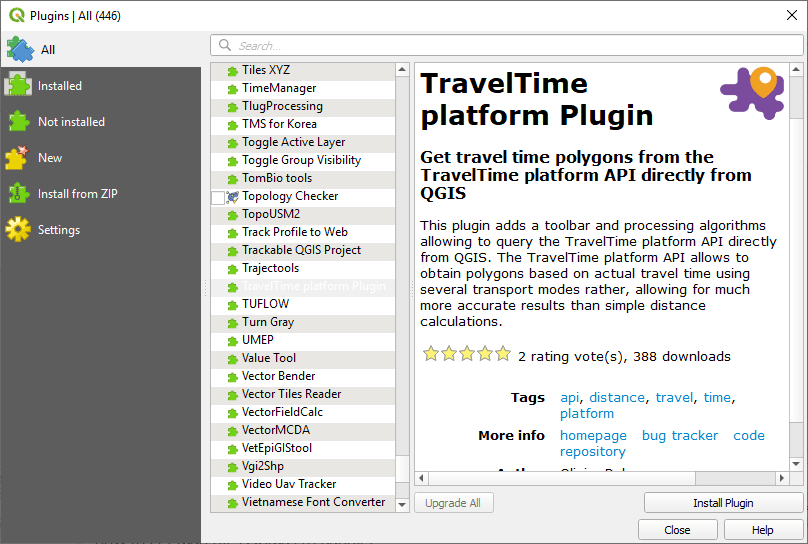
In the plugin manager window, make sure you are on the All tab, and search for TravelTime . The plugin will appear in the list. Select it in the list, and click on install .
Upgrade and uninstall
If an update is available, you will get notified from the main QGIS window. The plugin can be upgraded or uninstalled from the plugin manager window.
User interface
Splash screen.
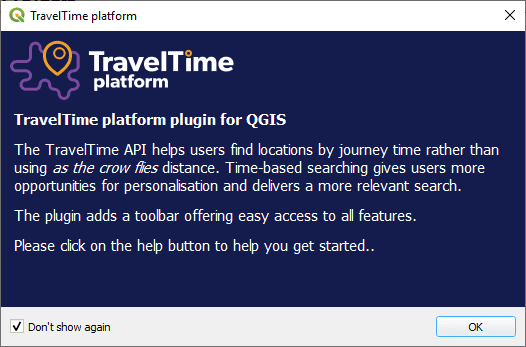
After installation and on QGIS start, the plugin will show a splash screen. You can prevent it from showing again by checking the don't show again checkbox.
Move, show or hide
By default, the toolbar appears at the top of the window. You can drag and drop it to move it elsewhere, or completely toggle its visibility by right-clicking on an empty space of the user interface and by (un)checking “TravelTime toolbar”.

The same actions are also available from the plugin menu .
At some point, you will hit the API limit, which will cause some queries to fail.
An API limit error when running a map tool
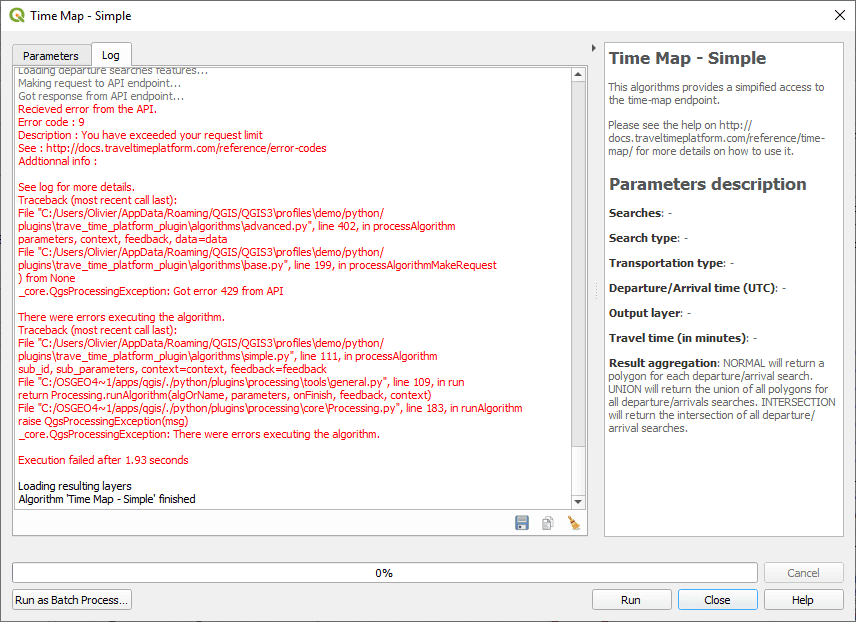
An API limit error when running an algorithm
Each API key has a quota of queries that can be done. Currently, for free keys, this is around 10 searches / minute. Once this quota is reached, all subsequent queries fail for the cooldown period.
All successful queries are saved in a cache file on your computer. This means that after the cooldown period, you can rerun your algorithm, and it will only make calls to the API for the new queries, so that you can finish running your algorithm event if it failed before.
Rerun algorithm
Re-opens the algorithm dialog with the same settings. To use this tool, you need to select a layer that was created from one of the algorithms in the legend.
This feature is very useful to tweak your queries without having to reset all parameters manually.
Quick Time Map
This runs the quick time map tool. In the background, the advanced time map algorithm will be run. This algorithm returns a polygon layer representing the area that can be reached from one point, or the area from which a point can be reached.
Usage : click the action, then click somewhere on the map canvas to create a time map. A new layer will be added to the project with the time time. That layer is a “temporary layer”. If you need to save it, right click on it in the legend, and choose Make permanent .
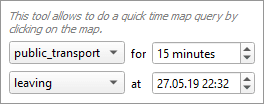
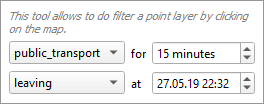
Configuration: click on the small arrow, then configure using the following widget. The time parameter uses your system local time, so you need to manually convert the time if you are working in different time zone.
Quick Time Filter
This runs the quick time filter tool . In the background, the advanced time filter algorithm will be run. This algorithm allows to filter a point layer according to a time map search.
Usage: first, select a point layer in the legend, then click the action, then click somewhere on the map canvas to create a time map. A new layer will be added to the project with the reachable and unreachable points. That layer is a “temporary layer”. If you need to save it, right click on it in the legend, and choose Make permanent .
Quick Route
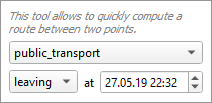
This runs the quick route tool. In the background, the advanced route algorithm will be run. This algorithm allows to compute the best route between points.
Usage: click the action, then click somewhere on the map canvas to define the starting point, and click again to define the destination point. A new layer will be added to the project containing the route. That layer is a “temporary layer”. If you need to save it, right click on it in the legend, and choose Make permanent .
This runs the geoclick tool.
Usage : with any map tool enabled, enter an address in the input field next to the button, then click on the button. This will simulate a mouse click on the map at the address that you entered. It can be used with any map tool, including the quick tools.
In the background, the geocoding algorithm will be run.
Settings dialog
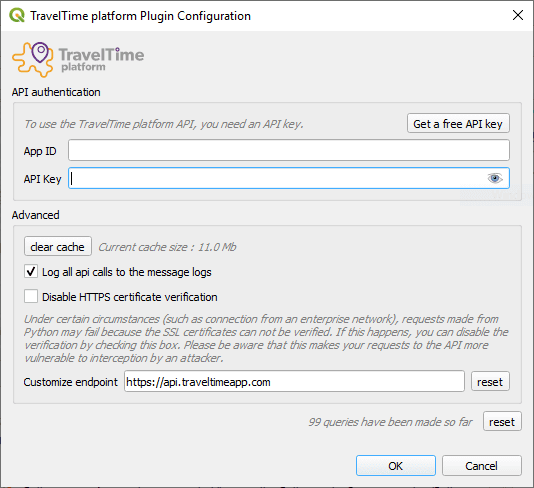
App ID and API Key : enter your App ID and API Key here. You need to do this step to be able to use the TravelTime web service. You can get the ID and the Key by email by clicking on the Get a free API key button and filling out the web form.
Clear cache : this button allows to clear the request cache. All requests are saved to a cache file, to avoid the need of hitting the API if an identical request was already made. By clearing the cache, all saved queries will be deleted. This shouldn’t be necessary unless you have a very high usage of the application and the cache file gets too big.
Log API calls to the message logs : this settings makes the plugin log all requests and responses to the QGIS Message Log, allowing to inspect what’s happening in case you encounter errors.
Disable HTTPS certificate verification : under certain circumstances (such as connection from an enterprise network), requests made from Python may fail because the SSL certificates can not be verified. If this happens, you can disable the verification by checking this box. Please be aware that this makes your requests to the API more vulnerable to interception by an attacker.
Customize endpoint : if you are not using the default TravelTime API endpoint, you can customize it here.
Help dialog
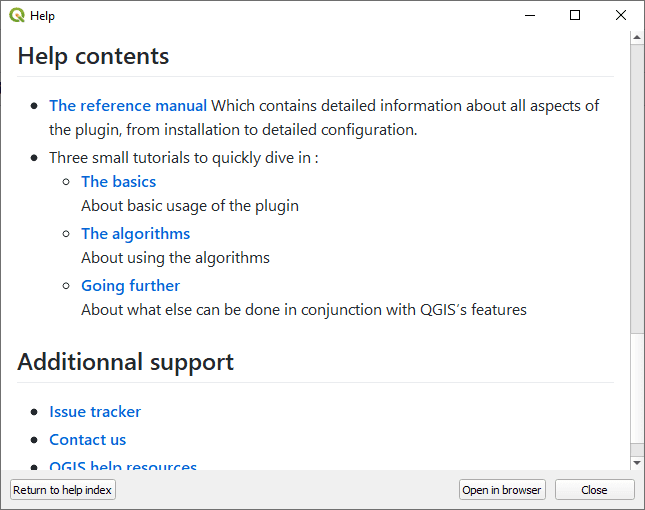
This dialog shows the online help directly in QGIS.
Return to help index : returns to the home page of the online help in case you got lost.
Open in browser : opens your browser at the same page, which may be more comfortable to browse the documentation.
Background tiles
Depending on your API key capabilities, it will automatically add additional XYZ layers that you can use as background.
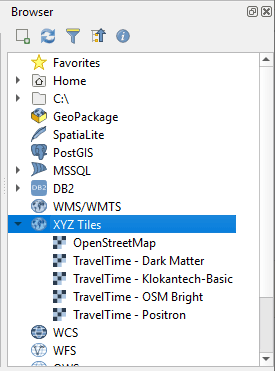
If your API key doesn’t provide this capability, you will get a message providing instructions on how to get access to those tiles.
In any case, you’ll be able to add the default XYZ layer configured by default by QGIS.
Algorithm toolbox
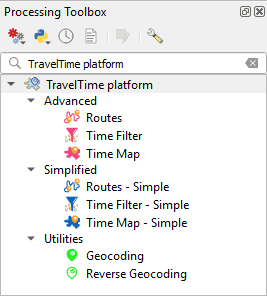
Similarly to all other QGIS algorithms, all those algorithms can be run normally by double-clicking them or in batch mode by right-clicking them.
Algorithms regrouped under the Simple group provide simplified access to the advanced algorithms, but just call the advanced algorithms in the background. They cover most use cases and it is recommended to start with those before using the Advanced ones.
Algorithms regrouped under the Advanced group provide access to the API endpoints. Since they have a lot of options, they are only recommended for advanced users that require to fine tune parameters that are not configurable in the simplified versions.
Algorithms regrouped under the Utilities group provide access to the Geocoding (assigning a point to a textual address) or Reverse geocoding (assigning a textual address to a point). algorithms.
Unfortunately, it may happen that you encounter some issues. This section may help address some of the most common issues.
Common issues
Running the algorithms from the toolbox fail.
Have a close look at the first few lines in red of the output, and see if you some corresponding help here.

Could not connect to the API
This means that the plugin could not connect to the webservice. Make sure you are online and that your connection works properly. If the error persists, please contact us as it may be due to some issue with the web service.
You need a TravelTime API key to make requests
Before using the TravelTime plugin, you need to get and configure an API key. Please refer to the configuration dialog section about how to get and configure an API key.
You have exceeded your request limit
This means the algorithm got stopped because you reached you API quote. Please refer to the API limit section that explains the issue in more details.
Application Id or API Key is invalid
The application ID or the API key configured in the settings is invalid. Make sure you copied it correctly. If the error persist, please contact us .
Could not connect to the API because of an SSL certificate error
This means that the plugin is not able to create a connection with the TravelTime web service. Please refer to the configuration dialog section about how to disable SSL certificate checking.
Report on Github
If you encounter another issue that is not described above, please report it on the issue tracker .
Include as much information as possible, such as what steps exactly triggered the issue, the error message or unexpected behaviour, a copy of the message log ( view > panels > Log messages under the TravelTime tab).
By doing so, we’ll be able to fix the issue and you will be notified.
For anything else, including to request higher API limit, please visit https://www.traveltime.com/contact-us
- About plugins
- QGIS Layer Definition File
- New Plugins
- Updated Plugins
- Experimental
- Top downloads
- QGIS Server plugins
Plugin Tags
Qgis python plugins repository, download latest, traveltime plugin.
Get travel time polygons from the TravelTime API directly from QGIS
This plugin adds a toolbar and processing algorithms allowing to query the TravelTime platform API directly from QGIS. The TravelTime platform API allows to obtain polygons based on actual travel time using several transport modes rather, allowing for much more accurate results than simple distance calculations.
Sustaining Members

Gold Sponsor

Silver Sponsors

- Introduction
- Making a Map (QGIS3)
- Working with Attributes (QGIS3)
- Importing Spreadsheets or CSV files (QGIS3)
- Basic Vector Styling (QGIS3)
- Calculating Line Lengths and Statistics (QGIS3)
- Basic Raster Styling and Analysis (QGIS3)
- Raster Mosaicing and Clipping (QGIS3)
- Working with Terrain Data (QGIS3)
- Working with WMS Data (QGIS3)
- Working with Projections (QGIS3)
- Georeferencing Topo Sheets and Scanned Maps (QGIS3)
- Georeferencing Aerial Imagery (QGIS3)
- Digitizing Map Data (QGIS3)
- Performing Table Joins (QGIS3)
- Performing Spatial Joins (QGIS3)
- Performing Spatial Queries (QGIS3)
- Nearest Neighbor Analysis (QGIS3)
- Sampling Raster Data using Points or Polygons (QGIS3)
- Calculating Raster Area (QGIS3)
- Creating Heatmaps (QGIS3)
- Animating Time Series Data (QGIS3)
- Handling Invalid Geometries (QGIS3)
- Advanced Raster Analysis (QGIS3)
- Interpolating Point Data (QGIS3)
- Batch Processing using Processing Framework (QGIS3)
- Automating Complex Workflows using Processing Modeler (QGIS3)
- Automating Map Creation with Print Layout Atlas (QGIS3)
- Multi Criteria Overlay Analysis (QGIS3)
- Basic Filtering and Styling with Expressions (QGIS3)
- Creating a Block World Map (QGIS3)
- Styling a River Network with Expressions (QGIS3)
- Basic Network Visualization and Routing (QGIS3)
- Locating Nearest Facility with Origin-Destination Matrix (QGIS3)
- Service Area Analysis using Openrouteservice (QGIS3)
- Travel Time Analysis with Uber Movement (QGIS3)
- Calculating Areal Mean Rainfall (QGIS3)
- Creating a Colorized River Basin Map (QGIS3)
- Creating a Landuse Map (QGIS3)
- Calculating Street Intersection Density (QGIS3)
- Determining Landuse Buffer Zones (QGIS3)
- Mapping Waste Disposal Volumes (QGIS3)
- Getting Started With Python Programming (QGIS3)
- Running Processing Algorithms via Python (QGIS3)
- Using Custom Python Expression Functions (QGIS3)
- Writing Python Scripts for Processing Framework (QGIS3)
- Building a Python Plugin (QGIS3)
- Building a Processing Plugin (QGIS3)
- Running and Scheduling QGIS Processing Jobs
- Web Mapping with QGIS2Web (QGIS3)
- Creating Basemaps with QTiles
- Using Plugins (QGIS3)
- Searching and Downloading OpenStreetMap Data
- QGIS Learning Resources
- Data Credits
- Batch Processing using Processing Framework (QGIS2)
- « Service Area ...
- Calculating A... »
Ujaval Gandhi
Want to learn QGIS in a structured way? Check out Spatial Thoughts for more learning materials and instructor-led online programs with QGIS.org certification.
These tutorials are also available in many other languages. Please see translations page.
Travel Time Analysis with Uber Movement (QGIS3) 
Uber Movement data has been discontinued [ view announcement ]. You can still follow the tutorial using the archive data provided in the tutorial and learn the technique of travel time analysis using QGIS.
Uber Movement shares anonymized and aggregated travel time data for many cities across the world. Uber Movement’s Travel Times product is a public dataset measuring zone-to-zone travel across a city. These times are based on actual Uber rides and is an accurate representation of congestion and traffic patterns in the city. This is a large openly accessible dataset aggregated from millions of actual cab rides. This tutorial shows the techniques to work use such aggregated traffic datasets for doing travel time analysis in QGIS.
Overview of the task 
We will use an aggregated traffic dataset for the city of Bangalore, India to find travel times to a chosen location in the city. We will also create an Isochrone Map for a 30-min travel time threshold.
Other skills you will learn 
Load a GeoJSON file in QGIS
Get the data 
We will download the Travel Times dataset for the city of Bangalore, India.
Go to the Uber Movement site and click on the Cities .
Search for Banglore .
Click on Download data .
In the Download data popup, switch to GEO BOUNDARIES . It will contain the Banglore wards GeoJSON file. Accept the license information and click on BANGLORE_WARDS.JSON to download.
Then switch to ALL DATA . This data is available from 2016 to 2020, and each year is divided into 4 quarters. We will download the data for 2019 Quarter 3 . Select it and click the Travel Times by Hour of Day (Weekdays Only) . This file will contain all anonymous information about the weekday uber travel in Bangalore from July to September 2019.
For your convenience, you can download the data from the links below.
bangalore_wards.json
bangalore-wards-2019-3-OnlyWeekdays-HourlyAggregate.csv
Data Source: [UBER]
Procedure 
Locate the bangalore_wards.json file in the Browser panel and drag it to the canvas. Next, we will load a basemap layer from OpenStreetMap. We will use the QuickMapServices plugin to access the basemap. Once installed, go to Web ‣ QuickMapServices ‣ OSM ‣ OSM Standard . A basemap tile layer from OpenStreetMap will be added to the project. Next, click the Open Data Source Manager button.
Switch to the Delimited Text tab. Browse to the bangalore-wards-2019-3-OnlyWeekdays-HourlyAggregate.csv file and select it. Since this CSV file is just tabular data, select No geometry (attribute only table) option and click Add .
The bangalore-wards-2019-3-OnlyWeekdays-HourlyAggregate layer will be added to the Layers panel. This layer contains anonymized and aggregated trip location data between different zones of the city. Each row of the table contains columns for source zone ( sourceid ), destination zone ( dstid ), hour of the day ( hod ) and average travel time aggregated from all trips between these zone at that hour ( mean_travel_time ). You can learn more about this dataset in the Movement: Travel Times Calculation Methodology (pdf) . Before moving forward, let’s check how many data records are present in the layer. Right-click the bangalore-wards-2019-3-OnlyWeekdays-HourlyAggregate layer and select Show Feature Count . The total rows from the table will be displayed next to it. This is a fairly large table but we don’t need all the data rows for our analysis. We will now identify our target location and filter this table to data records for it.
We want to calculate all areas that are accessible within 30 minutes from a specific location. Using the OSM Standard basemap, you can find the location of interest. Then select the bangalore_wards layer, use the Identify tool and click on it. The results will show the attributes of the zone containing the location. For the purpose of this tutorial, let’s assume our target location is within the JP Nagar zone with the MOVEMENT_ID 193 .
We can filter the travel time records to just those which have this zone as the destination. We can also restrict our analysis to the peak morning commute hour of 9am - 10am. Right-click the bangalore-wards-2019-3-OnlyWeekdays-HourlyAggregate layer and select Filter .
Enter the following filter expression and click OK .
"dstid" = 193 AND "hod" = 9
Back in the main QGIS window, you will see that the number of records in the filtered table are now down to just 197 . Since there are a total of 198 zones in the city, we have records of travel times between the 1 destination ward and 197 source zones. Open the attribute table of both the layers using the Open Attribute Table button in the Attributes toolbar.
Now we have the shapes of the ward in the layer bangalore_wards and tabular information in the layer bangalore-wards-2019-3-OnlyWeekdays-HourlyAggregate . We can join the attribute information to the shapes using a common attribute. Here the MOVEMENT_ID column from the bangalore_wards layer and sourceid column from the bangalore-wards-2019-3-OnlyWeekdays-HourlyAggregate are unique ward identifiers that can be joined. This operation is called a Table Join .
Before we can join these two layers, we must ensure that the values in both columns match exactly. Thought they appear the same, they are of different type. Since GeoJSON format has no way of specifying property types, all values are assumed to be of the type String - i.e. Text. But when we import a CSV to QGIS, by default, QGIS tries to determines the types of the columns based on the values and assign appropriate field type. For the CSV file, the data type for the column sourceid was assigned as Integer . So we need to convert the column from the GeoJSON to an Integer type as well. Go to Processing ‣ Toolbox ‣ Vector Table ‣ Field Calculator algorithm . Double-click to launch it.
Choose bangalore_wards as the Input Layer . Name the Field Name as joinfield and select the Result field type as Integer . Enter MOVEMENT_ID as the Expression. Click the … button next to the Calculated and select Save to File… then enter the name of the output file as bangalore_wards_fixed.gpkg . Click Run . Close the field calculator.
A new layer bangalore_wards_fixed will be added to the Layers panel. Now we are ready to perform the join. Go to Processing ‣ Toolbox ‣ Vector General ‣ Join attributes by field value . Double-click to launch it.
Select bangalore_wards_fixed as the Input layer and joinfield as the Table field . Select bangalore-wards-2019-3-OnlyWeekdays-HourlyAggregate as the Input layer 2 and sourceid as the Table field 2 . Name the Joined layer as uber_travel_times.gpkg and click Run .
A new layer uber_travel_times will be added to the Layers panel. Let’s style it to visualize the result of the join. Click Open the Layer Styling Panel . Select the Graduated renderer and mean_travel_time as the Value . Select a color ramp and click Classify . You will see the map showing increasing travel times further you go from the destination.
But we are looking to analyze and extract areas that are within 30 minutes of travel time, so we need to do some more processing. Switch the styling back to the Single symbol renderer. Right-click the uber_travel_times layer and select Filter .
Enter the following expression to select all zones within 1800 seconds (30 minutes) of mean travel time. We also need to include our destination zone which will have 0 travel time.
"mean_travel_time" <= 1800 OR "MOVEMENT_ID" = 193
The layer will now show the cluster of polygons that constitute the area of interest. We will merge all of them to a single polygon now. Go to Processing ‣ Toolbox ‣ Vector Geometry ‣ Dissolve . Double-click to launch it.
Select uber_travel_times as the Input layer . Name the Dissolved layer as 30min_isochrone.gpkg . Click Run .
A new layer 30min_isochrone will be added to the Layers panel showing the result of our analysis.
If you want to give feedback or share your experience with this tutorial, please comment below. (requires GitHub account)
This work is licensed under a Creative Commons Attribution 4.0 International License

QGIS Tutorials

IMAGES
VIDEO
COMMENTS
To get a sense of what the plugin can do, we'll start with the express tools. We'll quickly setup a project to try it out. 1. Create a new QGIS project. Menu > File > New project. 2. Add a background layer. To help us navigate the map and actually understand what we look at, we'll add a background layer.
The plugin can be installed using the QGIS plugin manager. Choose Manage and install plugins from the Plugin menu. In the plugin manager window, make sure you are on the All tab, and search for TravelTime. The plugin will appear in the list. Select it in the list, and click on install.
Try the TravelTime QGIS plugin for free: https://bit.ly/3keTPYsWith the TravelTime QGIS plugin you can: Create isochrones (travel time maps) Calculate trav...
Try the TravelTime QGIS plugin for free: https://bit.ly/3keTPYsWith the TravelTime QGIS plugin you can: Create isochrones (travel time maps) Calculate trav...
Tutorial on how to use the advanced tools for creating isochrones, travel time matrices, and routes in QGIS. Updated over a week ago. Each of the three core tools in the TravelTime plugin for QGIS comes in an Advanced form: Routes Advanced - create A to B routes with turn-by-turn directions.
About. Details. Versions. This plugin adds a toolbar and processing algorithms allowing to query the TravelTime platform API directly from QGIS. The TravelTime platform API allows to obtain polygons based on actual travel time using several transport modes rather, allowing for much more accurate results than simple distance calculations.
In this tutorial, we explain how to install QGIS, how to install the TravelTime platform plugin, how to get an API key and how to do basic functions using th...
Installing the TravelTime plugin in QGIS. Click on the Settings icon, and enter your API key details. If you don't already have a TravelTime API key, you can get a free key for testing below: Get a free API key. Click on the Show the Toolbox icon to add the TravelTime toolbox into the Processing Toolbox. You're now ready to start using the ...
This tutorial shows the techniques to work use such aggregated traffic datasets for doing travel time analysis in QGIS. Overview of the task¶ We will use an aggregated traffic dataset for the city of Bangalore, India to find travel times to a chosen location in the city. We will also create an Isochrone Map for a 30-min travel time threshold.
Travel time calculator QGIS. Ask Question Asked 8 years, 7 months ago. Modified 2 years, 11 months ago. Viewed 10k times 5 I will try explain this as best I can. I have a point on a map and I want to create buffers surrounding the site; for example, 10Km, 20Km 50Km. This is easy. But I also need to show buffers for distance from site, based on ...
Try the TravelTime QGIS plugin for free: https://bit.ly/3keTPYsWith the TravelTime QGIS plugin you can: Create isochrones (travel time maps) Calculate trav...
How to create a travel time matrix in QGIS. How to create isochrones in QGIS. How to create A to B routes in QGIS. How to geocode addresses in QGIS. How to use the advanced tools in QGIS. How to run batch analysis in QGIS. How to do a population catchment analysis in QGIS. QGIS troubleshooting guide.
ops.fhwa.dot.gov
Try the TravelTime QGIS plugin for free: https://bit.ly/3keTPYsWith the TravelTime QGIS plugin you can: Create isochrones (travel time maps) Calculate trav...