How to Open Safari Developer Tools & Enable Mobile View Mode

John on May 12, 2021

In this tutorial, we will learn how to open the Safari developer console and enable mobile view for responsive web development.

How to Enable Safari Developer Tools
If you don't have developer tools enabled in Safari, you will need to do this before the console can be opened by using the following steps:
- From the main menu go to Safari > Preferences (or use the CMD + , keyboard shortcut.)
- Go to the Advanced tab.
- Check "Show Developer menu in menu bar"
Open the Safari Developer Console
Now open the developer console in responsive mode by going to the menu and selecting Develop > Enter Responsive Design Mode :
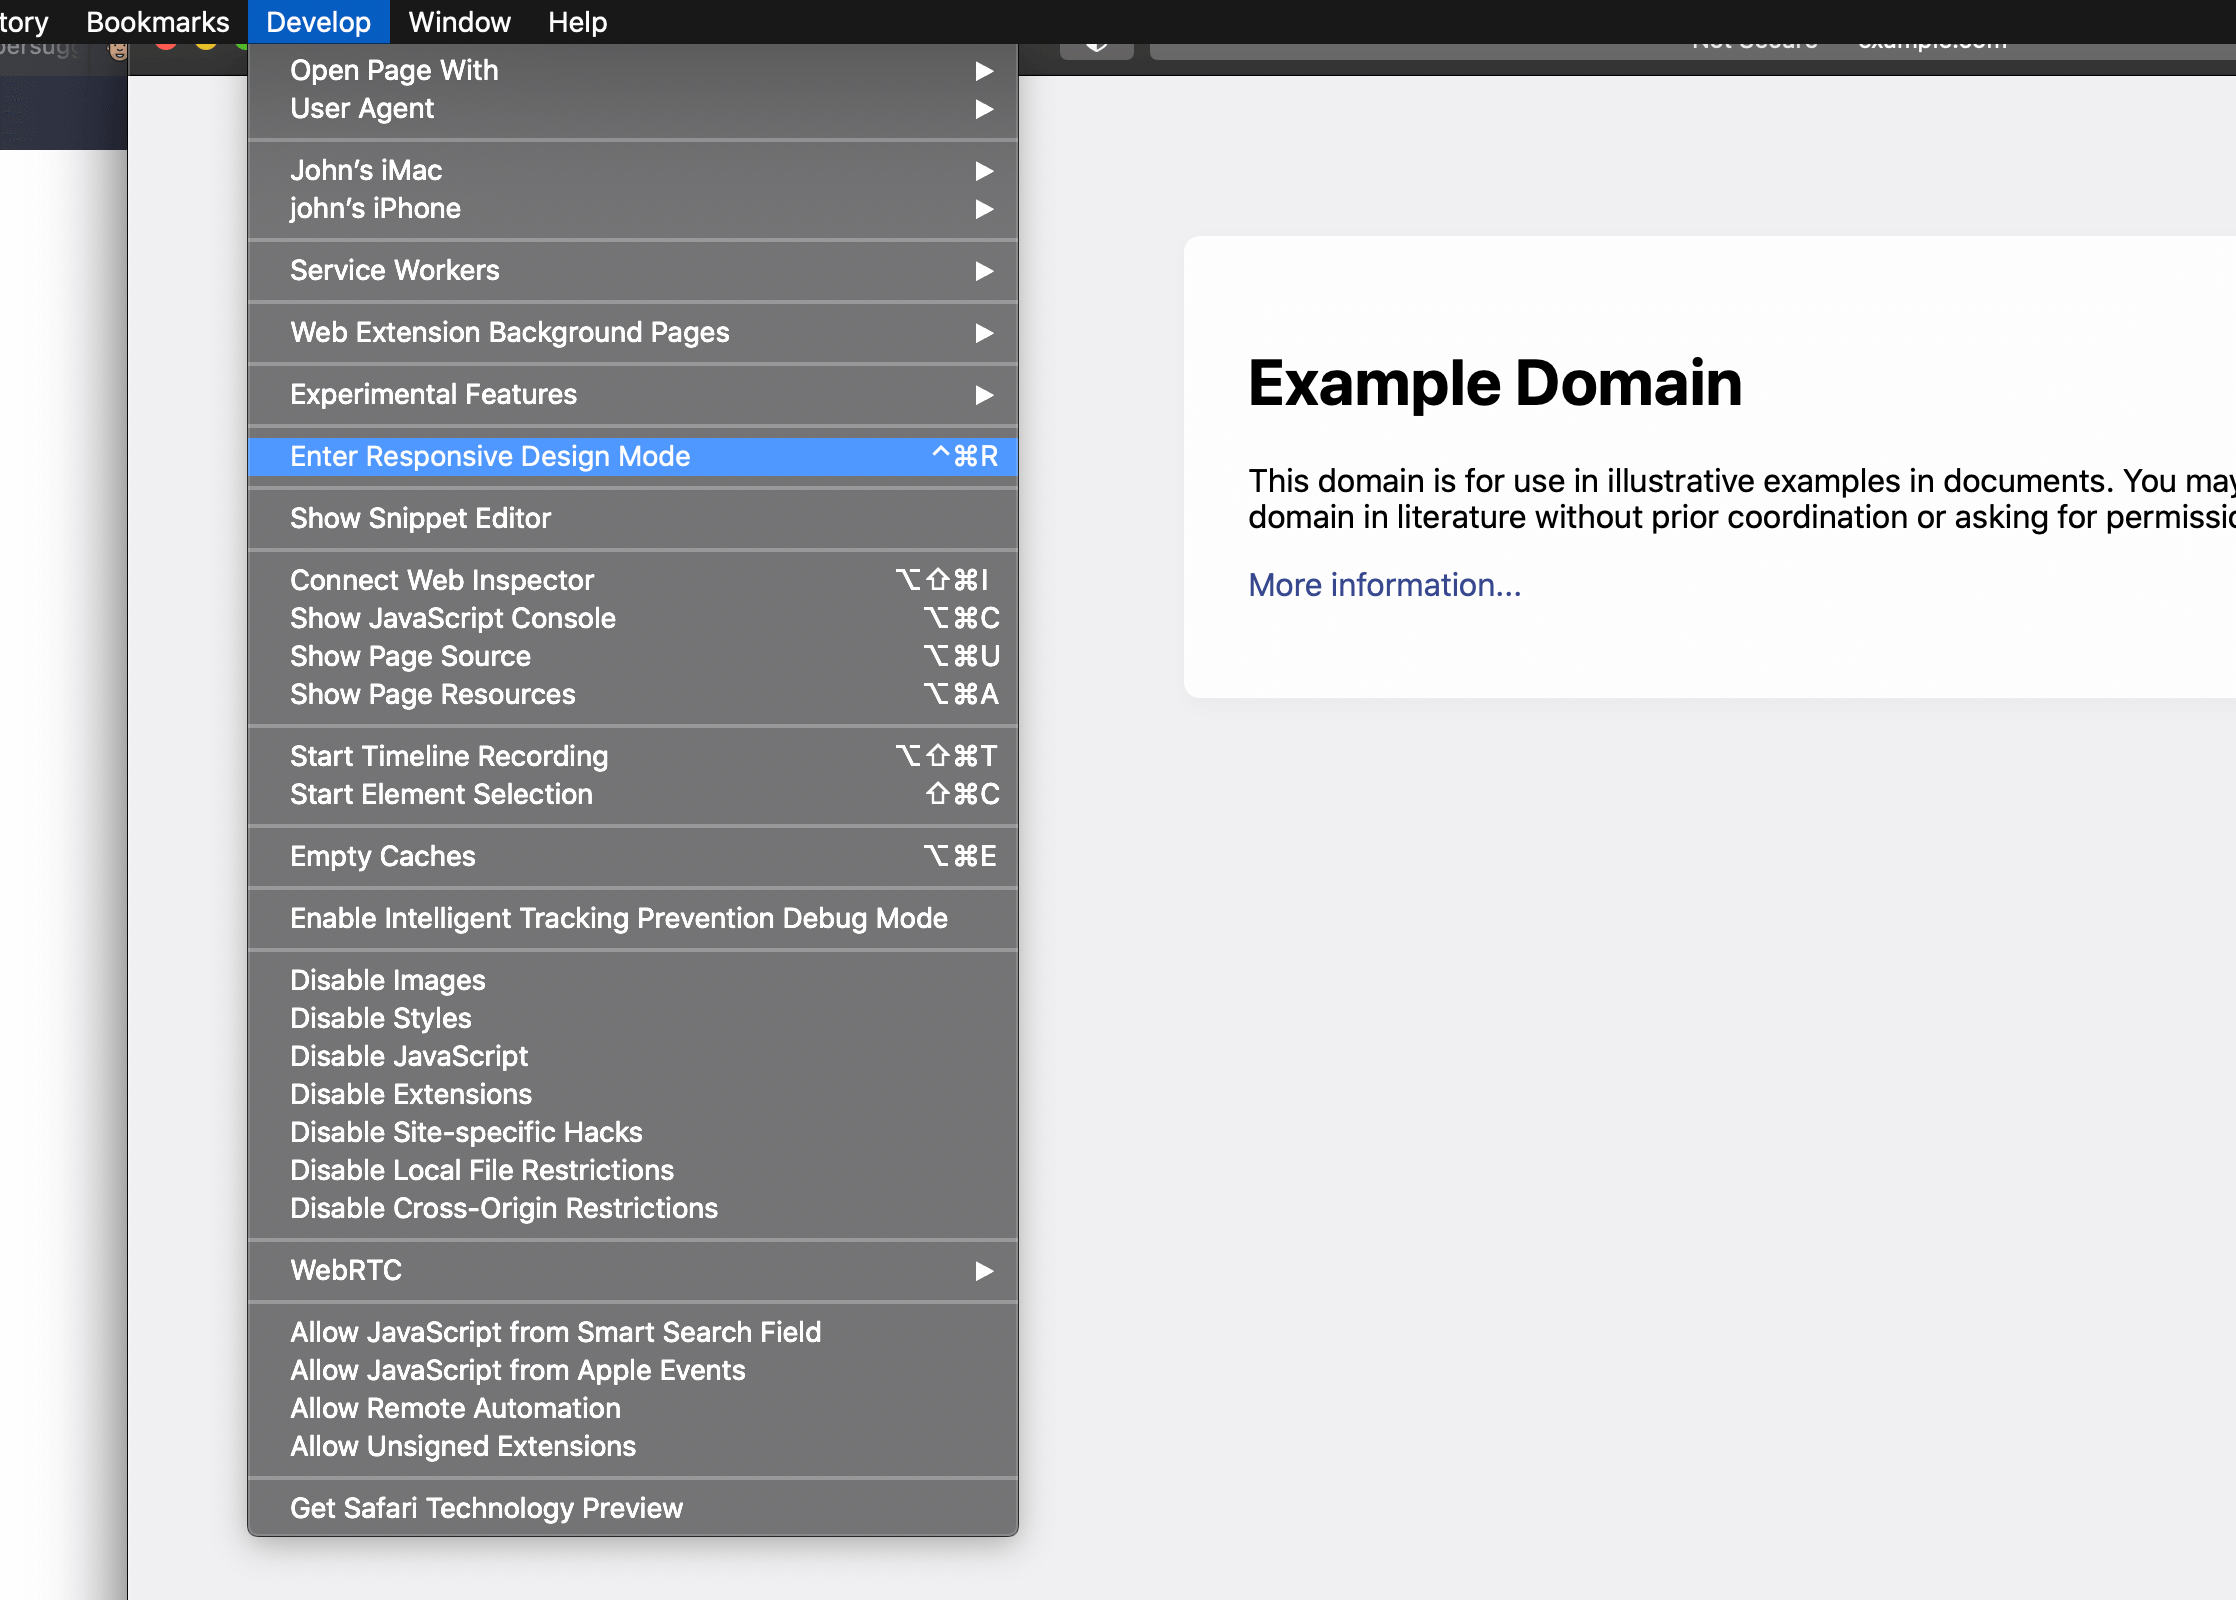
Alternatively, use the keyboard shortcut CTRL + CMD + R to enter responsive developer mode.
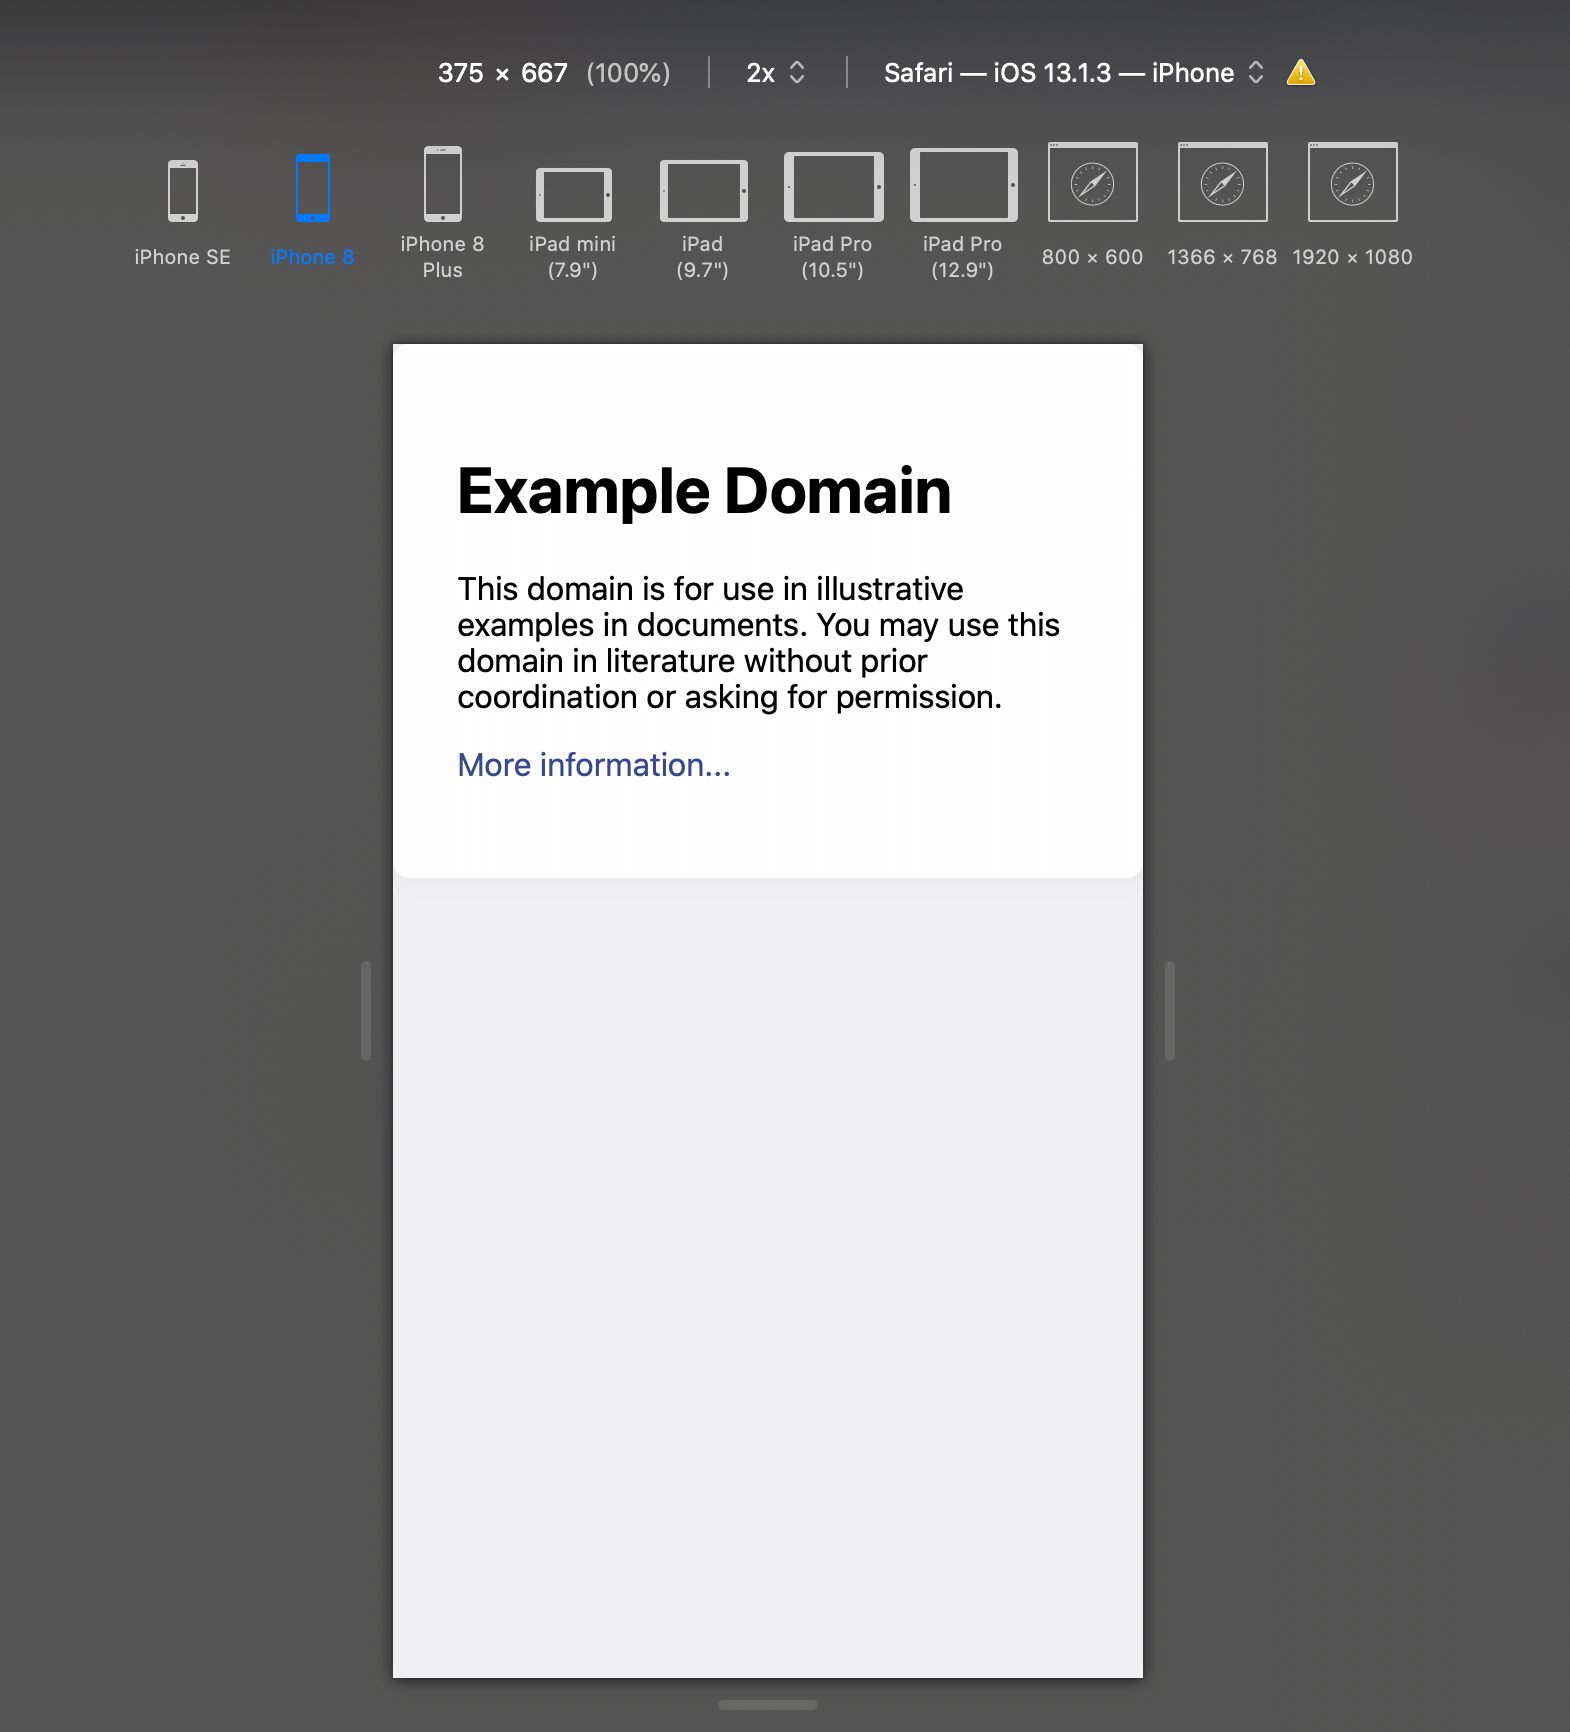
Now you can work on your website in a variety of different mobile device screen sizes by selecting them at the top of the page:
Related Tutorials

How to Stop DDOS Attacks & Prevent Future Downtime
-1589655824.jpg)
How to Enable Night Light Mode on Windows 10

How to View Desktop Site on iPhone with Safari

How to Use Grep Command to Search Files in Linux

How to Find Words on a Page using Safari on iPhone
How to Clear & Save Disk Storage Space on a Mac
Safari User Guide
- Change your homepage
- Import bookmarks, history, and passwords
- Make Safari your default web browser
- Go to websites
- Find what you’re looking for
- Bookmark webpages that you want to revisit
- See your favorite websites
- Use tabs for webpages
- Pin frequently visited websites
- Play web videos
- Mute audio in tabs
- Pay with Apple Pay
- Autofill credit card info
- Autofill contact info
- Keep a Reading List
- Hide ads when reading articles
- Translate a webpage
- Download items from the web
- Share or post webpages
- Add passes to Wallet
- Save part or all of a webpage
- Print or create a PDF of a webpage
- Customize a start page
- Customize the Safari window
- Customize settings per website
- Zoom in on webpages
- Get extensions
- Manage cookies and website data
- Block pop-ups
- Clear your browsing history
- Browse privately
- Autofill user name and password info
- Prevent cross-site tracking
- View a Privacy Report
- Change Safari preferences
- Keyboard and other shortcuts
- Troubleshooting
Use the developer tools in the Develop menu in Safari on Mac
If you’re a web developer, the Safari Develop menu provides tools you can use to make sure your website works well with all standards-based web browsers.
If you don’t see the Develop menu in the menu bar, choose Safari > Preferences, click Advanced, then select “Show Develop menu in menu bar.”
Open Safari for me
- Tech Gift Ideas for Mom
- Hot Tech Deals at Target Right Now
How to Activate the iPhone Debug Console or Web Inspector
Use Safari's web developer tools to study problematic websites
:max_bytes(150000):strip_icc():format(webp)/ScottOrgera-f7aca23cc84a4ea9a3f9e2ebd93bd690.jpg)
- Saint Mary-of-the-Woods College
- Switching from Android
What to Know
- Activate Web Inspector on iOS: Go to Settings > Safari > Advanced and move the Web Inspector toggle switch to the On position.
- Use Web Inspector on macOS: Connect your iOS device to a Mac and choose the URL to inspect from the Develop menu.
If you run into a bug or another issue with a website on Safari mobile, use the Web Inspector tool to investigate. This article explains how to use the Safari console for iPhone to debug errors with the help of your Mac computer. Instructions apply to iPhones with iOS 14, iOS 12, or iOS 11, and well as Macs with macOS Big Sur (11.0), macOS Catalina (10.15), or macOS Mojave (10.14).
Activate Web Inspector on Your iPhone or Other iOS Device
The Web Inspector is disabled by default since most iPhone users have no use for it. However, if you're a developer or you're curious, you can activate it in a few short steps. Here's how:
Open the iPhone Settings menu.
On an iPhone with an early version of iOS, access the Debug Console through Settings > Safari > Developer > Debug Console . When Safari on the iPhone detects CSS, HTML, and JavaScript errors, details of each display in the debugger.
Scroll down and tap Safari to open the screen that contains everything related to the Safari web browser on your iPhone, iPad, or iPod touch.
Scroll to the bottom of the page and select Advanced .
Move the Web Inspector toggle switch to the On position.
Connect Your iOS Device to Safari on a Mac
To use the Web Inspector, connect your iPhone or another iOS device to a Mac that has the Safari web browser and enable the Develop menu .
With Safari open, select Safari from the menu bar and choose Preferences .
Select the Advanced tab.
Select the Show Develop menu in menu bar check box and close the settings window.
From the Safari menu bar, select Develop and choose the name of your attached iOS device, then select the URL that appears under Safari to open the debug console for that site.
After you connect your device, use your Mac to inspect the website you want to debug and have it open in the Safari mobile browser.
What Is Web Inspector?
Web developers use Web Inspector to modify, debug, and optimize websites on Macs and iOS devices. With Web Inspector open, developers can inspect the resources on a web page. The Web Inspector window contains editable HTML and notes regarding the styles and layers of the web page in a separate panel.
Before iOS 6, the iPhone Safari web browser had a built-in Debug Console that developers used to find web page defects. Recent versions of iOS use Web Inspector instead.
With Safari 9 and OS X Mavericks (10.9), Apple introduced Responsive Design Mode in Web Inspector. Developers use this built-in simulator to preview how web pages scale to different screen sizes, resolutions, and orientations.
To set up Web Inspector on your iPad, open your iPad's Settings and select Safari > Advanced , then turn Web Inspector On . Connect the iPad to a Mac computer, then open Safari on the Mac and select Safari > Preferences > Advanced , then turn on Show Develop menu in menu bar .
You cannot just connect your iPhone to a Windows PC and start using Web Inspector through Chrome like you can with a Mac. Installing package manager software can provide you a sort of workaround, but it's not recommended unless you're familiar with the package management app you intend to use.
Get the Latest Tech News Delivered Every Day
- Add More Features by Turning on Safari's Develop Menu
- How to Use Web Browser Developer Tools
- How to Activate and Use Responsive Design Mode in Safari
- How to Clear Search History on iPhone
- What Is Safari?
- How to Inspect an Element on a Mac
- 4 Ways to Play Fortnite on iPhone
- How to Disable JavaScript in Safari for iPhone
- 10 Hidden Features in macOS Sonoma
- How to Manage History and Browsing Data on iPhone
- How to View HTML Source in Safari
- How to Manage Cookies in the Safari Browser
- How to Change Your Homepage in Safari
- How to Clear Private Data, Caches, and Cookies on Mac
- How to Reset Safari to Default Settings
- How to Manage Your Browsing History in Safari
Stack Exchange Network
Stack Exchange network consists of 183 Q&A communities including Stack Overflow , the largest, most trusted online community for developers to learn, share their knowledge, and build their careers.
Q&A for work
Connect and share knowledge within a single location that is structured and easy to search.
How can I quickly open a mobile view of a page in a desktop browser?
Since we're now in a mobile-first world, it becomes more and more important to be able to test websites easily on mobile phones, or on emulated mobile phones. I collaborate with people who work on websites and social media offerings, and I would like to encourage them to regularly open websites from their desktop browsers in a mobile view. I'm specifically thinking of the browser's built-in "mobile view" feature, which is often hidden among all the other developer tools a browser provides, but I'm happy to consider anything which is just as quick to set up.
How can you open a mobile view of a website from a desktop browser?
- 23 "Since we're now in a mobile-first world" Woah there a minute... context is for kings. – Lightness Races in Orbit Feb 6, 2018 at 12:49
- 3 Just a comment - don't know the context really, but if I was asked to be opening webpages from my desktop/laptop in mobile view first ....what's the point of using the desktop? I hope by "encourage", you're not forcing it via some code or other method. Especially since many webpages that do format for mobile are pared down quite a bit and don't have full functionality. – BruceWayne Feb 6, 2018 at 16:27
- 1 Add a change user agent or similar extension or plug in to your browser, and set a smart phone user agent. – Salman A Feb 6, 2018 at 17:10
- 1 “I would like to encourage people to regularly open websites from their desktop browsers in a mobile view.” ...That's goofy. And waste all that desktop screen real estate? Desktop and mobile both have their place, and that's why responsive solutions have been developed. Let's deliver the best experience possible for every user, and let people browse on the device that's most comfortable for them. Anyway, valid question, as web designers and developers need to emulate multiple devices when building sites. – Mentalist Feb 7, 2018 at 2:52
- 2 @Mentalist I meant people who are working on websites and social media offerings. – Flimm Feb 7, 2018 at 7:28
6 Answers 6
- In Windows/Linux, press Ctrl + Shift + M
- In macOS, press option + command + M
You can also find the menu item under ("Tools"), "Web Developer", "Responsive Design Mode".
Chrome and Edge:
You need to have "Developer Tools" open first:
- In Windows/Linux, press Ctrl + Shift + I or just F12
- In macOS, press option + command + I
Once developer tools is open and focused, you can toggle device emulation:
- In macOS, press command + shift + M
There is a small button in the developer tools toolbar that enables device emulation, if you prefer to click a button rather than press a keyboard shortcut.
It looks like Apple have disabled by default the keyboard shortcut for entering responsive design mode. You can follow this tutorial on configuring a keyboard shortcut for it .
You can find the menu item by clicking "Develop", "Enter Responsive Design Mode". If you can't see the "Develop" menu item, you need to enable it by opening "Preferences", "Advanced", and ticking "Show Develop menu in menu bar".
- 1 Note that ctrl shift M works only if developer tools are already open – Naramsim Feb 6, 2018 at 10:29
- 3 @Naramsim Thanks. That only applies to Chrome. I've edited my answer. – Flimm Feb 6, 2018 at 11:19
- 3 For Windows/Chrome, F12 is a potentially easier way to get to Dev Tools... although if the next keystroke is going to be Ctrl-Shift-M, I suppose starting with Ctrl-Shift-I may be more logical. – sǝɯɐſ Feb 6, 2018 at 13:21
- I believe on previous versions of Safari Cmd+Shift+R would open responsive design mode. Seems to not exist on latest version unless you manually bind it – Downgoat Feb 6, 2018 at 23:52
- 1 Chrome remembers if you wanted a mobile preview, so once you've enabled it, you can toggle between mobile/desktop simply using F12 – Pieter De Bie Feb 8, 2018 at 12:26
Flimm’s answer is 100% correct. Just in case remembering the shortcuts is too much of a hassle, it’s this blue button in the Developer Tools to toggle between the web view and mobile/tablet view:
Or with Firefox:
After enabling the device toolbar, you can then choose the make and model of the device you wish to emulate from the dropdown menu.
- 1 What piece of software does the first part refer to? – Kamil Maciorowski Feb 7, 2018 at 5:22
- @KamilMaciorowski DevTools is the developer tool found in Chrome and Opera. – OptimusCrime Feb 7, 2018 at 7:46
- @KamilMaciorowski This is not a software, this is available on any of your web browser. Specifically if you're using chrome, right click on any window and click on inspect and you will see this window in your browser docked below or to the right of the browser. These are more commonly known as Dev Tools. – Shobhit Garg Feb 7, 2018 at 16:13
- @Shobbit Garg Is that the windows, which opens when I press CTRL + Shift + C? – daniel.heydebreck Feb 8, 2018 at 8:22
- @daniel.neumann Unfortunately I use mac, so I cannot test and see what happens when you press those keys. But referring to the shortcuts listed above, this window should open by pressing "ctrl + shift + I" on chrome, "ctrl + shift + M" on firefox or pressing f12 on IE/Edge. – Shobhit Garg Feb 8, 2018 at 15:04
For the purpose of testing, i use the following websites :-
- http://www.jamus.co.uk/demos/rwd-demonstrations/
- http://mattkersley.com/responsive/
Both of the above sites allow me to view my web application in multiple device widths.
You can set the user agent and window size from the command line or launch config of a shortcut.
For example:
& "C:\Program Files\Google\Chrome\Application\chrome.exe" --new-window --window-size=375,812 --user-agent="Mozilla/5.0 (Linux; Android 8.0; Pixel 2 Build/OPD3.170816.012) AppleWebKit/537.36 (KHTML, like Gecko) Chrome/87.0.4280.67 Mobile Safari/537.36" --user-data-dir=C:\workspace\tmp\chrome https://google.com
The --user-data flag is mandatory to make this work . Create a folder for it.
Add a "user agent switcher" extension in your browser and specify a mobile user agent. If the website is smart enough it will serve you mobile optimized version.
I will not recommend any specific extension. The ideal one should have presets for mobile browsers built-in and the ability to enable or disable user agent switching on per-website basis.
- 1 This is incorrect. Mobile layouts should work based on device / screen dimensions via CSS media queries, not user agent strings - it's not 2006 any more. – PiX06 Feb 7, 2018 at 13:51
- Most browsers' tool that allows a mobile view also lets you set a user-agent at the same time. – Flimm Feb 7, 2018 at 14:33
- 1 @PiX06 then no effort is necessary. Just resize the browser window! – Salman A Feb 7, 2018 at 15:04
- Unfortunately, I find myself with many questions: If I'm resizing the browser window anyway, why do I need to bother with user agents? To which dimensions should I resize the window? How do I measure the window? – Mathieu K. Feb 9, 2018 at 5:26
The above answers are great for those who like to stick with a single browser, or have limited desktop "workspace" (eg. single monitor less than 21" at a low res).
There is actually an even more interesting solution I've recently discovered: https://blisk.io/
I will refrain from using the (sort of) "affiliate link" for any personal gain (There is a "token based system" that you can earn credits to get things like free "team cloud space" & "premium features" to use with it), but Blisk is actually pretty snazzy.
This Chromium-based "browser built for development" provides a multitude of ways to demo the page in various devices with a vertical "pane" on the LEFT side, much like you see Chrome Developer Tools default to the right vertical column.
It's work a look. Though there are some limits to its "freemium extended functionality", it still works very well to "preview" both the PC and Mobile versions of your pages / sites in a side-by-side comparison. The paid features seem pretty rad too if you work in remote teams (though I personally think it need a better "test drive" program before hooking people on the monthly cost).
Full disclosure: there is an EXTREMELY annoying "time limit" per day on the mobile preview part (toggles open/closed from the icon to the right of the address bar - change the "device preview" from the tiny link-to-the-menu in the top right corner "Show device list").
BliskDemoScreenshot
Also: I've found a few really nifty tricks with Browser Extensions like the 2 different "User-Agent Switcher"'s from Chrome/Firefox that go a bit further by letting you toggle between browser user-agent strings of various Operating Systems AND the browsers for them.
I prefer the "esolutions.se" flavor because of how easy it is to add custom user-agent strings to the list for as many customizations as you could ever want (runs offline also, which can be handy in certain cases): https://chrome.google.com/webstore/detail/user-agent-switcher/clddifkhlkcojbojppdojfeeikdkgiae
Anyway, that's my 2 cents. :P
- not available for Linux :-( – david.perez Mar 3, 2020 at 14:52
You must log in to answer this question.
Not the answer you're looking for browse other questions tagged browser ..
- The Overflow Blog
- Climbing the GenAI decision tree sponsored post
- Diverting more backdoor disasters
- Featured on Meta
- New Focus Styles & Updated Styling for Button Groups
- Upcoming initiatives on Stack Overflow and across the Stack Exchange network
- Google Cloud will be Sponsoring Super User SE
Hot Network Questions
- Did Goethe say this quote praising the Prophet Muhammed?
- Professor Rackbrane: Count the triangles
- How would the existence of sapient "Pet Rocks" affect the economy of a medieval kingdom?
- Do people fix software bugs in old arcade games?
- How can I keep my brakes centered?
- Are my skin and hair colors believable?
- Callback replacement of active character
- can a manager ask me to find someone to cover shifts AFTER I quit?
- Tried to use cig lighter in my 12 volt plug now charger won’t work
- Expand a 2d curve into a 3d path curve with a fixed axis of rotation?
- Why would dragons evolve to breathe fire?
- How can we infallibly know that the Catholic Church is infallible?
- Confusion about overtones and a slow-motion video of a plucked string
- How to make Mathematica plot for a very small region?
- What were the major things that caused TCP/IP to become the internet standard protocol?
- How does the Corrosive Form (black pudding) damage work?
- Why does a goddess put a low limit on the number of priests?
- In the Wallace and Gromit movies we see 'Electronics for Dogs.' Do we ever see any other 'books for Dogs' in-universe?
- Turingmachine for decision of mathematical conjecture
- How can an evil empire build a fortress that stands for a thousand years?
- Why is remote desktop very slow when host monitor is off unless HDMI cable is used?
- What's the most common word in Latin?
- Why do most philosophers believe in a deterministic formulation of quantum mechanics?
- Is there any difference between a heavy meal and a large meal, between a light meal and a small meal?
How-To Geek
How to turn on the develop menu in safari on mac.
The Develop menu lets you view page source in Safari on Mac.
Quick Links
How to enable the develop menu in safari on mac, how to view page source in safari on mac.
When you right-click on any web page in Safari on Mac, it doesn't reveal the Show Page Source and Inspect Element buttons. To see these, you need to enable the Develop menu---we'll show you how to do that.
Once you've enabled the Develop menu, right-clicking a blank space on any website will reveal the Inspect Element and Show Page Source buttons. These allow you to take a look at the source code of any website, which is useful for things like downloading images from websites and debugging code or finding out what it looks like behind any site (for website designers).
You can easily turn on the Develop menu in Safari by following a couple of steps. Open Safari on your Mac and click the "Safari" button in the menu bar.
Next, select "Preferences." Alternatively, you can use the keyboard shortcut Command+, (comma). This will also open up Safari preferences.
Go to the "Advanced" tab.
Check the box for "Show Develop Menu in Menu Bar."
Now the Develop menu will appear between Bookmarks and Window at the top.
Apart from being able to view the page source, this will allow you to access developer-focused features, such as disabling JavaScript on any website.
Once you've enabled the Develop menu, there are a couple of ways to view the page source in Safari.
Open any website in Safari and right-click the blank space on the page. Now, select "Show Page Source." You can also get to this menu by using the keyboard shortcut Option+Command+u.
If you're looking for images or other media elements from any web page, Safari makes it easy to find these. In the left-hand pane, you will see various folders such as Images, Fonts, etc. Click the "Images" folder to quickly find the photos that you need.
After selecting an image, you can view its details easily by opening up the details sidebar. The button to open this is located at the top-right of the console, just below the gear icon. You can also open this with the shortcut Option+Command+0.
Click "Resource" at the top of the details sidebar to view details, such as the size of the image and its full URL.
You can change the position of the page source console easily, too. There are two buttons at the top-left of this console, right next to the X button. Click the rectangle icon to move the console to a different side within the browser window.
If you'd like to open the page source console in a separate window, you can click the two-rectangles icon. This will detach the console and open it in a separate window.
To check out the code for any specific element on the page, you can right-click that element and select "Inspect Element." This will take you directly to the code for the element that you selected.
Whenever you're done looking at the code, click the X button to close the page source console and return to browsing on Safari. You can also check out how to view a website's page source in Google Chrome here.
Related: How to View the HTML Source in Google Chrome
Safari Dev Tools: The Complete 2023 Guide
Introduction to safari developer tools.
Safari is Apple's proprietary web browser that comes pre-installed on all Mac and iOS devices. Its integrated developer tools provide everything web developers need to build, debug and optimize websites for Apple's ecosystem.
In this comprehensive tutorial, we'll cover key capabilities of Safari's dev tools including:
- The Web Inspector for inspecting page structure and CSS
- The Debugger for stepping through JavaScript code
- The Resources panel for auditing page assets
- The Audits panel for testing web standards compliance
- Device Mode for simulating mobile screens
- Advanced debugging features like conditional breakpoints
- Network throttling to simulate real-world conditions
- Experimental features for early access
By the end, you'll have master expertise using Safari dev tools to squash bugs faster, improve site performance, and deliver exceptional web experiences across Apple devices. You'll also discover resources like DevHunt to continue exploring the latest Safari developer tools.
A Brief History of Safari
Safari originated within Apple in 2003, based on the open source KHTML rendering engine. It was first released for Mac OS X Panther and quickly became Apple's default browser.
In 2007, Apple launched the first Windows version of Safari to expand its userbase. That same year, Safari made its mobile debut on the first iPhone.
Over the years, Safari has gone through many major version updates adding new features and support for emerging web standards. It remains the pre-installed browser on all Apple operating systems and devices including Macs, iPhones and iPads.
Why Learn Safari Developer Tools?
Here are some key reasons web developers should learn Safari dev tools:
- Pre-installed on all Mac and iOS devices, used by millions globally
- Allows direct debugging on iOS devices
- Can emulate mobile devices in desktop browser
- Essential for targeting Apple's ecosystem
- Identify optimizations for Safari to improve site experience
- Learn how your sites perform on Safari and make improvements
- Fix rendering issues specific to WebKit browser engine
- Utilize experimental features to build cutting-edge websites
- Discover new Safari dev tools on platforms like DevHunt
With Safari holding significant browser market share, especially in the mobile space, having expertise in its developer tools is vital for crafting high-quality cross-browser experiences.
Core Safari Developer Tools
Now let's dive into the core developer tools available within Safari on both desktop and mobile.
The Web Inspector
The Web Inspector is the main hub for visually inspecting and modifying a web page. Key functions include:
- View and edit the live DOM tree
- Inspect and modify CSS styles
- Audit accessibility information
- Analyze network requests and performance
- Identify layout issues or style problems
- Live edit code changes right in the browser
For front-end developers, the Inspector is indispensable for debugging HTML, CSS and accessibility issues. You can instantly see how changes to markup and styles affect rendering.
The Debugger
Safari's JavaScript Debugger allows pausing code execution to step through scripts line-by-line. You can:
- Set breakpoints to isolate issues
- Inspect stack traces and variable scopes
- Profile memory usage and CPU utilization
- Emulate device throttling conditions
- Blackbox third-party scripts
The Debugger equips you to tackle even the most complex JavaScript bugs. From tracking down logic errors to profiling performance, it's an essential tool for front-end logic and optimization.
The Resources Panel
This panel displays all resources loaded by the page like scripts, stylesheets, fonts, images and media. For each resource you can:
- View request URLs, status codes and timings
- Filter by type, folder location or domain
- Check dependencies and redundancy
- Audit performance and bottlenecks
- Download resources to your machine
Knowing exactly what resources a page loads is invaluable for optimizing performance. The Resources panel helps you eliminate unnecessary requests and prioritize critical assets.
Storage Inspector
The Storage Inspector lets you view and edit browser storage like cookies, LocalStorage, SessionStorage and IndexedDB. You can:
- Add, modify or delete stored keys and values
- Export storage data as JSON
- Emulate different browser states for testing
- Clear storage entirely to test initial experience
Being able to inspect persistence mechanisms is vital for debugging issues related to state management in modern web apps.
The Audits Panel
Safari's Audits panel runs diagnostics on pages to surface optimization opportunities and standards compliance issues. Audits include:
- Performance analysis and scoring
- Accessibility checks following WCAG guidelines
- Best practices for progressive web apps
- SEO enhancements
- Modern web platform usage
Running audits before launching any website can help you catch critical problems early and compare against industry benchmarks.
Advanced Safari Developer Tools
Beyond the basics, Safari offers powerful advanced tools for seasoned developers.
Device Mode
Device Mode accurately emulates mobile screens and conditions right in desktop Safari:
- Simulate precise device dimensions and resolution
- Throttle CPU and network to mimic real devices
- Essential for building mobile-friendly, responsive sites
- Test touch events and gestures during development
With Device Mode, you can build fully optimized mobile experiences without constantly switching devices.
Advanced Debugging
Safari provides next-level JavaScript debugging capabilities:
- Set conditional breakpoints using expressions
- Group breakpoints for easy management
- Step through async code with async stack traces
- Profile memory heap allocations over time
- Blackbox scripts to hide library code
- Break on caught or uncaught exceptions
These advanced features help you tackle difficult bugs in even the most complex single-page apps and frameworks like Vue.js.
Network Throttling
Network Throttling allows simulating slow network connections, like 3G and LTE. You can:
- Rate limit bandwidth and latency
- Identify assets blocking page load
- Debug loading behavior in emerging markets
- Optimize performance for offline/low-bandwidth
- Throttle cache usage and response compression
Testing how your site performs under real-world network conditions is crucial to providing good user experiences for all.
Experimental Features
Safari lets developers try out experimental tools before they are formally released:
- Get early access to new capabilities
- Provide feedback to help shape future features
- Use at your own risk as they are still in development
- Currently includes CSS Flexbox debugging tools
Tapping into experimental features allows you to build cutting-edge experiences and directly influence the browser platform's evolution.
Debugging JavaScript Issues
Now let's explore strategies for debugging JavaScript using Safari's advanced capabilities.
Breakpoint Usage
Effective breakpoint usage is key for isolating issues:
- Set breakpoints directly within the source code
- Organize breakpoints into groups by context
- Use conditional breakpoints to pause on specific criteria
- Disable breakpoints without deleting to toggle behavior
- Manage breakpoints efficiently even in complex codebases
Mastering breakpoints gives you precise control over pausing execution to inspect logic flow and data.
Scope Inspection
Understanding scope is vital for tracking down variable issues:
- Inspect variable values in different call frames
- Detect scope pollution across closures and modules
- Ensure code executes in the intended lexical scope
- Fix bugs caused by accessing stale variable references
- Avoid global namespace pollution
With Safari's scoping tools, you can confidently debug even complex nested closures and callback contexts.
Async Debugging
Safari provides multiple approaches for debugging asynchronous code:
- Step through promise resolutions and rejections
- Inspect async operation call stacks and task queues
- Profile async code performance with CPU profiler
- Set breakpoints within async callbacks and timers
- Visually trace async code flows
Smooth async debugging helps you tackle race conditions, timing issues, and callback hell.
Error Handling
The key to debugging runtime errors is Safari's break on exception feature:
- Break on any caught or uncaught exceptions
- Inspect error call stacks to trace where issues originate
- Log values with console.log() to debug logic flow
- Validate edge cases and fix crashes
- Handle errors gracefully to improve user experience
With robust error handling, you can isolate bugs quicker and build more resilient apps.
Optimizing Page Speed
Next let's explore some common techniques for optimizing page speed using Safari developer tools.
Image Optimization
Safari provides multiple ways to optimize images:
- Audit image sizes and formats using the Resources panel
- Compress and resize images as needed
- Lazy load offscreen images to improve TTI
- Serve next-gen formats like WebP to Safari users
- Remove unnecessary decorative images
With Safari's insight into image resources, you can significantly cut page weight and load times.
Script Loading
Optimizing script loading is key for performance:
- Minimize parser-blocking JavaScript
- Load non-critical scripts asynchronously
- Dynamically create and load scripts
- Code split bundles into logical chunks
- Tree shake and minify code to reduce payload
Safari shows you exactly how scripts impact loading behavior so you can optimize delivery.
Caching Assets
Effective caching can boost repeat visit performance:
- Set optimal cache lifetimes for static assets
- Cache assets locally using service workers
- Version assets linked to app release cycles
- Avoid cache-busting query strings
- Maximize cache reuse for returning users
The Resources panel helps you dial in caching for faster loads without staleness.
Layout Thrashing
Diagnosing layout thrashing is key for smooth UX:
- Identify forced synchronous layouts
- Defer non-critical DOM updates with requestAnimationFrame()
- Avoid reading styles after writes during rendering
- Batch DOM reads/writes together
- Profile with Debugger to pinpoint problems
With Safari's performance tools, you can isolate and fix sources of jank and lag.
Wrap Up and Key Takeaways
Safari developer tools provide everything needed to build high-quality websites targeting Apple's ecosystem.
Key highlights include:
- Debugging directly on iOS devices with Web Inspector
- Stepping through JavaScript with advanced Debugger features
- Auditing pages for standards compliance
- Simulating mobile devices and networks during development
- Optimizing performance using Network Throttling
- Trying out experimental capabilities early
- Discovering new Safari dev tools on platforms like DevHunt
Learning Safari developer tools allows you to find and fix cross-browser issues faster. You can optimize sites specifically for Safari and deliver stellar experiences to millions of Apple users worldwide.
With a comprehensive understanding of Safari's robust toolset, you can confidently build, debug and enhance modern progressive web apps. Safari developer tools help web developers succeed across platforms.
Related posts
- Safari Developer Tools: The Complete Guide for Web Developers
- Discover the Top Web Developer Tools for 2023
- Unlock Safari's Powerful Developer Tools
- Dev Tools iOS Developers Need in 2023
- Web Browser
- Google Chrome Browser
- Mozilla Firefox Browser
- Microsoft Edge Browser
- Apple Safari Browser
- Tor Browser
- Opera Browser
- DuckDuckGo Browser
- Brave Browser
- Basic and advance shortcut keys in Apple Safari Browser
- Hidden tricks inside Apple Safari Browser
- Bookmark in Apple Safari Browser
- Architecture of Apple Safari Browser
- Apple to Launch Search Engine to Rival Google
Safari for Developement
- DevTools in Apple Safari Browser
Developer Mode in Safari Browser
- Debugger In Apple Safari Browser
Safari Tabs
- Console Tab in Safari Browser
- Sources Tab in Apple Safari Browser
- Storage Tab in Apple Safari Browser
- Elements Tab in Apple Safari Browser
- Network Tab in Apple Safari Browser
- Web Capture Tabs in Apple Safari Browser
How to .. in Safari
- How to enable or disable split view in Apple Safari Browser ?
- How to disable or enable auto-play videos in Apple Safari Browser ?
- How to Allow Pop-Ups in Safari?
- How to use Safari for web development
- How to use inspect element in Chrome, Firefox and Safari ?
- How to Browse in Apple Safari Browser ?
The Safari developer mode consists of a suite of tools meant to help web developers design, troubleshoot, and speed up their websites and Web apps. These functions contribute towards refining web development by incorporating measures that can be used to examine, revise, or evaluate web content.
The bulk of Safari Developer Mode is composed of Safari Web Inspector. This toolset functions as an entrance to numerous capabilities including accessing and modifying the heart of web page attributes such as the HTML structure for websites, CSS stylesheets, javascript functionalities, webpage performance, and debugging possibilities.
Table of Content
Benefits of Safari Developer Mode
- How to open safari developer mode
- Various options available in Developer mode
Example Showing Usage
The usage of Safari Developer Mode offers an array of benefits to developers and web development teams:
- Efficient Debugging: You can pinpoint, fix, and understand issues from the heart of a page’s components.
- Performance Optimization: Optimization of loading times by analyzing and restructuring network requests.
- Real-time Testing and Modification: Enabled real-time changes and testing that support faster development steps.
- Device Emulation: Help in producing responsive designs by simulating and imagining how the site looks on different devices.
- Responsive Design Mode: This is an app that mimics what a page looks like on different screen sizes of mobile devices across multiple orientations. It helps in creating responsive design and checking a website’s performance on various gadgets.
How to open safari developer mode:
Activating Safari Developer Mode requires a few simple steps:
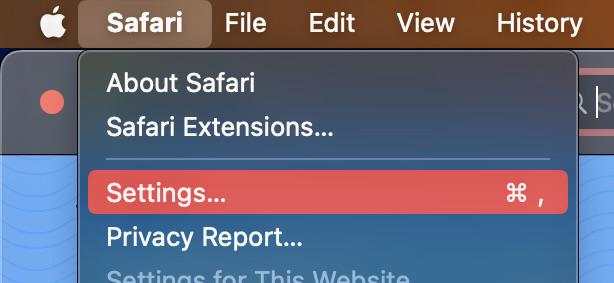
openning safari settings
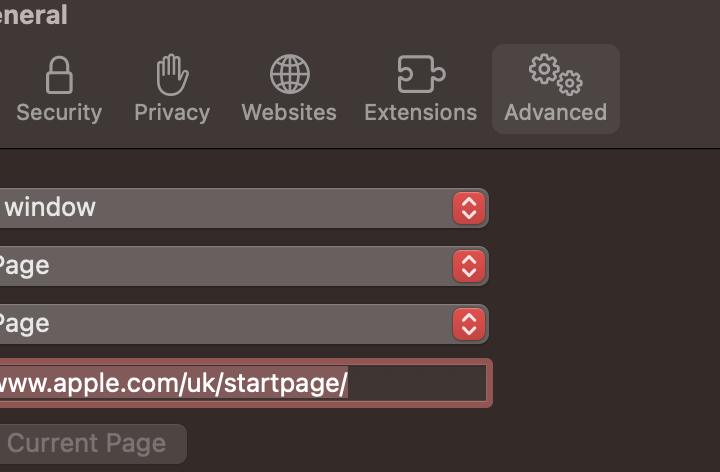
open advanced

Develop menu
- Open the Web Inspector: Go to Develop, click on “ Show Web Inspector. ”
Various options available in Developer mode:
Here are some of the key tools available in the developer mode of Safari browser:
The Inspector tool allows developers to examine and modify the Document Object Model (DOM) of a webpage. This helps in understanding the structure of the HTML and CSS, as well as making real-time changes to see their effects.
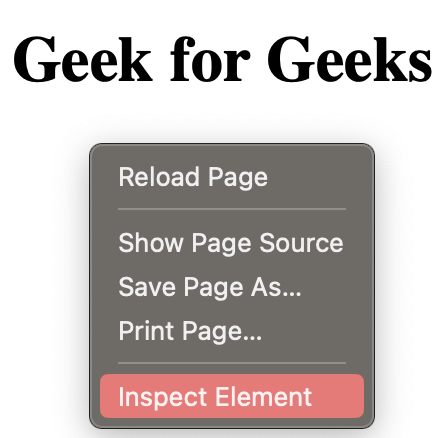
Inpecting Web page
The Console provides a JavaScript console for developers to log information, execute JavaScript code, and catch errors. It is a valuable tool for debugging scripts and testing code snippets.
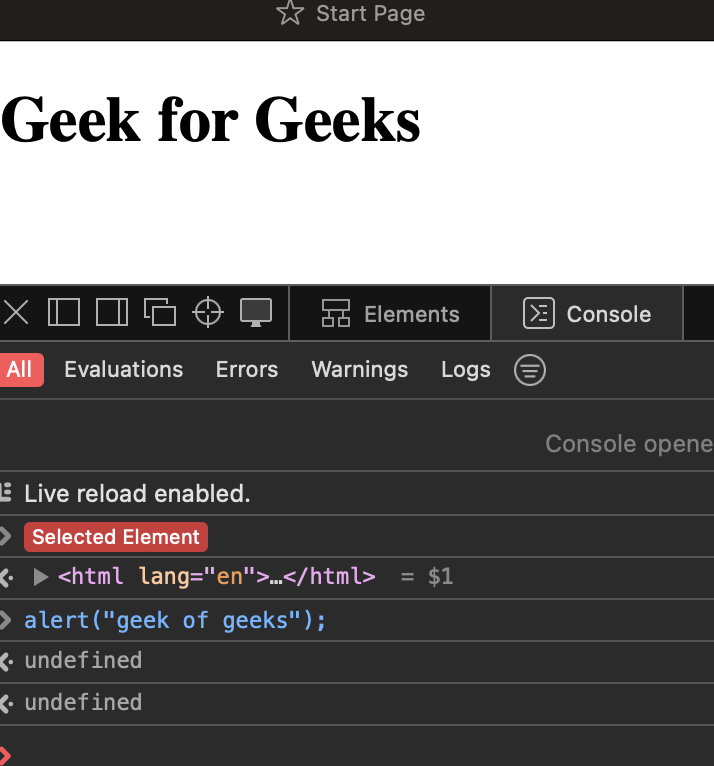
Console mode
This panel is an extension of the Inspector tool, providing a detailed view of the HTML and CSS elements on the page. Developers can modify styles, attributes, and content directly within this panel.
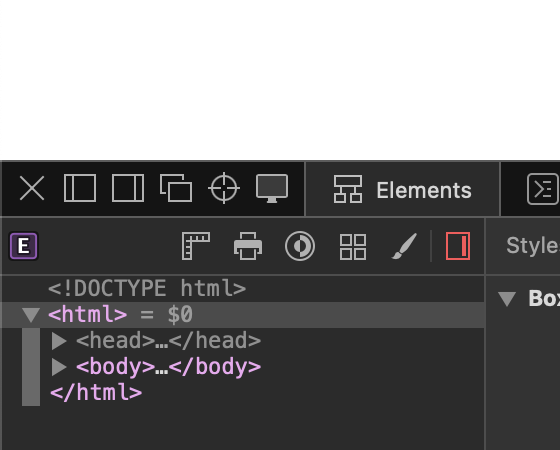
Elements tab
The Sources panel allows developers to debug JavaScript code. It includes features like breakpoints, stepping through code, and watching variables, helping developers identify and fix issues in their scripts.
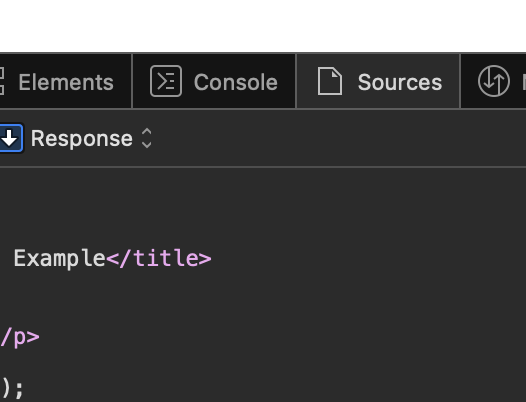
Sources tab
The Network panel provides insights into the network activity of a webpage, showing details of all resources loaded, their sizes, and loading times. This is crucial for optimizing page performance.
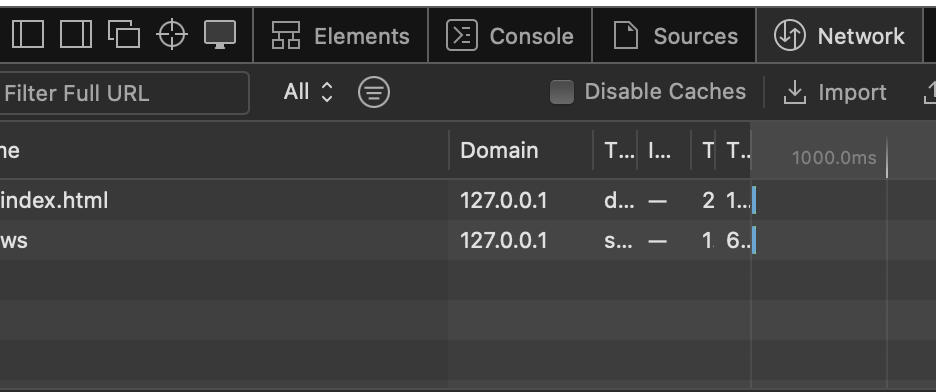
Network tab
The Timeline tool records and visualizes various events on a webpage, such as script execution, rendering, and painting. This helps developers identify performance bottlenecks and optimize their code.
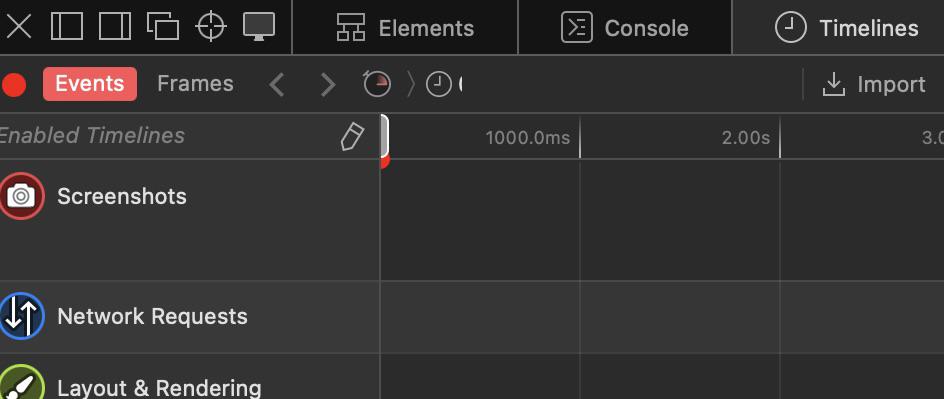
Timelines tab
The Storage panel allows developers to inspect and modify data stored by the website, including cookies, local storage, and session storage. This is useful for debugging and testing how a website handles data storage.
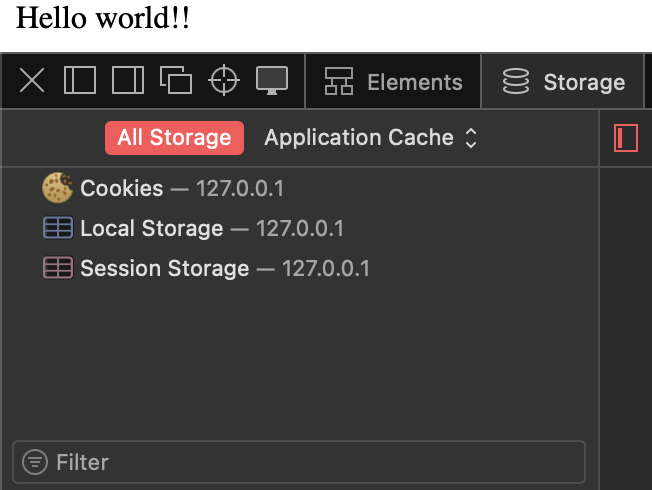
Storage tab
Now, let us look at a particular scenario where we will fix a problem with a web page using Safari Developer Mode. Imagine a case where the layout of a website gets altered because it has a problem relating to CSS style. The web inspector allows a person to pick out the bad part, inspect and fix the CSS properties in real time. Here’s a image showcasing this process:
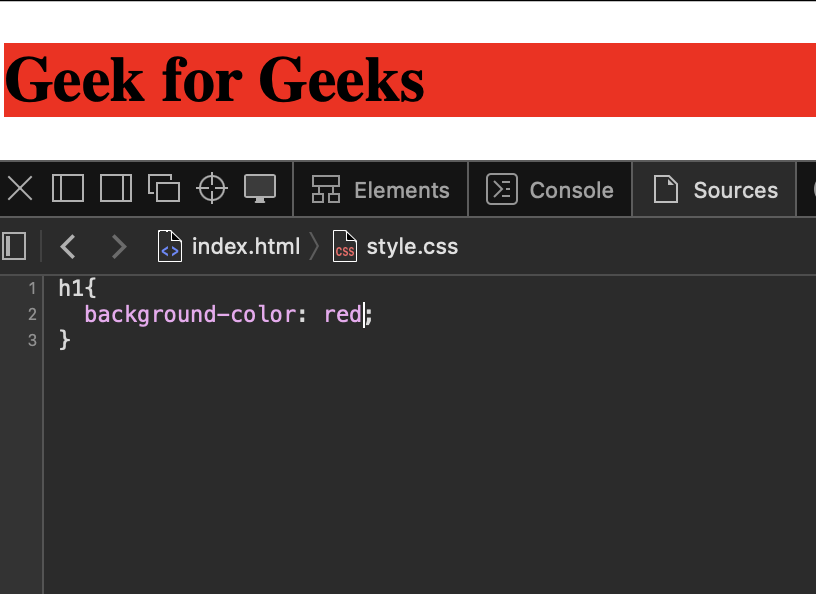
Web developers rely on Safari Developer Mode; it is a great tool with multiple features and functions vital for effective web development. For web developers, the Safari Developer Mode equipped with the Web Inspector forms an amazing partner that possesses a toolbox for creating, debugging, and optimizing websites. It goes through HTML, CSS, JavaScript, network performance, as well as responsive design. The suite facilitates convenient debugging, live testing, and diverse instrumentation. This touches on project development starting right at its conception, incorporating quality and responsiveness aspects in design. In brief, it is a point of reference for making beautiful and fast websites even at this digital world.
Please Login to comment...
Similar reads.

- Apple Safari
- Geeks Premier League 2023
- Geeks Premier League
- Web Browsers
- 10 Ways to Use Slack for Effective Communication
- 10 Ways to Use Google Docs for Collaborative Writing
- NEET MDS 2024 Result: Toppers List, Category-wise Cutoff, and Important Dates
- NDA Admit Card 2024 Live Updates: Download Your Hall Ticket Soon on upsc.gov.in!
- 30 OOPs Interview Questions and Answers (2024)

Improve your Coding Skills with Practice
What kind of Experience do you want to share?
- Español – América Latina
- Português – Brasil
- Tiếng Việt
- More panels
Simulate mobile devices with device mode

Use device mode to approximate how your page looks and performs on a mobile device.
Device mode is the name for a collection of features in Chrome DevTools that help you simulate mobile devices. These features include:
- Simulating a mobile viewport
- Throttling the CPU
- Simulating geolocation
- Setting orientation
Limitations
Think of device mode as a first-order approximation of how your page looks and feels on a mobile device. With device mode you don't actually run your code on a mobile device. You simulate the mobile user experience from your laptop or desktop.
There are some aspects of mobile devices that DevTools will never be able to simulate. For example, the architecture of mobile CPUs is very different than the architecture of laptop or desktop CPUs. When in doubt, your best bet is to actually run your page on a mobile device. Use Remote Debugging to view, change, debug, and profile a page's code from your laptop or desktop while it actually runs on a mobile device.
Simulate a mobile viewport
Click devices Toggle device toolbar to open a toolbar that lets you simulate a mobile viewport.

By default, the device toolbar opens in viewport with Dimensions set to Responsive .
Responsive Viewport Mode
Drag the handles to resize the viewport to whatever dimensions you need. Or, enter specific values in the width and height boxes. In this example, the width is set to 480 and the height is set to 415 .

Alternatively, use the width presets bar to set the width with a click to one of the following:

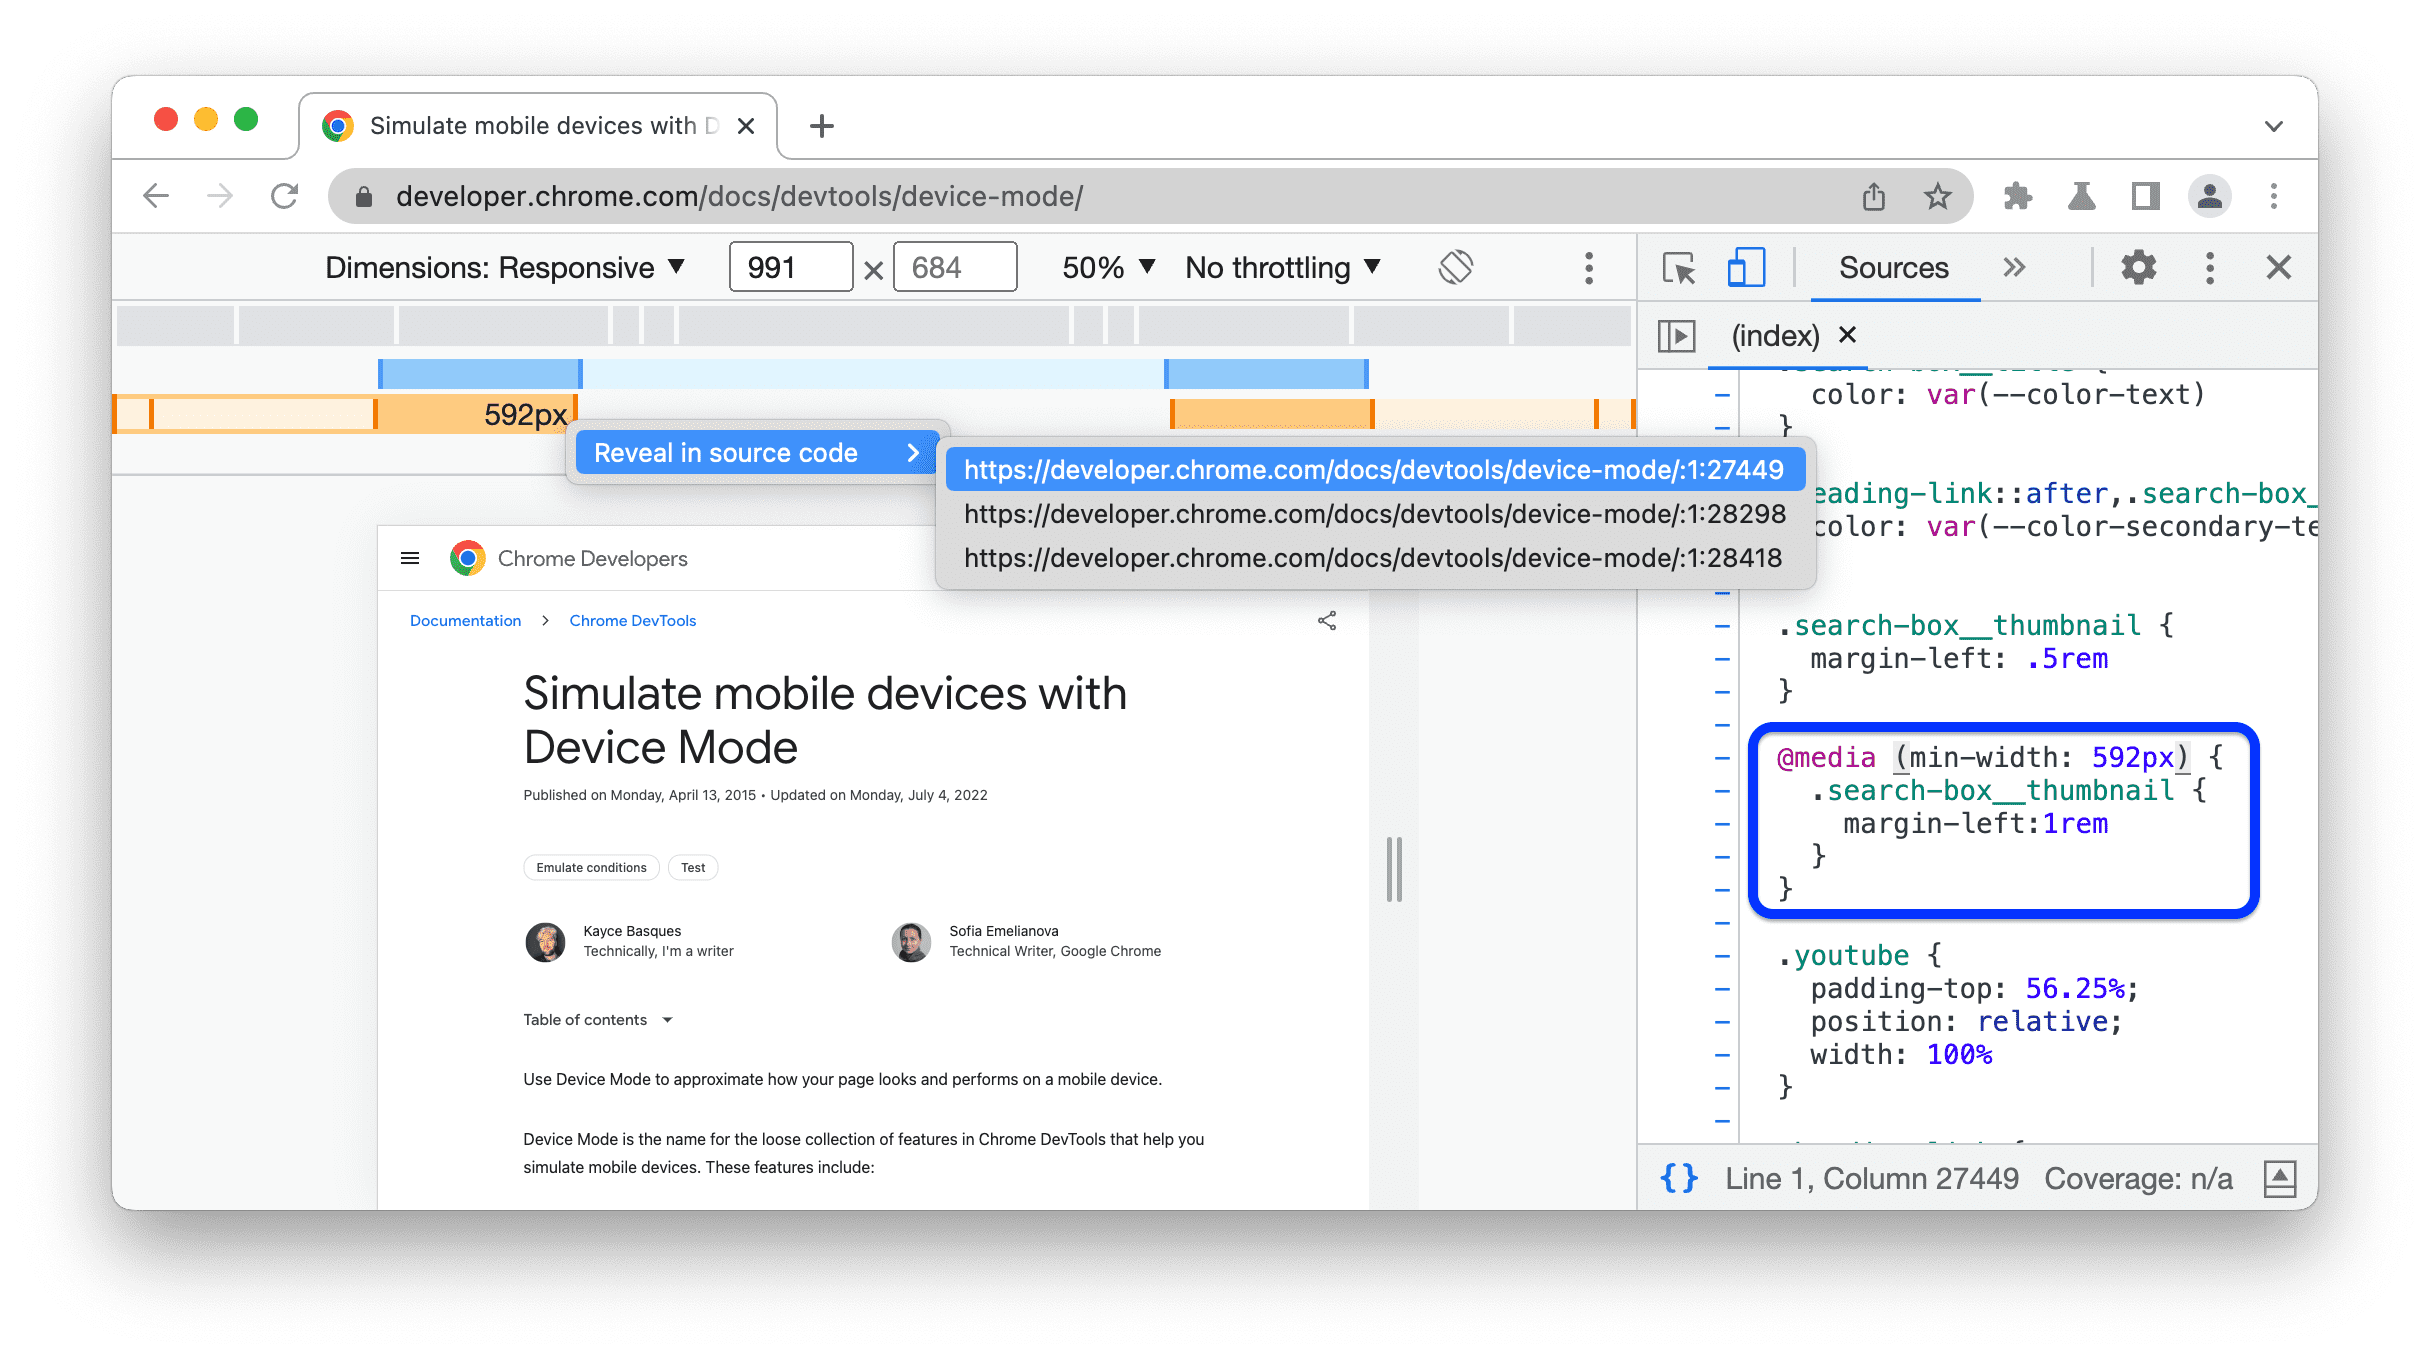
Show media queries

DevTools now displays two additional bars above the viewport:
- The blue bar with max-width breakpoints.
- The orange bar with min-width breakpoints.
Click between breakpoints to change the viewport's width so that the breakpoint gets triggered.

To find the corresponding @media declaration, right-click between breakpoints and select Reveal in source code . DevTools opens the Sources panel at the corresponding line in the Editor .
Set device pixel ratio
Device pixel ratio (DPR) is the ratio between physical pixels on the hardware screen and logical (CSS) pixels. In other words, DPR tells Chrome how many screen pixels to use to draw a CSS pixel. Chrome uses the DPR value when drawing on HiDPI (High Dots Per Inch) displays.
To set a DPR value:
In the action bar at the top of the viewport, select a DPR value from the new DPR drop-down menu.

Set the device type
Use the Device Type list to simulate a mobile device or desktop device.
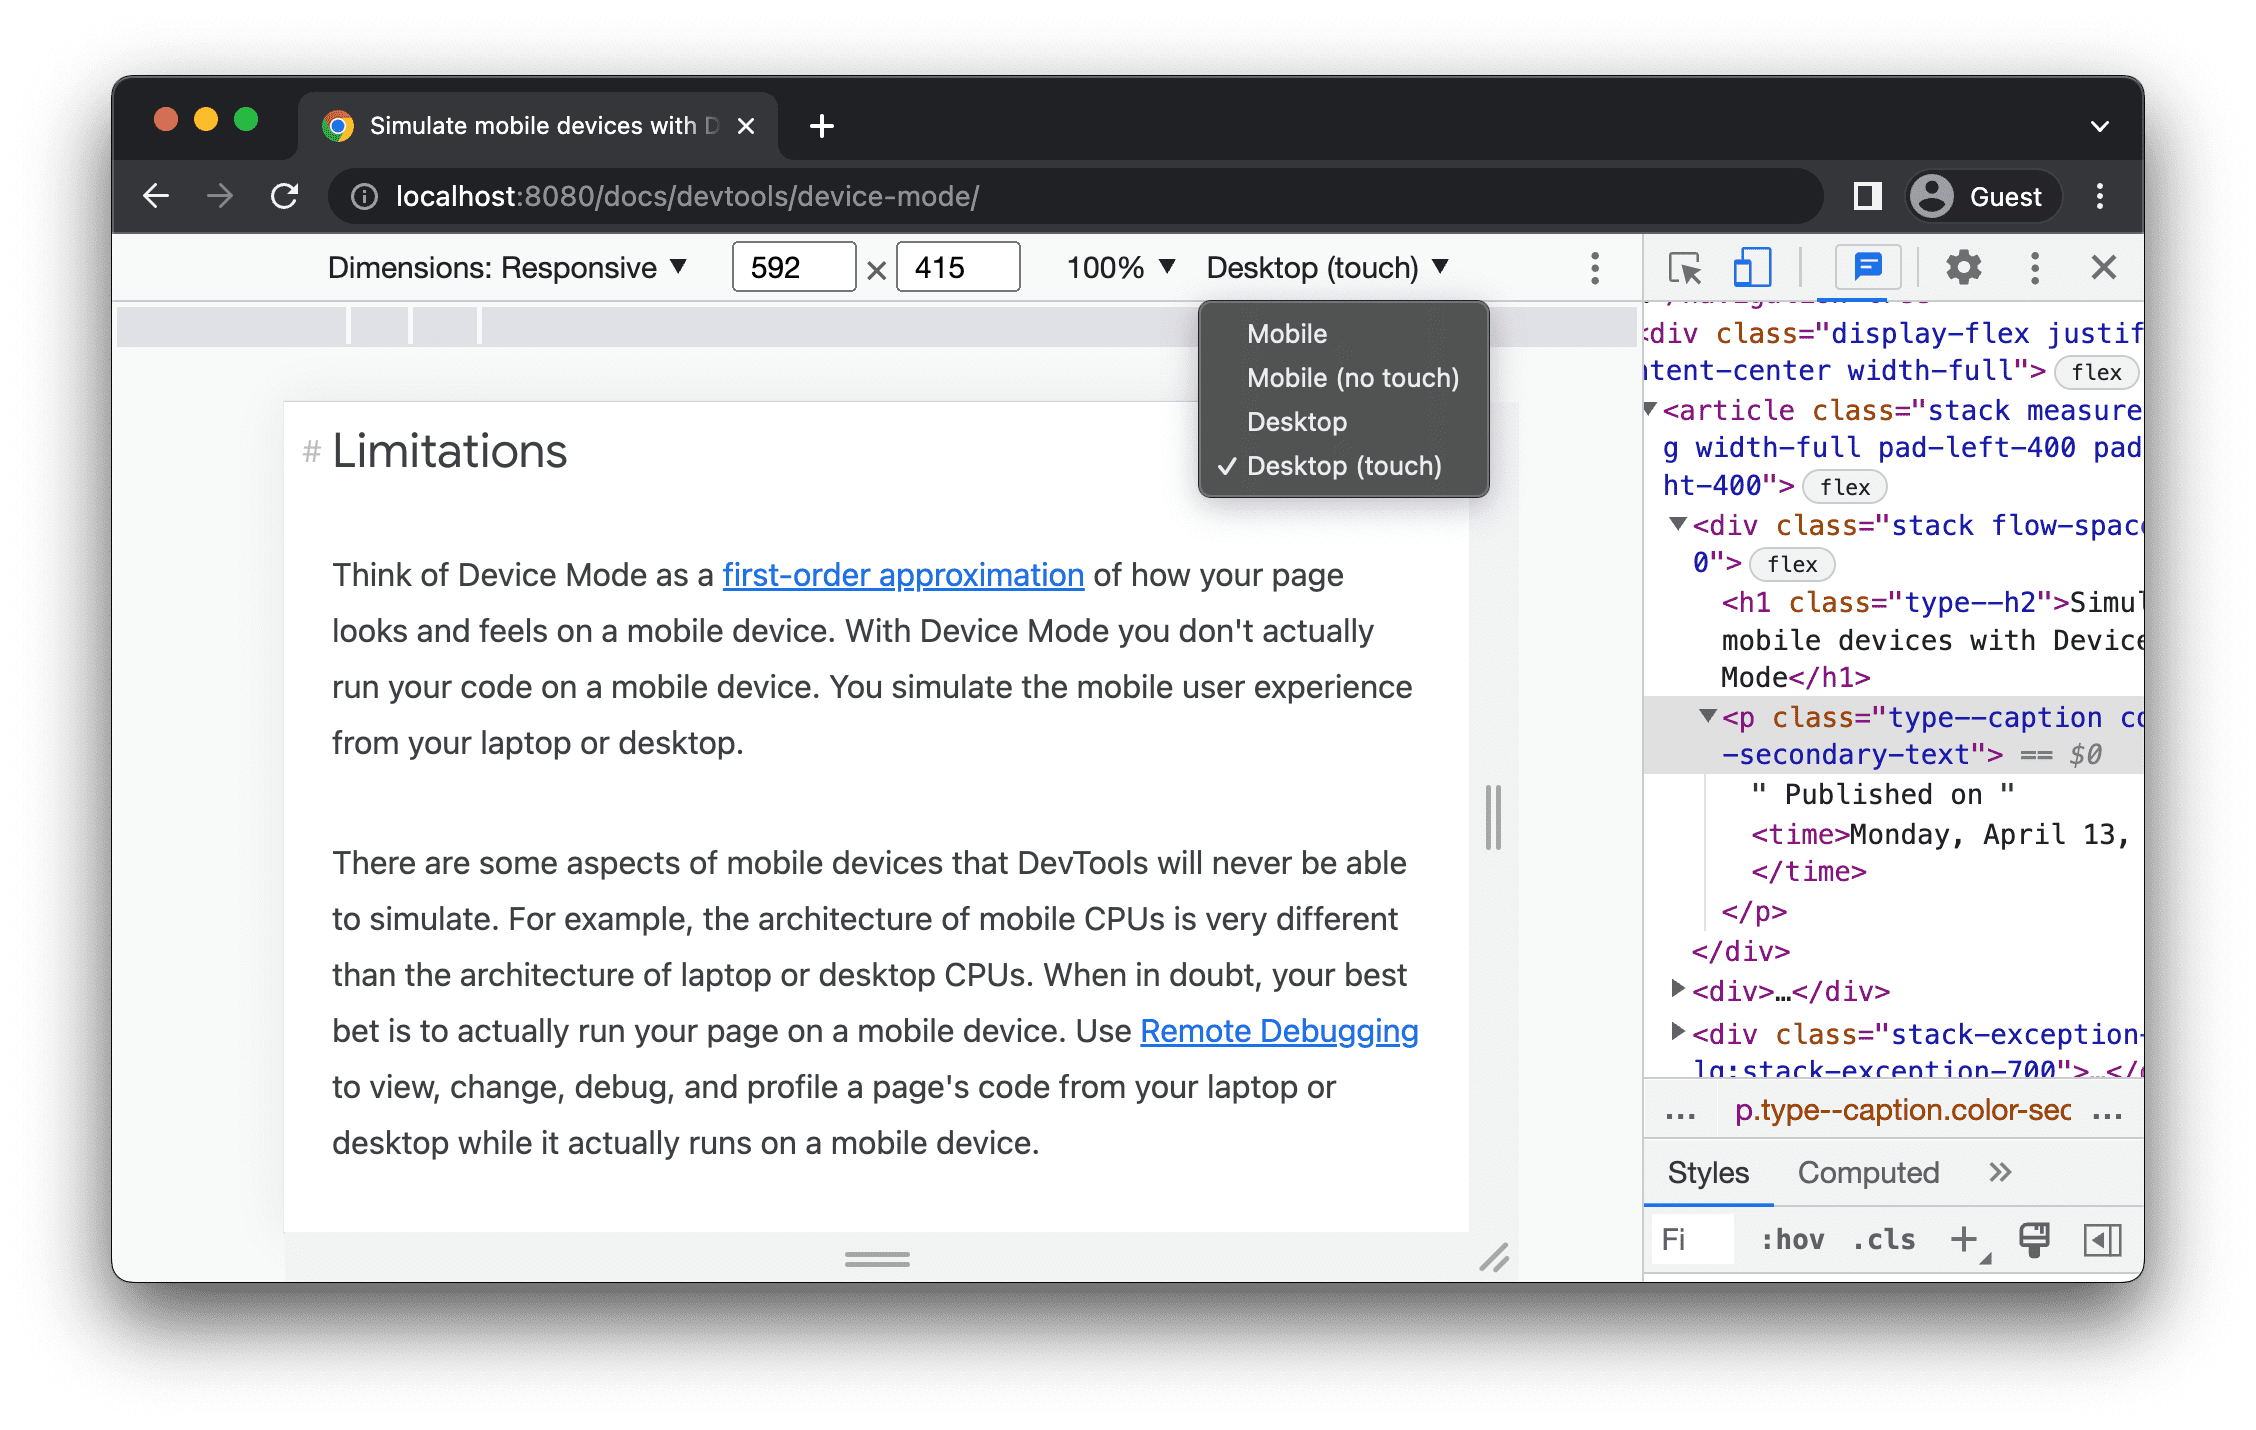
The next table describes the differences between the options. Rendering method refers to whether Chrome renders the page as a mobile or desktop viewport. Cursor icon refers to what type of cursor you see when you hover over the page. Events fired refers to whether the page fires touch or click events when you interact with the page.
Device-specific mode
To simulate the dimensions of a specific mobile device, select the device from the Dimensions list.

For more information, see Add a custom mobile device .
Rotate the viewport to landscape orientation
Click screen_rotation Rotate to rotate the viewport to landscape orientation.

See also Set orientation .
Toggle dual-screen mode
Some devices, for example, Surface Duo, have two screens and two ways to use them: with one or both screens active.
To toggle between dual and single screen, click the devices_fold Toggle dual-screen mode in the toolbar.

Set device posture
Some devices, for example, Asus Zenbook Fold, have foldable screens. Such screens have a posture: continuous or folded. The continuous posture refers to a "flat" position and folded forms an angle between sections of the display.
To set the device posture, select Continuous or Folded from the corresponding drop-down menu in the toolbar.

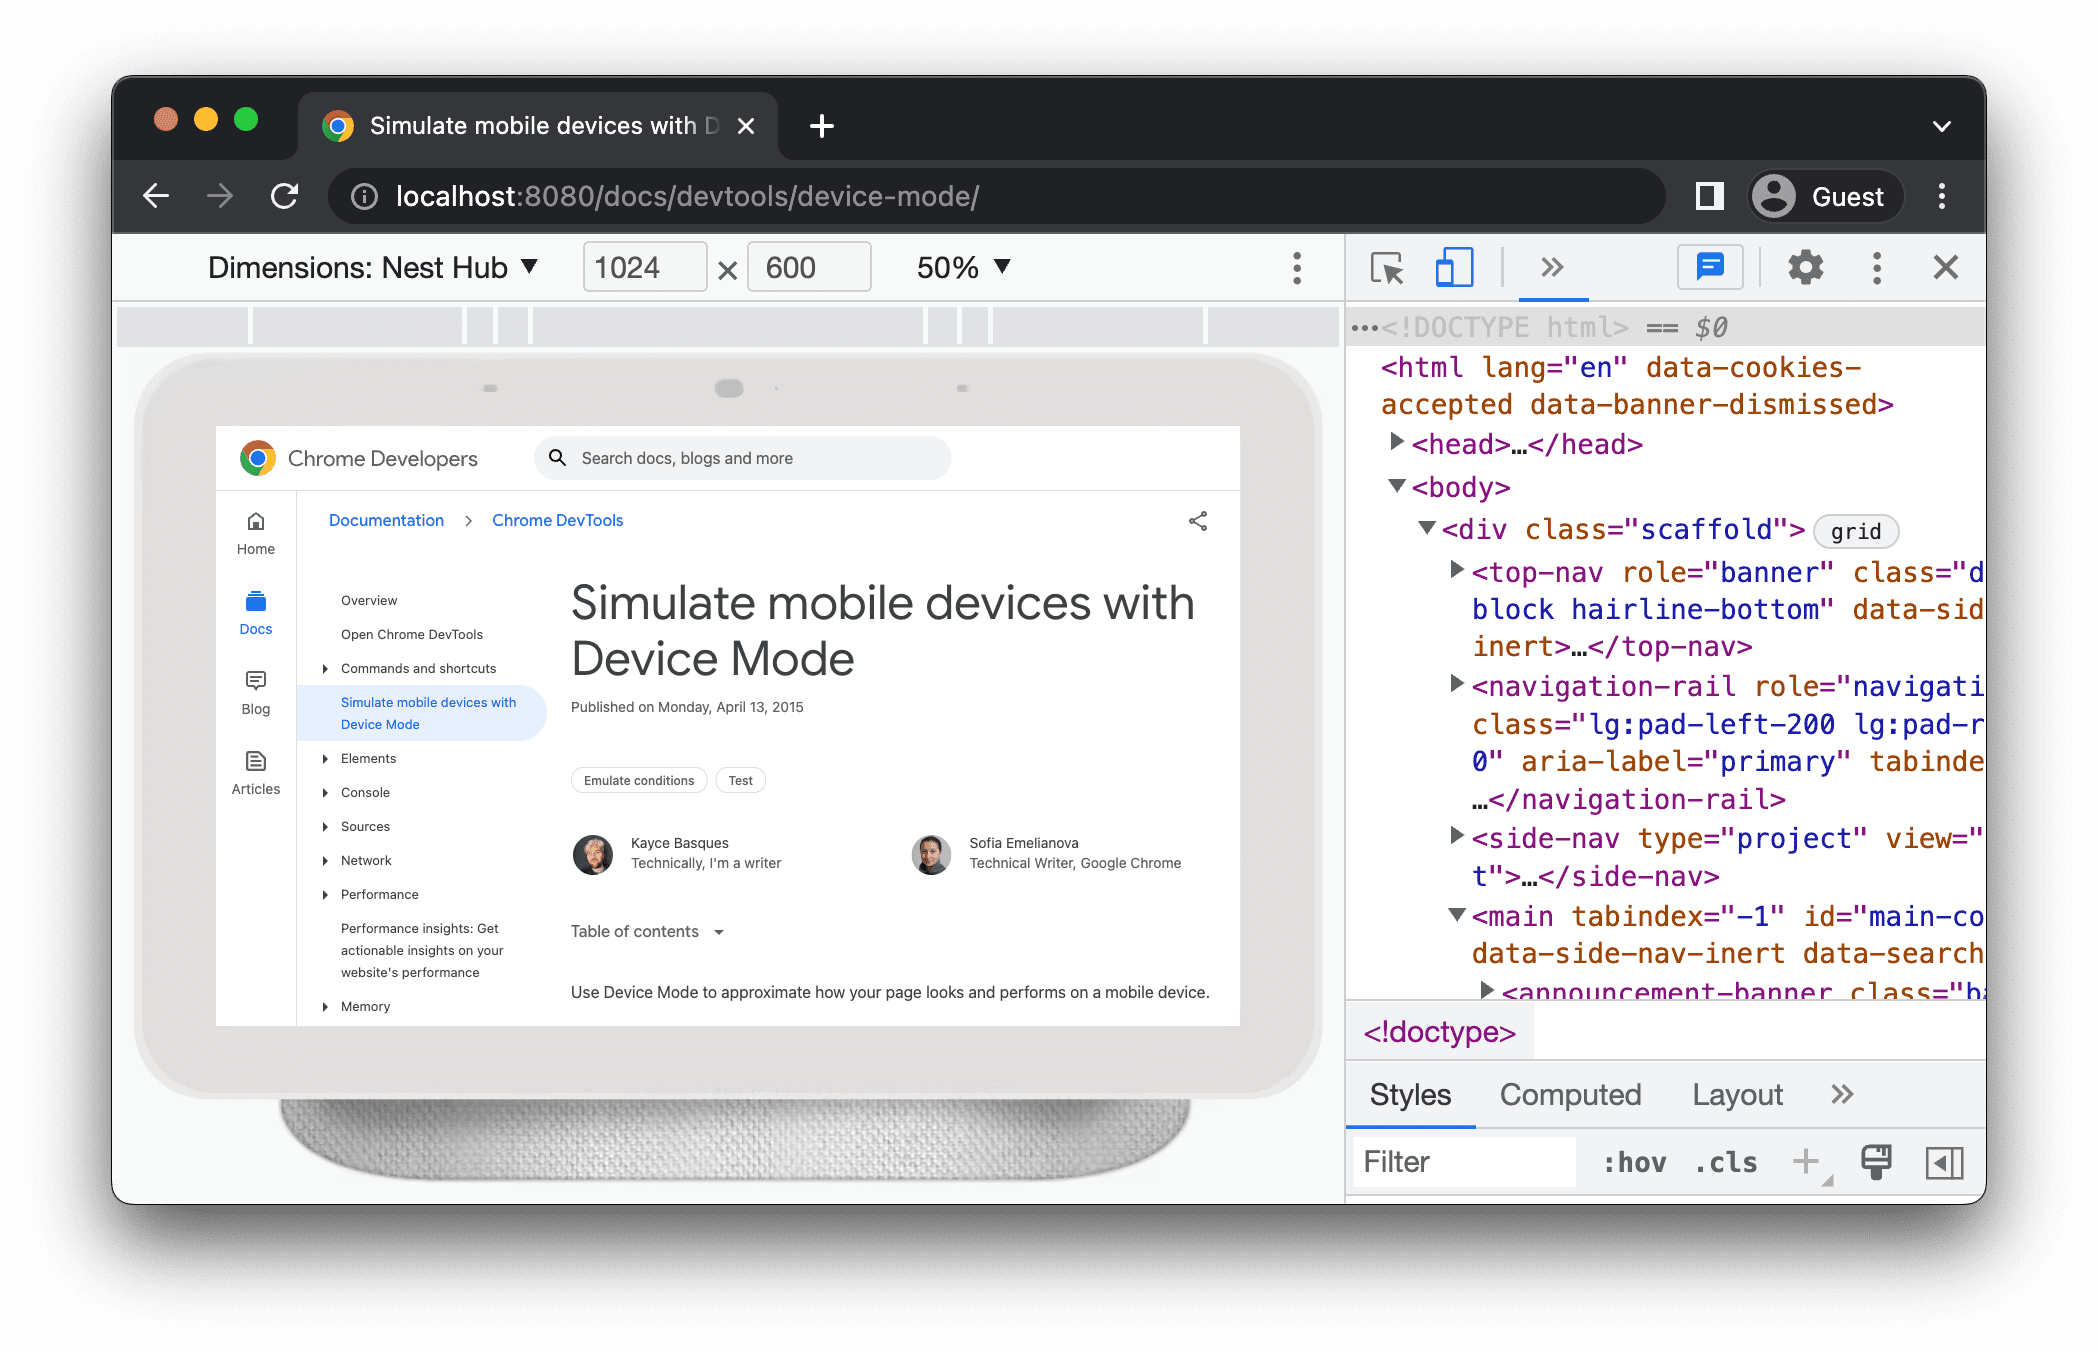
Show device frame

In this example, DevTools shows the frame for the Nest Hub.
Add a custom mobile device
To add a custom device:
Click the Device list and then select Edit .
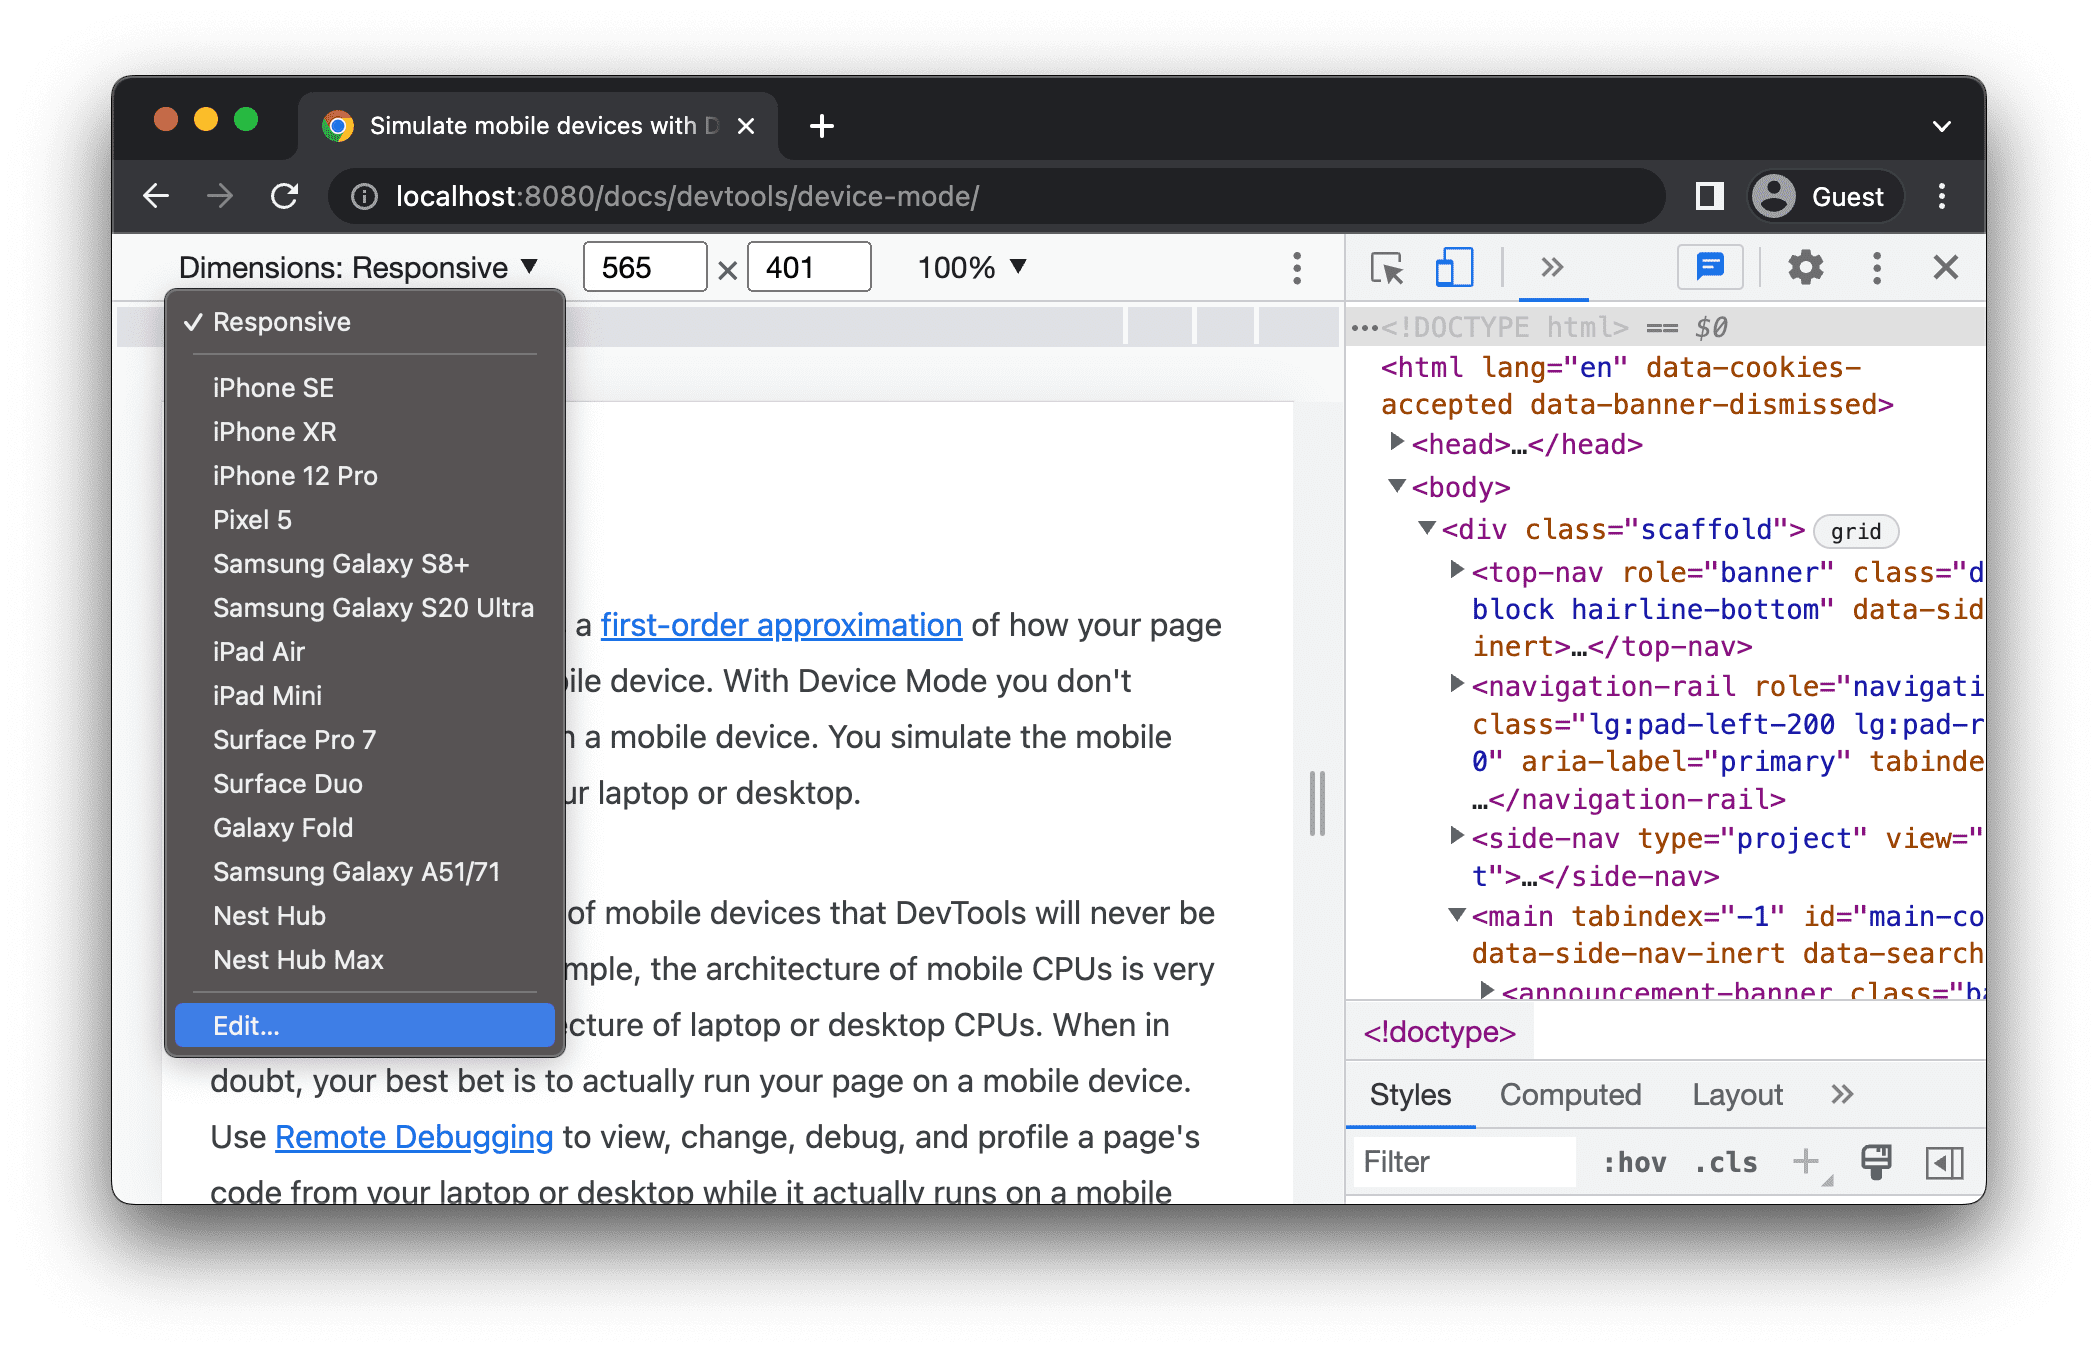
On the Settings > Devices tab, either choose a device from the list of supported ones or click Add custom device to add your own.
If you're adding your own, enter a name, width, and height for the device, then click Add .

The device pixel ratio , user agent string , and device type fields are optional. The device type field is the list that is set to Mobile by default.
Back in the viewport, select the newly added device from the Dimensions list.
Show rulers

DevTools shows rulers at the top and to the left of the viewport.

Click the rulers at specific marks to set the viewport's width and height.
Zoom the viewport
Use the Zoom list to zoom in or out.

Capture a screenshot
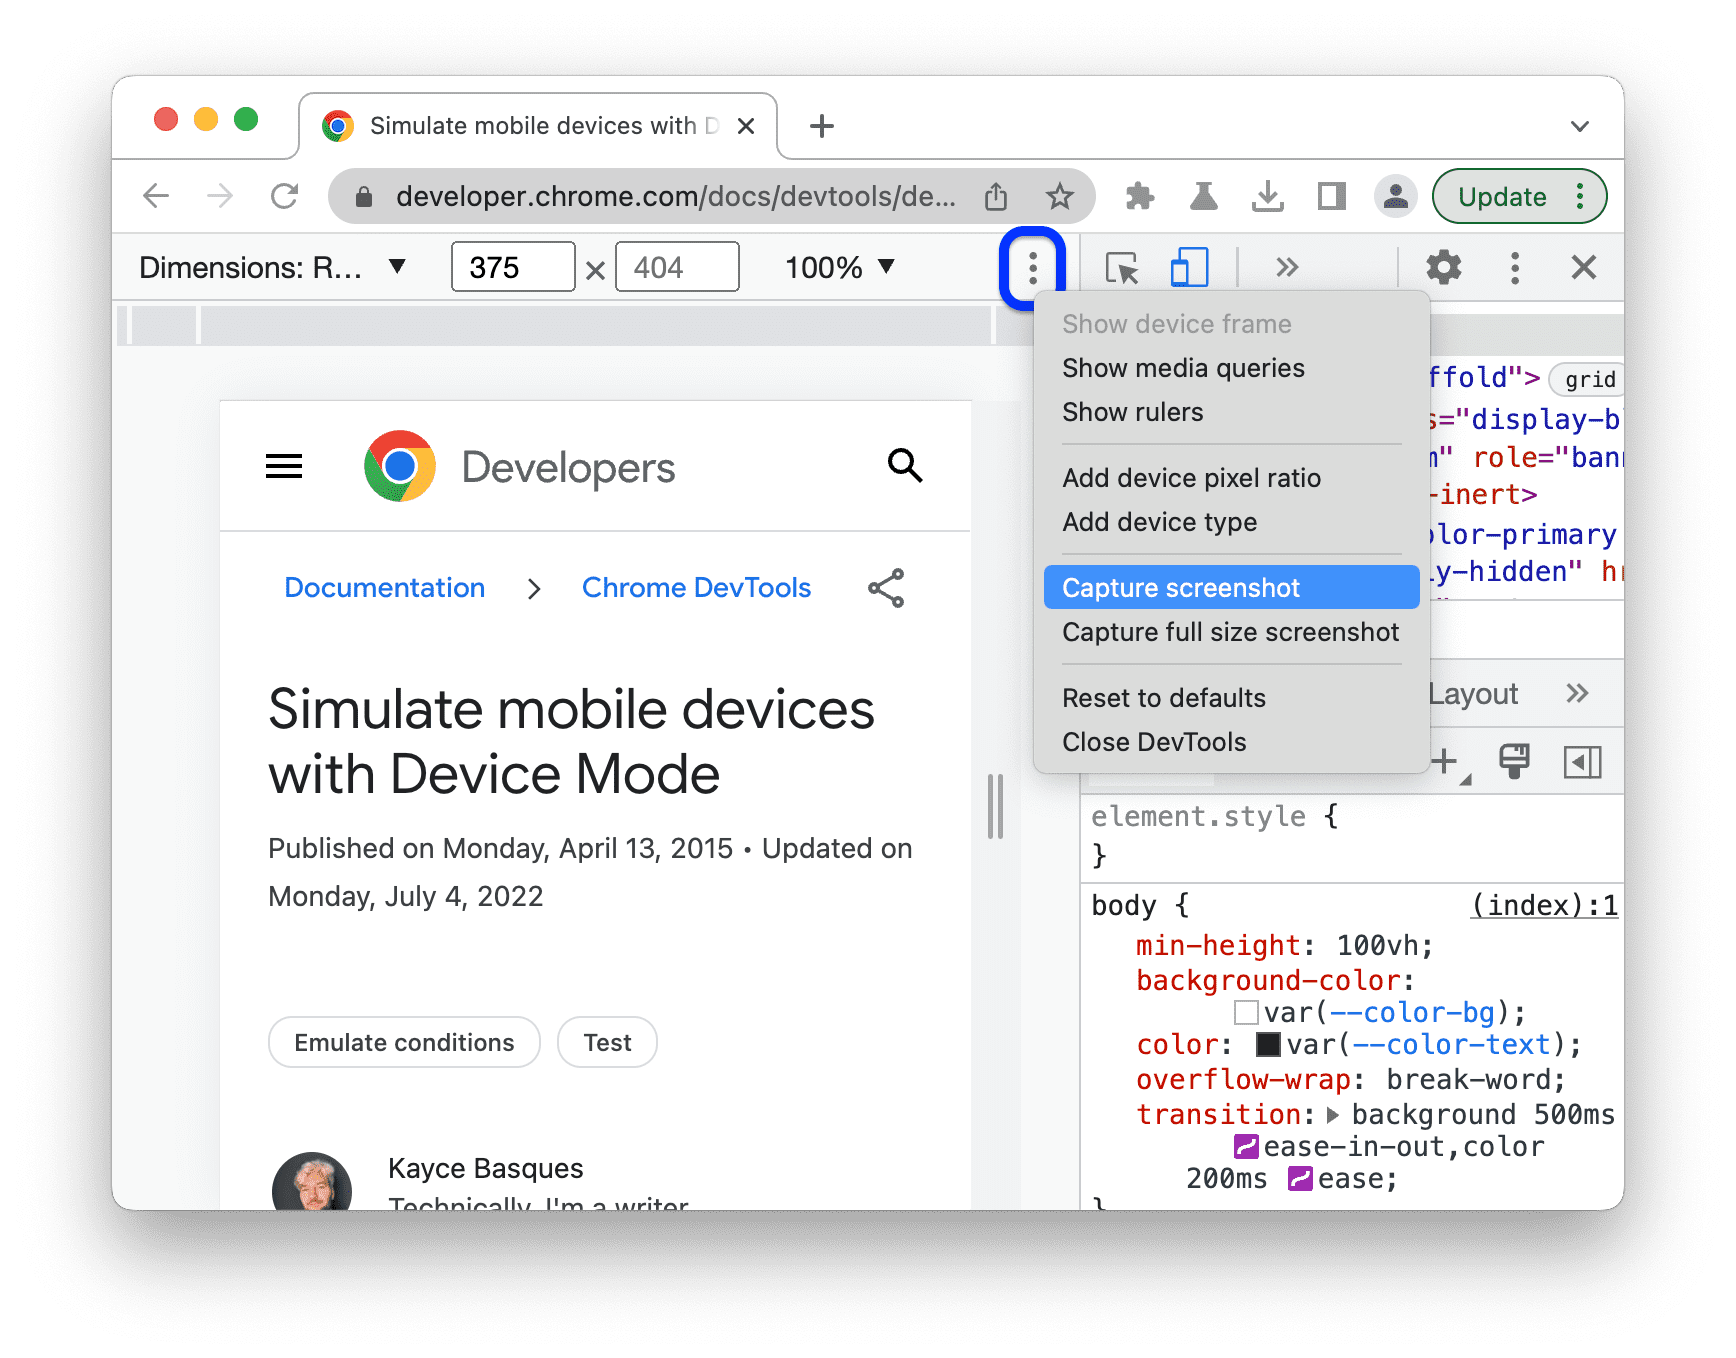
To capture a screenshot of the whole page including the content that isn't visible in the viewport, select Capture a full size screenshot from the same menu.
Throttle the network and CPU
To throttle both the network and CPU, select Mid-tier mobile or Low-end mobile from the Throttle list.
Mid-tier mobile simulates fast 3G and throttles your CPU so that it is 4 times slower than normal. Low-end mobile simulates slow 3G and throttles your CPU 6 times slower than normal. Keep in mind that the throttling is relative to the normal capability of your laptop or desktop.
Note that the Throttle list will be hidden if your Device toolbar is narrow.
Throttle the CPU only
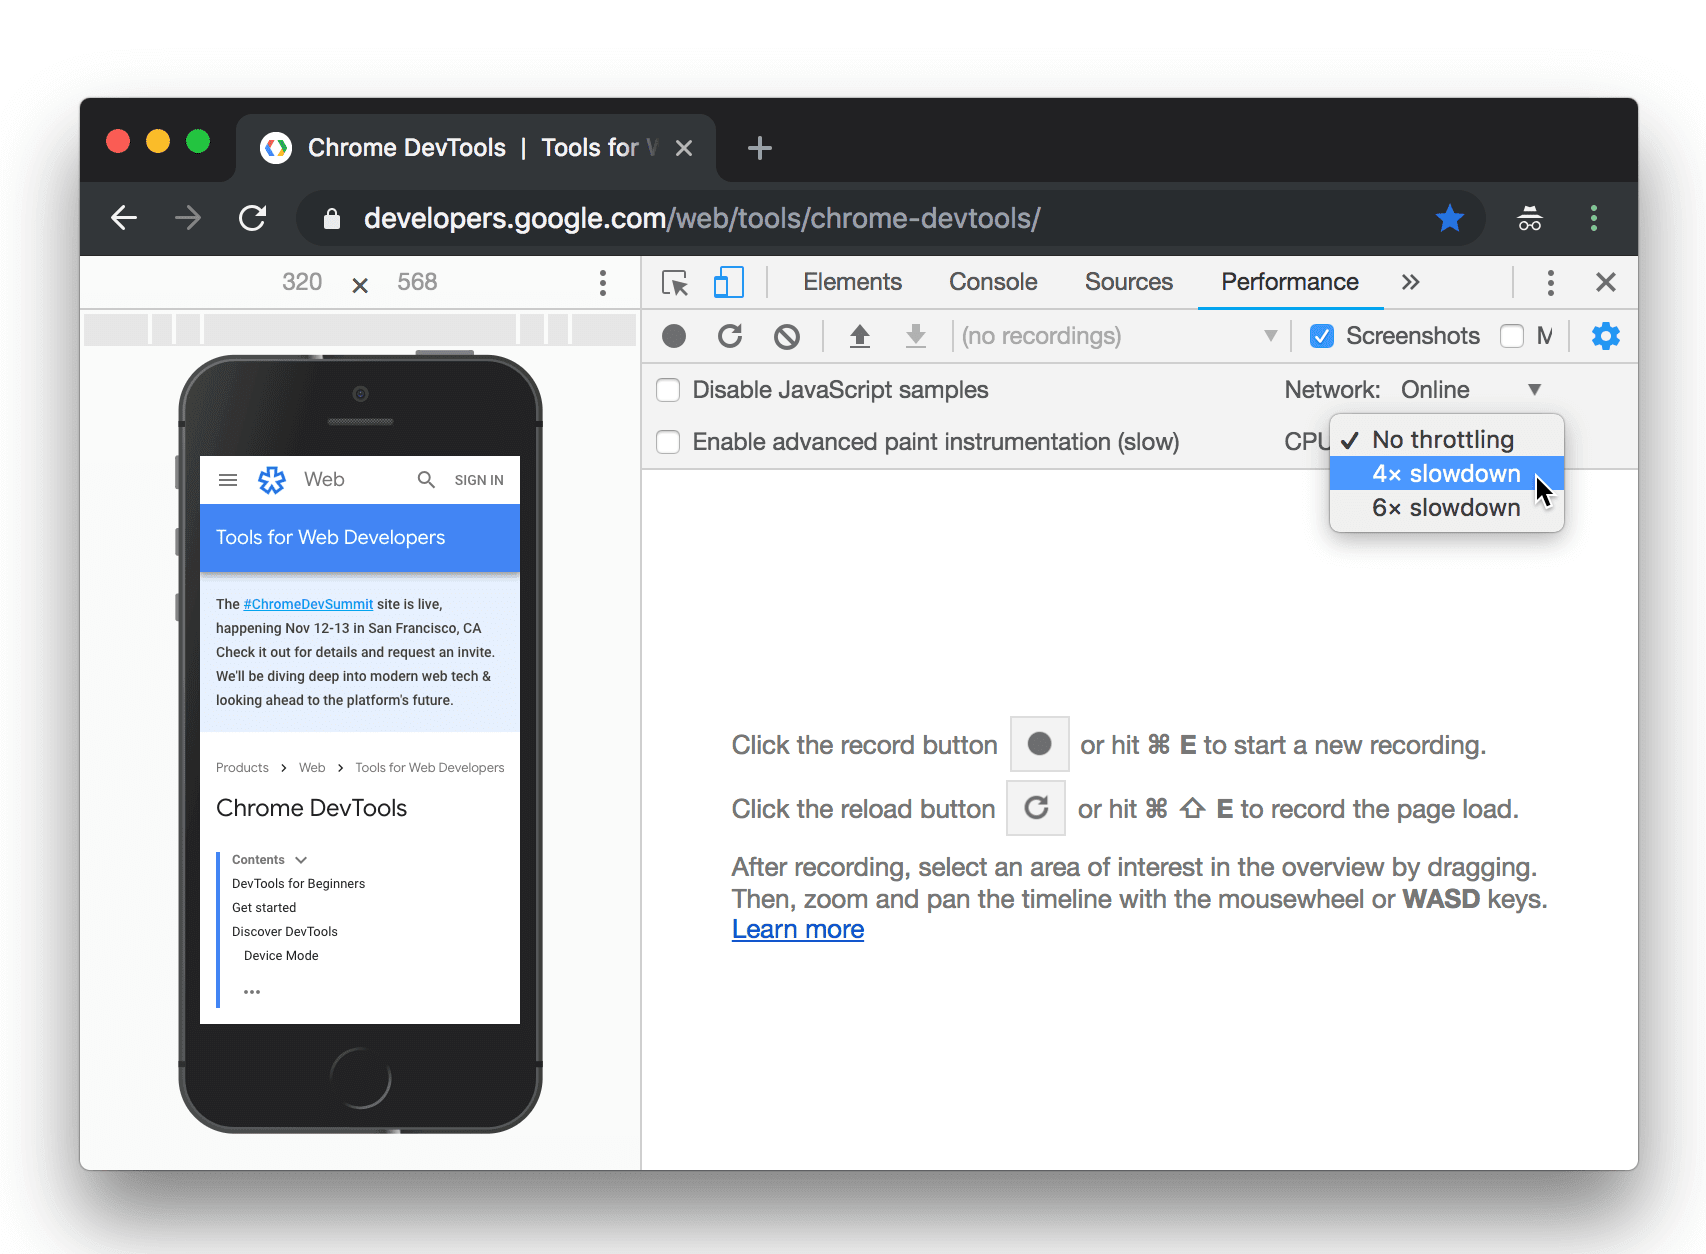
Throttle the network only
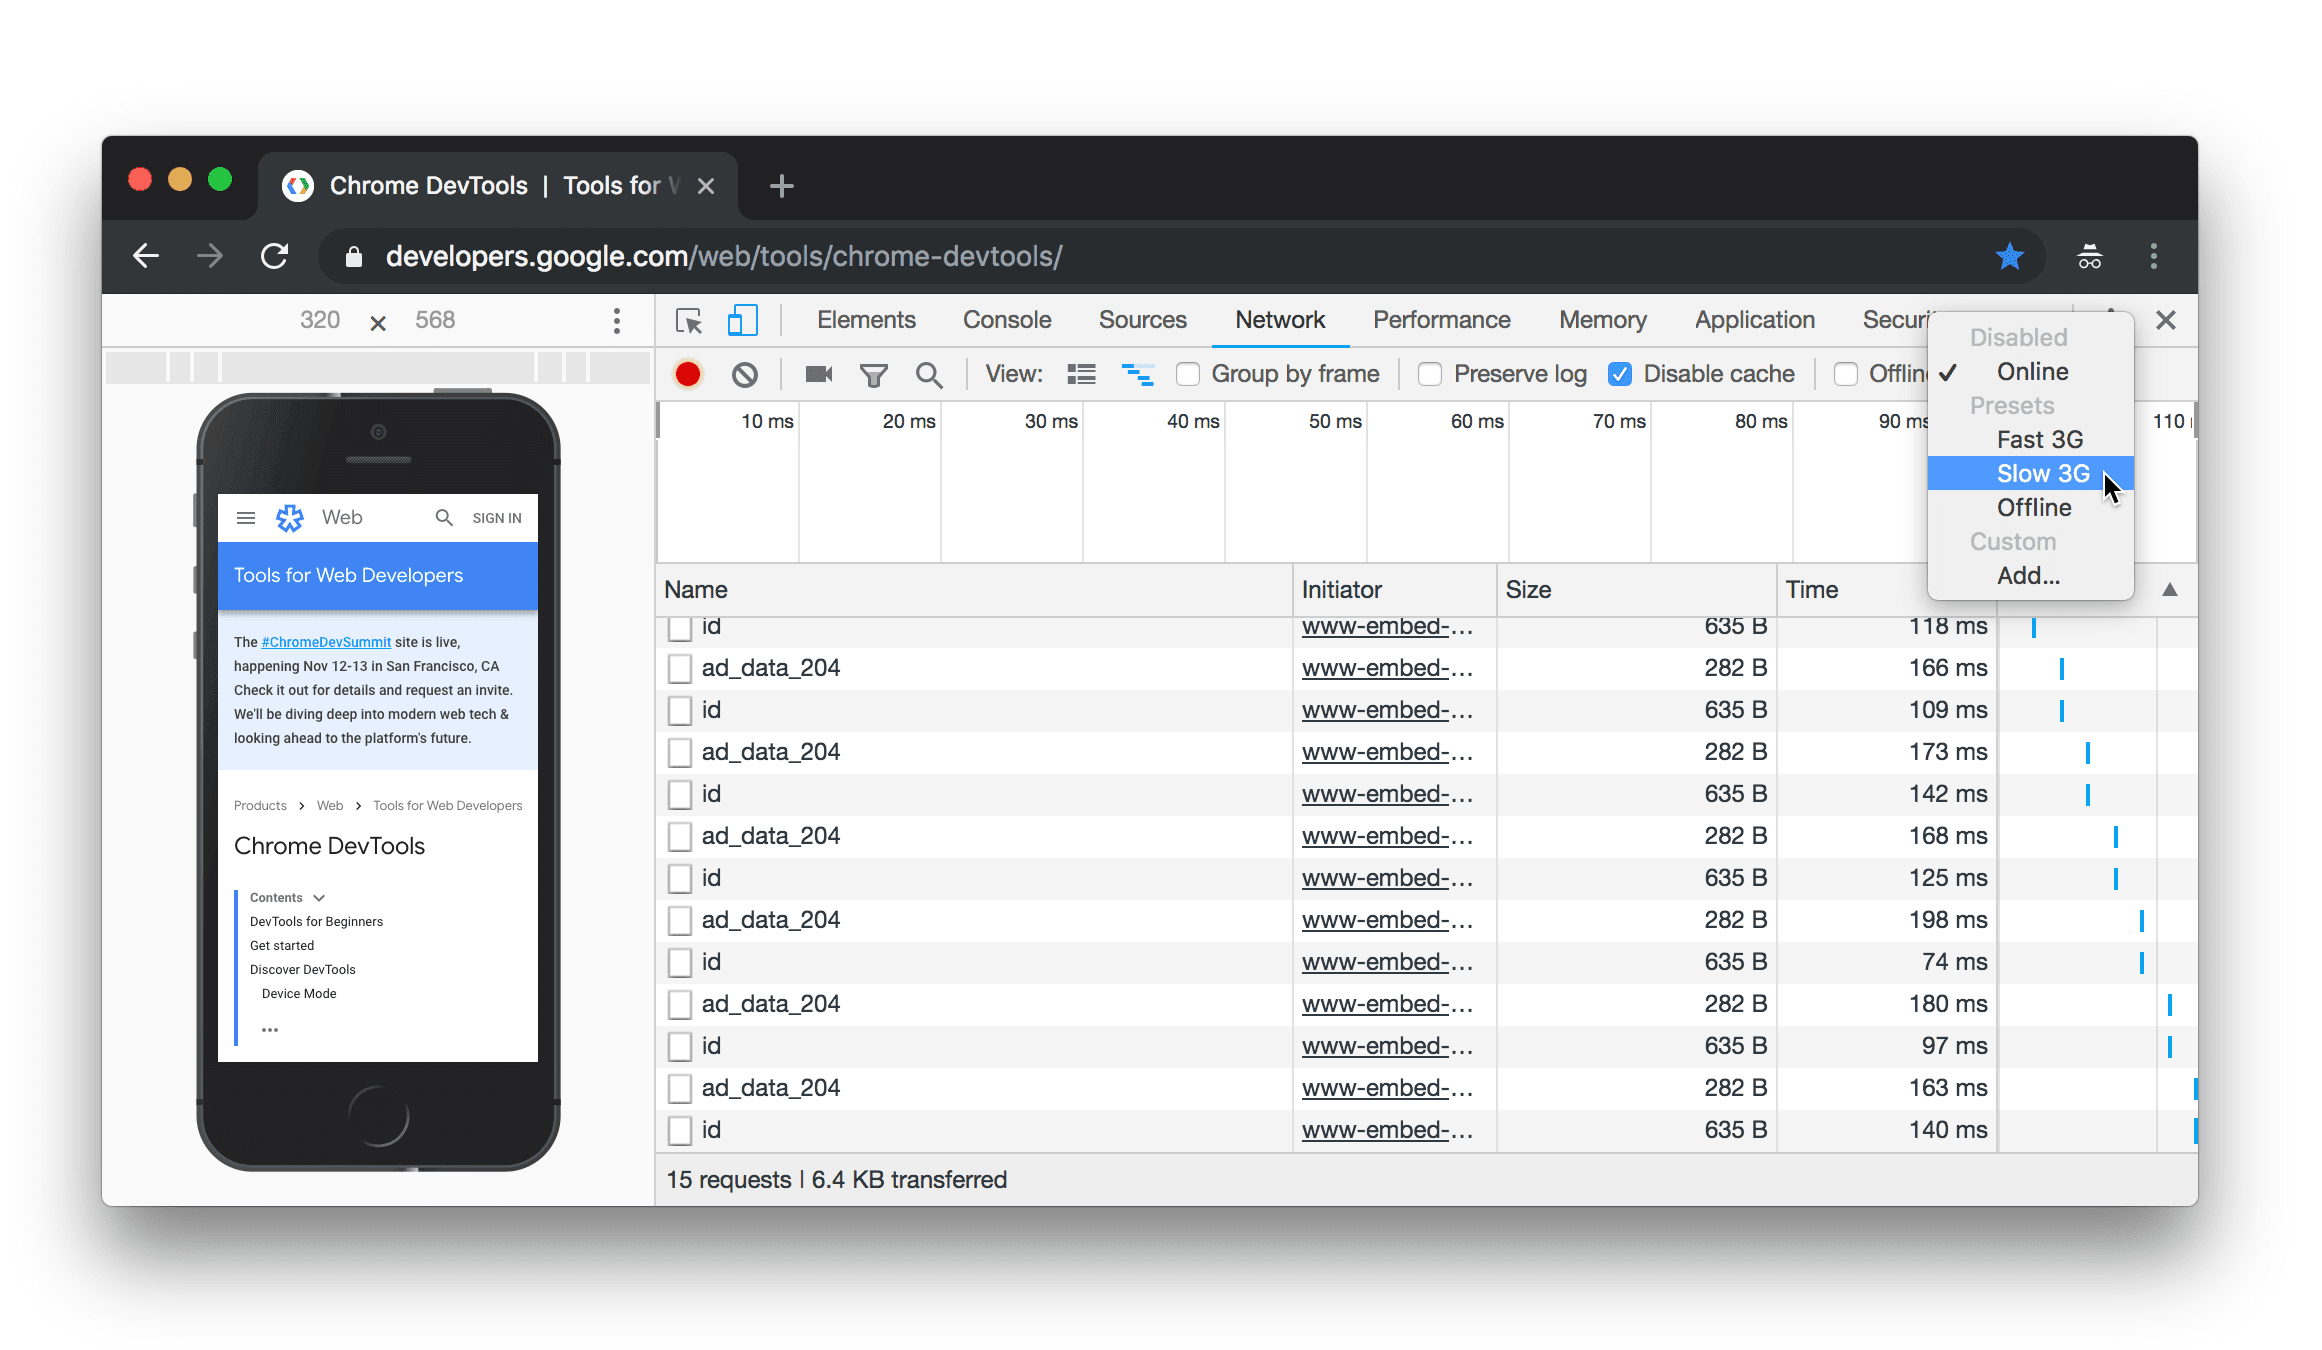
To throttle the network only and not the CPU, go the Network panel and select Fast 3G or Slow 3G from the Throttle list.

Or press Command+Shift+P (Mac) or Control+Shift+P (Windows, Linux, ChromeOS) to open the Command Menu, type 3G , and select Enable fast 3G throttling or Enable slow 3G throttling .

Emulate sensors
Use the Sensors tab to override geolocation, simulate device orientation, force touch, and emulate idle state.
The next sections provide a quick look on how to override geolocation and set device orientation. For a complete list of features, see Emulate device sensors .
Override geolocation

Or press Command+Shift+P (Mac) or Control+Shift+P (Windows, Linux, ChromeOS) to open the Command Menu, type Sensors , and then select Show Sensors .

Select one of the presets from the Location list, or select Other... to enter your own coordinates, or select Location unavailable to test out how your page behaves when geolocation is in an error state.

Set orientation

Select one of the presets from the Orientation list or select Custom orientation to set your own alpha, beta, and gamma values.

Except as otherwise noted, the content of this page is licensed under the Creative Commons Attribution 4.0 License , and code samples are licensed under the Apache 2.0 License . For details, see the Google Developers Site Policies . Java is a registered trademark of Oracle and/or its affiliates.
Last updated 2024-02-20 UTC.
How To Get Developer Tools In Safari

- Software & Applications
- Browsers & Extensions
Introduction
Safari, the sleek and innovative web browser developed by Apple, is known for its user-friendly interface and seamless integration with Apple devices. While Safari offers a smooth browsing experience for users, it also provides powerful tools for web developers to create and optimize websites and web applications. One of the key features that sets Safari apart is its built-in Developer Tools, which offer a comprehensive set of resources for web development and debugging.
Whether you are a seasoned web developer or just starting out, having access to Safari's Developer Tools can significantly enhance your workflow and productivity. These tools enable you to inspect and modify web page elements, debug JavaScript, analyze network activity, and optimize website performance, among other capabilities. By leveraging Safari's Developer Tools, you can gain valuable insights into the structure and behavior of web pages, identify and troubleshoot issues, and fine-tune the performance of your web projects.
In this article, we will delve into the process of enabling and utilizing Safari's Developer Tools for web development. We will explore the various features and functionalities offered by these tools, providing practical insights and tips for leveraging them effectively. Whether you are a web developer, designer, or simply curious about the inner workings of websites, this guide will equip you with the knowledge and skills to harness the full potential of Safari's Developer Tools.
Let's embark on a journey to uncover the hidden gems of Safari's Developer Tools and unlock the power of web development within the confines of this innovative browser . Whether you're seeking to enhance your web development skills or gain a deeper understanding of web technologies, Safari's Developer Tools are your gateway to a world of possibilities. So, without further ado, let's dive into the realm of web development with Safari as our trusted companion.
Enabling Developer Tools in Safari
Enabling Safari's Developer Tools is a straightforward process that unlocks a treasure trove of functionalities for web development. Whether you're a seasoned developer or a curious enthusiast, accessing these tools can significantly enhance your web development experience within the Safari browser .
To enable Developer Tools in Safari, follow these simple steps:
Open Safari Preferences : Launch Safari and navigate to the "Safari" menu located in the top-left corner of the screen. From the drop-down menu, select "Preferences."
Access Advanced Settings : In the Preferences window, click on the "Advanced" tab. This will reveal a set of advanced settings for Safari.
Enable Develop Menu : Within the Advanced tab, locate the option labeled "Show Develop menu in menu bar" and ensure that it is checked. This action activates the Develop menu, which houses a plethora of web development tools and features.
Verify the Development Menu : After enabling the Develop menu, you should see it appear in the menu bar at the top of the screen, alongside other Safari menu options.
Once you have completed these steps, Safari's Developer Tools will be readily accessible, empowering you to delve into the intricacies of web development and gain valuable insights into the structure and behavior of web pages.
By enabling Developer Tools in Safari, you gain access to a suite of powerful resources that can elevate your web development capabilities. From inspecting and modifying web page elements to analyzing network activity and optimizing website performance, Safari's Developer Tools provide a comprehensive toolkit for enhancing your web projects.
With Developer Tools at your fingertips, you are poised to embark on an enriching journey through the realms of web development, armed with the tools and insights needed to create, optimize, and fine-tune captivating web experiences within the Safari browser.
Using Developer Tools for Web Development
Safari's Developer Tools offer a robust set of features and functionalities that empower web developers to streamline their workflows, troubleshoot issues, and optimize web projects. By leveraging these tools, developers can gain valuable insights into the inner workings of web pages and applications, ultimately enhancing the user experience and performance of their creations.
Inspecting and Modifying Web Page Elements
One of the fundamental capabilities of Safari's Developer Tools is the ability to inspect and modify web page elements in real time. By right-clicking on any element within a web page and selecting "Inspect Element," developers can access a detailed view of the HTML and CSS properties associated with that element. This feature is invaluable for understanding the structure and styling of web pages, allowing developers to make on-the-fly adjustments and see the immediate impact on the page layout.
Debugging JavaScript and Analyzing Console Output
Safari's Developer Tools include a robust JavaScript debugger, enabling developers to identify and resolve issues within their JavaScript code. By setting breakpoints, stepping through code, and examining variable values, developers can pinpoint and troubleshoot errors, ultimately improving the functionality and reliability of their web applications. Additionally, the console within Developer Tools provides a space for logging messages, errors, and warnings, offering valuable insights into the runtime behavior of JavaScript code.
Network Analysis and Performance Testing
Another powerful aspect of Safari's Developer Tools is the network panel, which allows developers to analyze network activity and optimize the performance of web pages. By monitoring network requests, loading times, and resource sizes, developers can identify opportunities for optimization, such as minimizing file sizes, leveraging caching strategies, and reducing unnecessary network requests. This capability is instrumental in creating fast and efficient web experiences for users across various devices and network conditions.
Modifying and Testing CSS in Real Time
Safari's Developer Tools provide a seamless environment for modifying and testing CSS styles directly within the browser. Developers can experiment with different styles, colors, and layouts, observing the immediate effects on web page elements. This real-time feedback accelerates the design and development process, allowing developers to fine-tune the visual presentation of their websites with precision and agility.
Leveraging Additional Tools and Resources
In addition to the aforementioned features, Safari's Developer Tools offer a wide array of resources, including the Elements panel for inspecting and editing the DOM, the Application panel for managing web storage and service workers, and the Security panel for identifying potential security vulnerabilities within web applications. These tools collectively provide a comprehensive toolkit for web developers, empowering them to create secure, performant, and visually compelling web experiences.
By harnessing the power of Safari's Developer Tools, web developers can elevate their skills, optimize their workflows, and deliver exceptional web experiences to users. Whether you are fine-tuning the layout of a responsive website, debugging complex JavaScript interactions, or optimizing the performance of a web application, Safari's Developer Tools are your indispensable companions in the journey of web development.
Inspecting and Debugging Web Pages
Inspecting and debugging web pages is a fundamental aspect of web development, and Safari's Developer Tools provide a robust set of features for this purpose. When it comes to understanding the structure and behavior of web pages, as well as identifying and resolving issues, the inspection and debugging capabilities within Safari's Developer Tools are indispensable.
Inspecting Web Page Elements
The ability to inspect web page elements is a cornerstone of Safari's Developer Tools. By right-clicking on any element within a web page and selecting "Inspect Element," developers can access a detailed view of the HTML and CSS properties associated with that element. This feature provides a comprehensive breakdown of the selected element, including its position, dimensions, styling, and any associated event listeners. This level of insight allows developers to gain a deep understanding of the composition and layout of web page elements, facilitating precise modifications and optimizations.
Modifying Web Page Elements in Real Time
In addition to inspecting web page elements, Safari's Developer Tools enable developers to modify elements in real time. By directly editing the HTML and CSS properties of elements within the Elements panel, developers can experiment with different styles, content, and layouts, observing the immediate impact on the web page. This real-time editing capability is invaluable for fine-tuning the visual presentation of web pages and rapidly iterating on design and layout changes.
Safari's Developer Tools include a powerful JavaScript debugger, which allows developers to identify and resolve issues within their JavaScript code. By setting breakpoints, stepping through code, and examining variable values, developers can pinpoint and troubleshoot errors, ultimately improving the functionality and reliability of their web applications. Additionally, the console within Developer Tools provides a space for logging messages, errors, and warnings, offering valuable insights into the runtime behavior of JavaScript code. This feature is instrumental in diagnosing and addressing JavaScript-related issues, ensuring the smooth execution of interactive and dynamic web elements.
In essence, Safari's Developer Tools provide a comprehensive suite of capabilities for inspecting and debugging web pages. From gaining insights into the structure and styling of web page elements to identifying and resolving JavaScript-related issues, these tools empower developers to create, optimize, and fine-tune web experiences with precision and efficiency. By leveraging the inspection and debugging features within Safari's Developer Tools, developers can elevate their skills, streamline their workflows, and deliver exceptional web experiences to users.
Modifying and Testing CSS and JavaScript
Modifying and testing CSS and JavaScript is a crucial aspect of web development, and Safari's Developer Tools offer a seamless environment for making real-time adjustments and testing code changes. Whether you're refining the visual presentation of a website or fine-tuning the functionality of interactive elements, Safari's Developer Tools provide a comprehensive toolkit for working with CSS and JavaScript.
Real-time CSS Modifications
Safari's Developer Tools allow developers to modify CSS styles directly within the browser, providing immediate feedback on the visual appearance of web page elements. By accessing the Styles panel, developers can experiment with different styles, colors, and layouts, observing the instant effects on the web page. This real-time editing capability accelerates the design and development process, enabling developers to iterate on visual enhancements with agility and precision.
Testing JavaScript Code
In addition to CSS modifications, Safari's Developer Tools facilitate the testing and debugging of JavaScript code. The JavaScript debugger within Developer Tools empowers developers to set breakpoints, step through code, and inspect variable values, facilitating the identification and resolution of JavaScript-related issues. By leveraging the debugging capabilities, developers can ensure the reliability and functionality of interactive elements, such as dynamic user interfaces and client-side interactions.
Performance Optimization
Furthermore, Safari's Developer Tools provide insights into the performance of CSS and JavaScript code. Developers can analyze the impact of CSS styles and JavaScript functions on web page loading times and responsiveness, identifying opportunities for optimization. By monitoring the execution of CSS and JavaScript, developers can fine-tune code to enhance the overall performance and user experience of web applications.
In summary, Safari's Developer Tools offer a comprehensive suite of features for modifying and testing CSS and JavaScript. From real-time CSS adjustments to JavaScript debugging and performance optimization, these tools empower developers to create visually compelling and functionally robust web experiences. By harnessing the capabilities within Safari's Developer Tools, developers can refine the presentation and behavior of web pages with precision, ensuring an exceptional user experience across various devices and platforms.
Network analysis and performance testing are critical components of web development, and Safari's Developer Tools provide a robust set of features for evaluating the network activity and optimizing the performance of web pages and applications.
Monitoring Network Activity
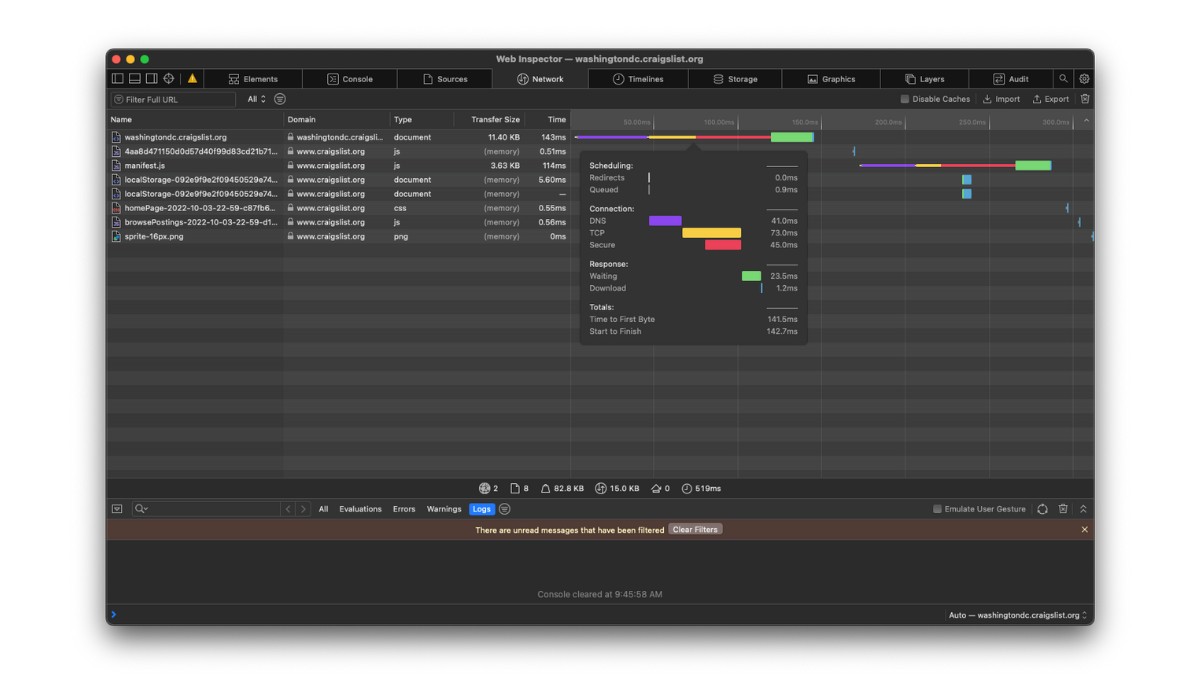
Safari's Developer Tools offer a comprehensive Network panel, which allows developers to monitor and analyze the network activity associated with a web page. This includes tracking network requests, such as HTTP requests for resources like HTML, CSS, JavaScript, images, and other assets. By examining the network waterfall, developers can gain insights into the timing and sequence of network requests, identifying potential bottlenecks and optimizing the loading process.
Resource Size and Loading Times
The Network panel within Safari's Developer Tools provides detailed information about the size and loading times of individual resources. Developers can assess the impact of resource sizes on web page performance, identifying opportunities to optimize assets for faster loading. By analyzing the loading times of resources, developers can prioritize critical content and streamline the delivery of essential assets, ultimately enhancing the overall user experience.
Safari's Developer Tools empower developers to optimize the performance of web pages by identifying and addressing potential performance bottlenecks. By leveraging the insights from the Network panel, developers can implement strategies to minimize file sizes, leverage browser caching, and reduce unnecessary network requests. Additionally, developers can assess the efficiency of third-party integrations and external resources, ensuring that web pages load quickly and responsively across various devices and network conditions.
Network Throttling
One of the standout features of Safari's Developer Tools is the ability to simulate different network conditions using network throttling. Developers can emulate various network environments, such as 3G , 4G, or slower connections, to assess the performance of web pages under different bandwidth constraints. This capability enables developers to optimize web pages for a wide range of network conditions, ensuring a consistent and reliable user experience for diverse audiences.
In essence, Safari's Developer Tools provide a comprehensive suite of capabilities for network analysis and performance testing. By monitoring network activity, assessing resource sizes and loading times, optimizing web page performance, and simulating network conditions, developers can create fast, efficient, and responsive web experiences. Leveraging the insights and tools within Safari's Developer Tools, developers can fine-tune the performance of web pages, ultimately delivering exceptional user experiences in the ever-evolving landscape of the web.
In conclusion, Safari's Developer Tools serve as a gateway to the intricate world of web development, offering a rich array of features and functionalities that empower developers to create, optimize, and fine-tune web experiences with precision and efficiency. By enabling and leveraging these tools, developers gain valuable insights into the structure, behavior, and performance of web pages, ultimately enhancing the user experience and functionality of their web projects.
From inspecting and modifying web page elements to debugging JavaScript, analyzing network activity, and optimizing performance, Safari's Developer Tools provide a comprehensive toolkit for addressing the diverse challenges of web development. The seamless integration of real-time editing, debugging, and performance analysis within the browser environment streamlines the development process, allowing developers to iterate on design and functionality with agility and precision.
Furthermore, the ability to simulate network conditions and assess the impact of resource sizes on web page performance equips developers with the tools needed to create fast, efficient, and responsive web experiences across various devices and network environments. This capability is instrumental in ensuring a consistent and reliable user experience, regardless of the user's location or network conditions.
By harnessing the power of Safari's Developer Tools, developers can elevate their skills, optimize their workflows, and deliver exceptional web experiences to users. Whether it's refining the visual presentation of a website, debugging complex JavaScript interactions, or optimizing the performance of a web application, Safari's Developer Tools are indispensable companions in the journey of web development.
In essence, Safari's Developer Tools not only provide a window into the inner workings of web pages but also empower developers to craft immersive, performant, and visually compelling web experiences. As the web continues to evolve, Safari's Developer Tools stand as a testament to Apple's commitment to providing developers with the resources and capabilities needed to thrive in the dynamic landscape of web development.
In the ever-expanding digital ecosystem, Safari's Developer Tools remain a steadfast ally for developers, offering a robust platform for innovation, creativity, and excellence in web development. Whether you're a seasoned developer or an aspiring enthusiast, Safari's Developer Tools invite you to embark on a journey of discovery and mastery, shaping the future of the web one line of code at a time.
Leave a Reply Cancel reply
Your email address will not be published. Required fields are marked *
Save my name, email, and website in this browser for the next time I comment.
- Crowdfunding
- Cryptocurrency
- Digital Banking
- Digital Payments
- Investments
- Console Gaming
- Mobile Gaming
- VR/AR Gaming
- Gadget Usage
- Gaming Tips
- Online Safety
- Software Tutorials
- Tech Setup & Troubleshooting
- Buyer’s Guides
- Comparative Analysis
- Gadget Reviews
- Service Reviews
- Software Reviews
- Mobile Devices
- PCs & Laptops
- Smart Home Gadgets
- Content Creation Tools
- Digital Photography
- Video & Music Streaming
- Online Security
- Online Services
- Web Hosting
- WiFi & Ethernet
- Browsers & Extensions
- Communication Platforms
- Operating Systems
- Productivity Tools
- AI & Machine Learning
- Cybersecurity
- Emerging Tech
- IoT & Smart Devices
- Virtual & Augmented Reality
- Latest News
- AI Developments
- Fintech Updates
- Gaming News
- New Product Launches
- AI Writing How Its Changing the Way We Create Content
- How to Find the Best Midjourney Alternative in 2024 A Guide to AI Anime Generators
Related Post
Ai writing: how it’s changing the way we create content, unleashing young geniuses: how lingokids makes learning a blast, 10 best ai math solvers for instant homework solutions, 10 best ai homework helper tools to get instant homework help, 10 best ai humanizers to humanize ai text with ease, sla network: benefits, advantages, satisfaction of both parties to the contract, related posts.

How To Inspect On IPhone Safari

How To Install Safari On Apple TV 4
How To Get Safari Back To Normal

How To Download Video On Safari
How To Debug In Safari
How To Reset Safari 9.0
Why Does Safari Not Work On My Mac

How To Block YouTube Ads On Safari
Recent stories.

How to Find the Best Midjourney Alternative in 2024: A Guide to AI Anime Generators

How to Know When it’s the Right Time to Buy Bitcoin

How to Sell Counter-Strike 2 Skins Instantly? A Comprehensive Guide

10 Proven Ways For Online Gamers To Avoid Cyber Attacks And Scams

- Privacy Overview
- Strictly Necessary Cookies
This website uses cookies so that we can provide you with the best user experience possible. Cookie information is stored in your browser and performs functions such as recognising you when you return to our website and helping our team to understand which sections of the website you find most interesting and useful.
Strictly Necessary Cookie should be enabled at all times so that we can save your preferences for cookie settings.
If you disable this cookie, we will not be able to save your preferences. This means that every time you visit this website you will need to enable or disable cookies again.
Apple touts major 60% leap in Safari and WebKit performance
Apple’s WebKit team has published a new blog post this week detailing how they’ve made significant upgrades to Safari’s performance over the last several months. The improvements come following the debut of Speedometer 3.0 in March, described as a “major step forward in making the web faster for all.”
Back in March, Apple, Google, and Mozilla teamed up to launch the new Speedometer 3 browser benchmark. The goal of Speedometer 3 is to “create a shared understanding of web performance so that improvements can be made to enhance the user experience.”
The results provided by Speedometer 3 offer more details on how the test “captures and calculates scores, show more detailed results and introduce an even wider variety of workloads.” Apple says:
The introduction of Speedometer 3.0 is a major step forward in making the web faster for all, and allowing Web developers to make websites and web apps that were not previously possible.
Apple’s WebKit team says that it has successfully improved Safari’s Speedometer 3.0 score by ~60% between the release of Safari 17.0 in September and Safari 17.4’s release in March. These improvements, Apple says, mean that developers can build websites and web apps that are faster than ever before:
With all these optimizations and dozens more, we were able to improve the overall Speedometer 3.0 score by ~60% between Safari 17.0 and Safari 17.4. Even though individual progressions were often less than 1%, over time, they all stacked up together to make a big difference. Because some of these optimizations also benefited Speedometer 2.1, Safari 17.4 is also ~13% faster than Safari 17.0 on Speedometer 2.1. We’re thrilled to deliver these performance improvements to our users allowing web developers to build websites and web apps that are more responsive and snappier than ever.
The full blog post has a ton of technical details on the work that has been done to optimize WebKit and Safari for Speedometer 3.0.
Follow Chance : Threads , Twitter , Instagram , and Mastodon .
FTC: We use income earning auto affiliate links. More.
Check out 9to5Mac on YouTube for more Apple news:

Chance is an editor for the entire 9to5 network and covers the latest Apple news for 9to5Mac.
Tips, questions, typos to [email protected]

IMAGES
VIDEO
COMMENTS
To access the Responsive Design Mode, enable the Safari Develop menu. Follow the steps below to enable the Develop menu: Launch Safari browser. Click on Safari -> Settings -> Advanced. Select the checkbox -> Show Develop menu in menu bar. Once the Develop menu is enabled, it'll show up in the menu bar as shown in the image below: Note ...
From the main menu go to Safari > Preferences (or use the CMD + , keyboard shortcut.) Go to the Advanced tab. Check "Show Developer menu in menu bar" Open the Safari Developer Console. Now open the developer console in responsive mode by going to the menu and selecting Develop > Enter Responsive Design Mode: Alternatively, use the keyboard ...
Overview. Safari includes features and tools to help you inspect, debug, and test web content in Safari, in other apps, and on other devices including iPhone, iPad, Apple Vision Pro, as well as Apple TV for inspecting JavaScript and TVML. Features like Web Inspector in Safari on macOS let you inspect and experiment with the layout of your ...
Step 1- Open Developer Tools in Safari. To open the Developer Tools, follow these simple steps-. With Safari open, click on the "Develop" menu in the menu bar. In the dropdown menu, select 'Show Web Inspector' or use the keyboard shortcut- Cmd + Option + I (Mac) or Ctrl + Shift + I (Windows, if using an older version of Safari).
Web development tools. Apple has brought its expertise in development tools to the web. Safari includes Web Inspector, a powerful tool that makes it easy to modify, debug, and optimize websites for peak performance and compatibility on both platforms. And with Responsive Design Mode, you can preview your web pages in various screen sizes ...
Now follow the steps below to view the mobile version of a web page using Safari DevTools: Launch Safari and navigate to the desired URL that needs to be loaded in mobile view. Click on the Develop menu and select Enter Responsive Design Mode. Now the target URL (Wikipedia in this example) can be viewed in the desired iPhone or iPad.
Opening Responsive Design Mode. While focused on the webpage you want to test in Responsive Design Mode, choose Enter Responsive Design Mode (⌃⌘R) from the Develop menu. Tip. You can use Responsive Design Mode with Web Inspector to debug your page's layout while resizing the page in Responsive Design Mode.
If you're a web developer, the Safari Develop menu provides tools you can use to make sure your website works well with all standards-based web browsers. If you don't see the Develop menu in the menu bar, choose Safari > Preferences, click Advanced, then select "Show Develop menu in menu bar.". See also Safari for Developers.
To open the Safari Developer Tools, right-click on Inspect and start debugging. You can leverage other built-in features offered by LambdaTest, like geolocation testing, uploading files, accessibility, and much more. Using Safari, you can use the Responsive Design Mode while debugging your websites on LambdaTest.
Activate Web Inspector on iOS: Go to Settings > Safari > Advanced and move the Web Inspector toggle switch to the On position. Use Web Inspector on macOS: Connect your iOS device to a Mac and choose the URL to inspect from the Develop menu. If you run into a bug or another issue with a website on Safari mobile, use the Web Inspector tool to ...
Chrome and Edge: You need to have "Developer Tools" open first: In Windows/Linux, press Ctrl + Shift + I or just F12. In macOS, press option + command + I. Once developer tools is open and focused, you can toggle device emulation: In Windows/Linux, press Ctrl + Shift + M. In macOS, press command + shift + M.
Once the Safari console is open, you can now see the interaction between the console and the DOM on your mobile web browser. You can see that it works similarly to the Chrome Console. When you open the inspector and hover over an HTML element, that element will be highlighted in the DOM.
There are two ways to inspect an element in Safari Developer Tools: In the browser window, right-click on any element and select 'Inspect Element'. In the menu toolbar, select Develop > Show Web Inspector (or use the keyboard shortcut Option-Command-I ). This will display the current DOM of the page.
Open Safari on your Mac and click the "Safari" button in the menu bar. Next, select "Preferences." Alternatively, you can use the keyboard shortcut Command+, (comma). This will also open up Safari preferences. Go to the "Advanced" tab. Check the box for "Show Develop Menu in Menu Bar." Now the Develop menu will appear between Bookmarks and ...
To enable the Safari development mode, follow the steps listed below: Launch the Safari browser. Click Safari -> Preferences -> Advanced. Select the checkbox -> Show Develop menu in the menu bar. Once the Develop menu is enabled, 'Enter Responsive Design Mode' will show up in the menu bar, as shown in the image below:
Disable site-specific hacks. On rare occasions, when a particular website does not work correctly in Safari, modifications are made in browser code to get that site to work. This setting disables such modifications to make it possible for the site's developers to debug their problem. If there are no site-specific hacks, this setting has no ...
Its integrated developer tools provide everything web developers need to build, debug and optimize websites for Apple's ecosystem. In this comprehensive tutorial, we'll cover key capabilities of Safari's dev tools including: The Web Inspector for inspecting page structure and CSS. The Debugger for stepping through JavaScript code.
Activating Safari Developer Mode requires a few simple steps: Activate Safari Developer Mode: Open Settings> Advanced in Safari, then tick "Show Develop in Menu bar". openning safari settings. open advanced. Develop menu. Open the Web Inspector: Go to Develop, click on "Show Web Inspector.".
Access the "Develop" Menu: Click on the "Develop" option in the menu bar. If you don't see the "Develop" menu, you may need to enable it first. To do this, go to "Safari" > "Preferences" > "Advanced" and check the box next to "Show Develop menu in menu bar." Open Developer Tools: Once you have accessed the "Develop" menu, you will find a list ...
Add a custom mobile device. To add a custom device: Click the Device list and then select Edit. On the Settings > Devices tab, either choose a device from the list of supported ones or click Add custom device to add your own. If you're adding your own, enter a name, width, and height for the device, then click Add.
To enable Developer Tools in Safari, follow these simple steps: Open Safari Preferences: Launch Safari and navigate to the "Safari" menu located in the top-left corner of the screen. From the drop-down menu, select "Preferences." Access Advanced Settings: In the Preferences window, click on the "Advanced" tab.
Overview. The Develop menu is home to the tools available to design and develop web content in Safari, as well as web content used by other applications on your Mac and other devices. The Develop menu also provides quick access to Changing Developer settings in Safari on macOS and Changing Feature Flag settings in Safari on macOS.. Note. If you haven't already enabled features for web ...
Apple's WebKit team says that it has successfully improved Safari's Speedometer 3.0 score by ~60% between the release of Safari 17.0 in September and Safari 17.4's release in March.