
- Vancouver, BC
- Be a Patreon

Support Jun
- StackOverflow
- Custom Social Profile Link
How to inspect request and response headers on Safari?
January 03, 2019 1 minute read
Learn how to inspect request and response headers on Safari.
1. Enable Developer Mode
On Safari, first, you have to enable Develop Menu.
- Click Safari button on top left corner.
- Open up Safari preferences.
- Select Advanced tab.
- Check ‘Show Develop menu in menu bar’.

2. Open up Safari Web Inspector
You can open by Safari Web Inspector by selecting Develop menu and click Show Web Inspector button.

3. Open up Network tab
With web inspector opened,
- Navigate to Network tab and you can see the files requested over network.
- Select one of the requested items and go to its Headers item.
- You can see the following image showing Summary, Request and Response sections.

4. Refresh the page
- Refresh the page by using the refresh button next to the address bar.
- Network Request and Response Headers will be listed.

Mac Shorcuts / Hotkeys
You would be more productive if you know the shorcuts to the above steps. When you are familiar with the shortcut keys, you can speed up and use your time on developing and solving problems.
Shortcuts or hotkeys to inspect network requests and responses on Safari:
With this, you can inspect your network requests and responses on Safari.
Support Jun on Amazon Canada
If you are preparing for Software Engineer interviews, I suggest Elements of Programming Interviews in Java for algorithm practice. Good luck!
You can also support me by following me on Medium or Twitter .
Feel free to contact me if you have any questions.
You May Also Like
Add aws lambda layers to a lambda function using aws sam.
December 06, 2019 1 minute read
Learn how to attach a Lambda Layer to a Lambda Function using AWS SAM (Serverless Application Model) and AWS console.
Create AWS Lambda Layers Using AWS SAM
December 05, 2019 3 minute read
Learn how to create a Lambda Layer using AWS SAM (Serverless Application Model) and CloudFormation in YAML to reuse code, write zero redundant code and reduce Lambda deployment size.
Best Exchange Rate and Cheapest International Wire Transfer Service
November 21, 2019 5 minute read
Ever feel that it costs quite a bit to send money overseas. Check out this service and save money on your next international wire transfer.
Upgrade AWS SAM CLI using Homebrew
October 18, 2019 1 minute read
Learn how to upgrade your AWS SAM CLI using Homebrew.
- Web Browser
- Google Chrome Browser
- Mozilla Firefox Browser
- Microsoft Edge Browser
- Apple Safari Browser
- Tor Browser
- Opera Browser
- DuckDuckGo Browser
- Brave Browser
- Basic and advance shortcut keys in Apple Safari Browser
- Hidden tricks inside Apple Safari Browser
- Bookmark in Apple Safari Browser
- Architecture of Apple Safari Browser
- Apple to Launch Search Engine to Rival Google
Safari for Developement
- DevTools in Apple Safari Browser
- Developer Mode in Safari Browser
- Debugger In Apple Safari Browser
Safari Tabs
- Console Tab in Safari Browser
- Sources Tab in Apple Safari Browser
- Storage Tab in Apple Safari Browser
- Elements Tab in Apple Safari Browser
Network Tab in Apple Safari Browser
- Web Capture Tabs in Apple Safari Browser
How to .. in Safari
- How to enable or disable split view in Apple Safari Browser ?
- How to disable or enable auto-play videos in Apple Safari Browser ?
- How to Allow Pop-Ups in Safari?
- How to use Safari for web development
- How to use inspect element in Chrome, Firefox and Safari ?
- How to Browse in Apple Safari Browser ?
The Safari network tab acts as a valuable developer tool designed to help web architects, designers, and people eager to uncover the complexities of loading a web web page and interacting with servers It’s a thing that is required in the Safari Developer Tools Suite, a number of applications in order to facilitate debugging and enhancing net pages for
In the Network Tab, the Internet page benefits from a function that monitors local activity and is thoroughly analyzed for a set period of time. This function provides useful insights on many things, such as retrieved content, the time needed to complete each useful input, the overall performance of the web page and this data store that is critical to tracking optimal website performance, finding capacity issues and enjoying passive customers.
Overview of Network Tab:
The Network tab in Safari serves the primary purpose of managing network requests from the web browser. While Safari does not categorize its Network Tabs into specific categories, the information it provides can be broken down into several main sections:
- Requests: In this section, you will find a detailed list of all network requests initiated by the network. Each request is presented as a row in the tab, providing important information such as the request method (e.g., GET, POST), URL of the object, status code, and size
- Period: Time lets you carefully allocate the time needed for each network request to complete. This partitioning includes various factors such as DNS resolution time, connection establishment, and duration of request and response. These moments prove invaluable in identifying complications in packaging.
- Title: Headers as shown in this section specify the request and response headers associated with each network request. This feature is especially handy when troubleshooting headers, such as those with Cross-Origin Resource Sharing (CORS).
- Example View: The Preview tab allows users to directly browse the content of specific objects, including HTML, CSS, JavaScript, or JSON, right in the Network tab. This functionality proves to be very helpful in managing the content of the response quickly.
- Founded by: The initiator column provides insight into what triggers a particular web request. This trigger can be a user action, such as clicking on a link or button, or from the execution of the script that initiated the request.
The Network tab in Safari offers a whole lot of precious functions for internet builders and architects. Let’s take a more in-depth look at a number of its key roles
- Real-time monitoring: The Network tab gives an in-flight view of community hobbies. As the net page loads, it presents the requests which have been submitted and the corresponding responses. This characteristic helps loads in identifying issues and optimizing performance in real-time.
- Filtering and Sorting: This tool lets you customise and configure network requests primarily based on criteria inclusive of request type, reputation code, domain, and greater. This function simplifies the process of figuring out precise requests that require your interest.
- Ask questions about: For each community request, you’ll have get admission to to special information, along with request reaction headers, timeouts, and reaction content material. This stage of detail is essential for trouble solving and product improvement.
- Initiator Series: The Initiator Chain function enables you recognize the foundation reason of a selected community request. It is particularly useful to know where sudden or undesirable requests have happened.
- Throttle and Performance Analysis: Safari’s Network tab allows you to simulate exclusive community situations to see how your network performs below distinctive conditions, consisting of gradual 3G or speedy 4G, an vital ability so as to flex to one-of-a-kind network connections They’ve been watching them meet
- HAR exports: You have the capability to export community facts in HAR (HTTP Archive) format, that’s the default format for writing HTTP offerings. This function proves beneficial for sharing net records with friends or other analytics using external tools.
The Safari Network tab gives many treasured benefits for web developers and architects:
- Increased productiveness: One of its fundamental benefits is its potential to reveal network requests and uptime. This characteristic lets in you to become aware of bottlenecks and first-class song resource loads, in the long run ensuing in faster web page load instances and an advanced person experience
- Debugging functions: The Network tab goes beyond page-degree facts, supplying specified insights into community requests, header chains, and trigger chains. This depth makes it an vital tool for troubleshooting community connectivity, inputs, and server connectivity.
- Troubleshooting CORS Problems: Where networks request assets from distinctive assets, CORS-associated demanding situations may get up. Network Tab involves the rescue through enabling you to discover and remedy those problems by means of scrutinizing the request reaction headers.
- Improves the consumer experience: After all, optimizing the community without delay affects the overall person revel in. By leveraging the power of the Network Tab, you may ensure that your web pages load faster and less complicated, reducing bounce prices and growing consumer engagement
When to Use?
The Network Tab in Safari acts as a multitasking tool with many applications. Here are guidelines on when and how to use them effectively:
Correct page loading:
- Use the Network Tab to test the loading of your websites.
- Identify any slow drivers, redundant files, or unnecessary requests.
- Make necessary optimizations to enhance the user experience and to ensure fast and smooth loading time.
Troubleshooting network issues:
- When your web browser encounters network-related errors such as failed requests or unexpected actions, the Network tab becomes your troubleshooting partner.
- Analyze the request header, response status, and timer to identify and resolve the underlying problem.
Testing on networks:
- Use throttling features to simulate network conditions.
- This allows you to measure the performance of your web page under different network speeds, assuring that it performs well for users with different levels of connectivity.
CORS information search:
- Where your network starts making requests for a particular zone and runs into CORS (Cross-Origin Resource Sharing) problems, go to the Network Tab.
- Here, you can monitor request and response headers, gaining insights to help understand and resolve cross-origin issues.
Third party content management:
- If your web application relies on external resources such as APIs or external scripts, carefully monitor their loading behavior using the Network tab.
- Ensure that these items load properly and do not cause performance issues that could hamper the overall performance of your website.
Steps to use Network Tab in Safari:
Here are the steps to use the Network Tab in Safari with images and pictures:
Step 1: Open Safari Developer Tools
First, go to Safari Developer Tools on your Mac to start things off. Here’s how you can do it:
- Launch Safari on your Mac.
- Go to the Safari menu, which can be found in the top left corner of your screen.
- Select “Preferences”/”Settings…” from the drop down menu.
- Go to the “Advanced” tab in the Preferences window.
- Look for the “Show Develop menu in the menu bar” option and make sure it is enabled. This is necessary to get developer tools.

Step 2: Open the website you want to manage
Now, it’s time to determine which network you want to monitor using the Network Tab. Make sure the web page loads completely before proceeding to the next step.
Step 3: Go to the Network Tab
Let’s go to the Network Tab. Follow these steps:
- Click on the “Develop” menu in the Safari menu bar at the top of your screen.
- A dropdown menu will appear. Select “Connect Web Inspector”/”Show Web Inspector” from this menu.

Step 4: Go to the Network Tab
Once you’re done with the Web Inspector, you’re almost there. Here’s what happens next:
- In the Web Inspector screen that appears, note the navigation tabs at the top.
- Click on the one labeled “Network” to go to the Network Tab.

Step 5: Monitor Network Activity
Now that you are in the Network Tab, you will see network requests and other useful information. This is where you can start viewing web activity while the web browser is running.

Step 6: Analyze Requests and Resources
This is where the real magic happens. You can explore network requests in more detail:
- Click on individual web requests to see the subject, time, and content previews of the requests and responses.
- Use filtering and sorting options to focus on specific requests or business issues.

Example Showing Usage
Let’s use a actual-international scenario to illustrate a way to efficiently use Safari’s Network tab. Imagine you are an internet developer tasked with enhancing the capability of a internet site. Large photo documents are thought to be responsible for slower web page loads. Here is how you could use the Network Tab to diagnose and remedy this trouble:
Step 1: Get Safari Developer Tools
As noted earlier, visit Safari Developer Tools and launch the Network Tab.
Step 2: Load the Website
Go to the specific website you need to search. For this demonstration, we can use the GFG internet site.
Step 3: Monitor Network Requests
Notice how the Network Tab populates network requests as the website masses. These requests will consist of diverse elements consisting of HTML, CSS, JavaScript, and pics.
Step 4: Determine photograph file sizes
Use the Network Tab to manage requests by way of length, that specialize in those large picture files that make contributions to sluggish page load times
Step 5: Optimize Image Loading
Once you have got identified these big image documents, paintings on growing their weight. You can do that by means of clicking on pictures, using responsive graphics strategies, or applying lazy-weighting to the photographs at the lowest of the preview location of the internet page
Step 6: Confirm the performance development
Reload the web browser and take a look at the Network Tab once more. You ought to observe a lower in photograph loading time and an overall development in internet browser loading velocity.
In this situation, Safari’s Network tab played a key role in solving the overall performance challenges related to picture loading. This empowered you to enforce features that considerably advanced the overall performance of the website.
In precis, Safari’s Network tab stands as a versatile and powerful device, presenting precious insights into web web page loading and community connectivity. Whether your goal is to enhance internet site overall performance, edit network problems, or look for CORS data, the community tab is an important partner for web developers and architects Through its potential to implement the steps mentioned on this manual in addition you may assure a web web page that performs well and offers an extraordinary consumer experience.
Please Login to comment...
Similar reads.
- Apple Safari
- Geeks Premier League 2023
- Geeks Premier League
- Web Browsers

Improve your Coding Skills with Practice
What kind of Experience do you want to share?
How To Use Inspect In Safari

- Software & Applications
- Browsers & Extensions

Introduction
Safari, Apple's widely used web browser, offers a powerful tool known as the Inspector, which allows users to delve into the inner workings of web pages. Whether you're a web developer, designer, or simply a curious user, the Inspector can provide valuable insights into the structure, layout, and functionality of websites. By understanding how to use the Inspector effectively, you can gain a deeper understanding of web development and design, and even troubleshoot issues that may arise while browsing the web.
In this article, we will explore the various features of the Inspector in Safari, guiding you through its different tabs and demonstrating how each can be utilized to analyze and manipulate web content. From inspecting and modifying HTML elements to examining network activity and debugging JavaScript, the Inspector offers a wide array of tools to aid in understanding and enhancing the web browsing experience.
Whether you're looking to customize the appearance of a webpage, optimize its performance, or gain insights into its underlying code, the Inspector in Safari is a versatile and indispensable tool. By the end of this article, you will have a comprehensive understanding of how to leverage the Inspector to gain valuable insights into web development and design, empowering you to make the most of your browsing experience.
Opening the Inspector
To begin exploring the powerful capabilities of the Inspector in Safari, you first need to open it. There are several ways to access the Inspector, each providing quick and convenient access to its robust features.
Using the Menu Bar
One of the simplest methods to open the Inspector is through the Safari menu bar. By navigating to the "Develop" menu and selecting "Show Web Inspector," you can swiftly launch the Inspector, ready to delve into the inner workings of any webpage.
Keyboard Shortcuts
For those who prefer to streamline their workflow with keyboard shortcuts, Safari offers a quick and efficient way to open the Inspector. By pressing "Option + Command + I" on a Mac, or "Ctrl + Option + I" on a Windows PC , you can instantly access the Inspector, saving valuable time and effort.
Right-Click Context Menu
Another convenient way to open the Inspector is by right-clicking on any element within a webpage and selecting "Inspect Element" from the context menu. This method allows for immediate inspection of specific elements, making it ideal for targeted analysis and modification.
Using the Address Bar
Safari also provides a direct method to open the Inspector by entering a special command in the address bar. By typing "inspect" or "inspector://" followed by the Enter key, the Inspector will promptly appear, ready for exploration.
Docked Inspector
Once the Inspector is open, it can be docked to the bottom, right, or left of the browser window, providing a customizable layout that suits your preferences. This feature allows for seamless multitasking, as you can simultaneously view the Inspector and the webpage, making it easier to analyze and modify elements in real-time.
By familiarizing yourself with these various methods to open the Inspector, you can seamlessly integrate its powerful capabilities into your web browsing and development workflow. With the Inspector readily accessible, you are well-equipped to embark on a journey of exploration and discovery within the intricate world of web development and design.
Elements Tab
The Elements tab within the Inspector in Safari serves as a gateway to the underlying structure of a web page. Upon opening the Inspector and navigating to the Elements tab, you are presented with a visual representation of the Document Object Model (DOM) of the current webpage. This hierarchical view allows you to inspect and manipulate various elements, providing valuable insights into the composition and layout of the page.
Understanding the DOM Tree
At the core of the Elements tab lies the DOM tree, which organizes the HTML elements of the webpage in a nested structure. Each HTML element, such as headings, paragraphs, images, and more, is represented as a node within the tree. By expanding and collapsing nodes, you can navigate through the DOM tree to locate specific elements and understand their relationships to one another.
Inspecting Elements
The Inspector empowers you to inspect individual elements within the DOM, revealing a wealth of information about each element. By hovering over elements in the Inspector or on the webpage itself, you can visually highlight the corresponding elements, making it easier to identify and select specific components for further analysis.
Modifying Attributes and Styles
One of the most powerful features of the Elements tab is the ability to modify attributes and styles of HTML elements in real-time. By double-clicking on an element's attributes or styles, you can directly edit them within the Inspector, instantly observing the visual changes on the webpage. This dynamic editing capability is invaluable for experimenting with different design and layout modifications without altering the actual source code.
Event Listeners
In addition to visual and structural inspection, the Elements tab provides insights into event listeners attached to various elements. This feature is particularly useful for understanding the interactivity and functionality of a webpage, as it allows you to view and manage event listeners associated with specific elements.
Accessibility and Validation
Furthermore, the Inspector in Safari includes accessibility and validation tools within the Elements tab, enabling you to assess the accessibility of elements and validate the HTML structure for compliance with web standards. This functionality is essential for ensuring that web content is accessible to all users and adheres to best practices in web development.
By mastering the Elements tab in the Inspector, you gain the ability to dissect and manipulate the building blocks of web pages, fostering a deeper understanding of web development and design. Whether you're fine-tuning the layout, debugging issues, or optimizing accessibility, the Elements tab equips you with the tools to navigate the intricate web of HTML elements with confidence and precision.
The Styles tab, a pivotal component of the Inspector in Safari, serves as a gateway to the visual presentation and styling of a web page. Upon navigating to the Styles tab within the Inspector, you are greeted with a comprehensive overview of the CSS (Cascading Style Sheets) rules that define the appearance and layout of the current webpage. This powerful tool provides invaluable insights into the styling hierarchy, inheritance, and applied styles, empowering you to analyze, modify, and optimize the visual aspects of web content.
Comprehending the Style Rules
At the heart of the Styles tab lies a detailed display of CSS rules that dictate the appearance of elements on the webpage. Each rule encompasses selectors, properties, and values, collectively shaping the visual presentation of the content. By examining these rules, you can gain a profound understanding of how styles are applied and inherited throughout the DOM, unraveling the intricacies of the cascading nature of CSS.
Visualizing Box Model and Layout
The Styles tab offers a visual representation of the box model for selected elements, illustrating the dimensions, padding, borders, and margins that define the layout of each element. This feature provides a clear and intuitive depiction of the spatial attributes of elements, facilitating precise adjustments to the layout and spacing without the need to decipher complex CSS code.
Modifying Styles in Real-Time
One of the most compelling capabilities of the Styles tab is the ability to modify CSS styles directly within the Inspector, observing instantaneous visual updates on the webpage. By clicking on individual style properties, you can alter their values, experiment with different design variations, and witness the immediate impact on the layout and appearance of the content. This dynamic editing functionality empowers you to fine-tune the visual presentation of web pages with unparalleled efficiency and precision.
Understanding Computed Styles
In addition to the explicit CSS rules, the Styles tab provides insights into the computed styles of elements, revealing the final, computed values of all CSS properties. This feature is instrumental in understanding how styles are resolved and applied to elements, shedding light on the intricate process of style computation and inheritance within the DOM.
Optimizing Performance and Responsiveness
Furthermore, the Styles tab includes tools for analyzing and optimizing the performance and responsiveness of web content. By inspecting and managing styles related to layout and rendering, you can identify opportunities to enhance the speed and efficiency of webpage display, ensuring a seamless and responsive user experience across various devices and screen sizes.
By harnessing the capabilities of the Styles tab within the Inspector, you gain a profound understanding of the visual presentation and styling of web content. Whether you're refining the layout, optimizing performance, or experimenting with design variations, the Styles tab equips you with the tools to navigate the intricate realm of CSS with confidence and finesse.
Resources Tab
The Resources tab in Safari's Inspector serves as a comprehensive resource management tool, offering insights into various aspects of web content, including network activity, storage, and more. Upon navigating to the Resources tab within the Inspector, you gain access to a wealth of information that enables you to analyze, monitor , and optimize the resources utilized by web pages.
Resource Overview
The Resources tab provides a holistic overview of the resources loaded by the current webpage, encompassing a wide range of elements such as documents, stylesheets, scripts, images, fonts, and more. This comprehensive view allows you to understand the composition of resources that contribute to the rendering and functionality of the webpage, providing valuable insights into the underlying assets that shape the user experience.
Network Requests
One of the key features of the Resources tab is the network request log, which meticulously records all HTTP requests initiated by the webpage. This log includes details such as request and response headers, timing, and resource size, enabling you to assess the performance and efficiency of network requests. By analyzing the network activity, you can identify potential bottlenecks, optimize resource loading, and ensure swift and seamless delivery of content to users.
Storage and Caching
In addition to network activity, the Resources tab offers visibility into various forms of storage utilized by web pages, including cookies, local and session storage, and application caches. This feature allows you to monitor and manage the storage of data, ensuring compliance with privacy regulations and optimizing the utilization of storage resources for enhanced user experience.
Initiating and Analyzing XHR/Fetch Requests
The Resources tab facilitates the inspection and analysis of XMLHttpRequest (XHR) and Fetch requests made by web pages, providing detailed insights into the data exchanged between the client and server. By monitoring XHR and Fetch requests, you can troubleshoot data retrieval and transmission issues, validate response data, and ensure the seamless operation of dynamic web applications.
Performance Analysis
Furthermore, the Resources tab includes tools for performance analysis, enabling you to assess the loading times of individual resources, identify potential performance bottlenecks, and optimize the delivery of content for enhanced user experience. This functionality is instrumental in fine-tuning the performance of web pages, ensuring swift and efficient resource loading across diverse network conditions and devices.
By leveraging the capabilities of the Resources tab within the Inspector, you gain a comprehensive understanding of the resources utilized by web pages, empowering you to optimize network activity, storage, and performance for an unparalleled user experience. Whether you're analyzing network requests, managing storage, or fine-tuning performance, the Resources tab equips you with the tools to navigate the intricate realm of web resources with precision and efficiency.
Network Tab
The Network tab within Safari's Inspector is a vital tool for analyzing the network activity of web pages, providing valuable insights into the loading and transmission of resources. Upon navigating to the Network tab, you gain access to a comprehensive log of network requests initiated by the webpage, along with detailed information about each request and response.
Monitoring Network Activity
The Network tab meticulously records all network requests, including HTTP requests for documents, stylesheets, scripts, images, and other resources. Each request is accompanied by essential details such as request and response headers, timing, resource size, and the initiator responsible for the request. This comprehensive log allows you to monitor the sequence and performance of network requests, enabling you to identify potential bottlenecks and optimize resource loading.
Request and Response Details
By selecting individual network requests in the log, you can delve into the specifics of each request and response. This includes insights into request headers, response headers, status codes, and response content, providing a granular understanding of the data exchange between the client and server. Analyzing these details allows you to troubleshoot issues related to resource loading, validate response data, and ensure the efficient delivery of content to users.
Performance Analysis and Timing
The Network tab offers tools for performance analysis, allowing you to assess the loading times of individual resources and the overall timeline of network activity. By examining the timing of network requests, you can pinpoint potential performance bottlenecks, optimize resource loading, and ensure swift and efficient delivery of content. This functionality is instrumental in fine-tuning the performance of web pages, ensuring a seamless user experience across diverse network conditions.
Filtering and Sorting Capabilities
To streamline the analysis of network activity, the Network tab provides filtering and sorting capabilities, enabling you to focus on specific types of requests or isolate requests based on various criteria. This feature empowers you to efficiently identify and address issues related to resource loading, network latency, and content delivery, fostering a responsive and optimized web browsing experience.
Initiating XHR/Fetch Requests
In addition to monitoring network requests initiated by the webpage, the Network tab facilitates the inspection and analysis of XMLHttpRequest (XHR) and Fetch requests. This feature provides detailed insights into the data exchanged between the client and server, allowing for thorough validation of response data and troubleshooting of dynamic web application functionality.
By harnessing the capabilities of the Network tab within the Inspector, you gain a comprehensive understanding of the network activity of web pages, empowering you to optimize resource loading, troubleshoot performance issues, and ensure seamless content delivery. Whether you're analyzing network requests, fine-tuning performance, or validating response data, the Network tab equips you with the tools to navigate the intricate realm of network activity with precision and efficiency.
Console Tab
The Console tab within Safari's Inspector serves as a dynamic interface for interacting with the JavaScript console of web pages, offering a powerful set of tools for debugging, logging, and executing JavaScript code. Upon navigating to the Console tab, you gain access to a versatile environment that enables you to monitor runtime errors, log messages, inspect JavaScript objects, and execute ad-hoc scripts, providing invaluable insights into the behavior and functionality of web applications.
Error Logging and Debugging
One of the primary functions of the Console tab is to capture and display runtime errors and exceptions encountered by JavaScript code within the webpage. By monitoring the console output, you can swiftly identify and address errors, ensuring the smooth operation of web applications. Additionally, the console provides detailed stack traces and contextual information for each error, facilitating thorough debugging and troubleshooting of JavaScript code.
Logging Messages and Variables
The Console tab allows for the logging of custom messages, variables, and objects, providing a means to track the execution flow and state of JavaScript code. By utilizing the console.log() method, you can output informative messages and inspect the values of variables and objects at specific points in the code, enabling you to gain visibility into the internal workings of web applications and pinpoint potential issues.
Interactive JavaScript Execution
In addition to logging and debugging, the Console tab offers an interactive environment for executing JavaScript code directly within the Inspector. This feature allows you to experiment with JavaScript expressions, test functions, and manipulate objects in real-time, fostering a dynamic and exploratory approach to understanding and modifying the behavior of web applications.
Network Request Monitoring
Furthermore, the Console tab provides visibility into network requests and responses, allowing you to monitor the exchange of data between the client and server. By capturing network-related messages and errors, you can assess the performance and integrity of data transmission, troubleshoot connectivity issues, and validate the handling of network requests within web applications.
Performance Profiling
Moreover, the Console tab includes tools for performance profiling, enabling you to analyze the execution time and memory usage of JavaScript code. By leveraging the built-in profiling capabilities, you can identify performance bottlenecks, optimize code efficiency, and ensure the responsive and efficient operation of web applications.
By harnessing the capabilities of the Console tab within the Inspector, you gain a comprehensive understanding of JavaScript runtime behavior, empowering you to debug, log, and execute JavaScript code with precision and agility. Whether you're troubleshooting errors, monitoring network activity, or profiling performance, the Console tab equips you with the tools to navigate the intricate realm of JavaScript development with confidence and insight.
In conclusion, the Inspector in Safari is a multifaceted and indispensable tool that empowers users to delve into the inner workings of web pages, gaining valuable insights into web development and design. By exploring the various tabs of the Inspector, including Elements, Styles, Resources, Network, and Console, users can unravel the complexities of web content, optimize performance, troubleshoot issues, and gain a deeper understanding of the technologies that drive the modern web.
The Elements tab provides a window into the hierarchical structure of web pages, allowing users to inspect, manipulate, and validate HTML elements with precision. From understanding the Document Object Model (DOM) to modifying attributes and styles in real-time, the Elements tab equips users with the tools to dissect and fine-tune the building blocks of web content.
Moving on to the Styles tab, users can gain a comprehensive understanding of the visual presentation and styling of web pages. By analyzing CSS rules, visualizing the box model, and modifying styles on the fly, the Styles tab facilitates the optimization of layout, performance, and design, empowering users to craft visually compelling and responsive web experiences.
The Resources and Network tabs offer invaluable insights into the resources utilized by web pages and the network activity that drives content delivery. From monitoring network requests and performance analysis to managing storage and optimizing resource loading, these tabs provide the tools to ensure swift, efficient, and seamless delivery of web content to users across diverse network conditions and devices.
Finally, the Console tab serves as a dynamic interface for interacting with the JavaScript console, enabling users to log messages, debug errors, execute scripts, and profile performance. This feature-rich environment empowers users to troubleshoot JavaScript code, monitor network activity, and validate the behavior of web applications, fostering a deeper understanding of client-side development and interactivity.
In essence, the Inspector in Safari transcends its role as a mere debugging tool, evolving into a comprehensive suite of features that cater to the diverse needs of web developers, designers, and enthusiasts. By mastering the capabilities of the Inspector, users can navigate the intricate realm of web development and design with confidence, creativity, and precision, ultimately enhancing the quality and user experience of web content across the digital landscape.
Leave a Reply Cancel reply
Your email address will not be published. Required fields are marked *
Save my name, email, and website in this browser for the next time I comment.
- Crowdfunding
- Cryptocurrency
- Digital Banking
- Digital Payments
- Investments
- Console Gaming
- Mobile Gaming
- VR/AR Gaming
- Gadget Usage
- Gaming Tips
- Online Safety
- Software Tutorials
- Tech Setup & Troubleshooting
- Buyer’s Guides
- Comparative Analysis
- Gadget Reviews
- Service Reviews
- Software Reviews
- Mobile Devices
- PCs & Laptops
- Smart Home Gadgets
- Content Creation Tools
- Digital Photography
- Video & Music Streaming
- Online Security
- Online Services
- Web Hosting
- WiFi & Ethernet
- Browsers & Extensions
- Communication Platforms
- Operating Systems
- Productivity Tools
- AI & Machine Learning
- Cybersecurity
- Emerging Tech
- IoT & Smart Devices
- Virtual & Augmented Reality
- Latest News
- AI Developments
- Fintech Updates
- Gaming News
- New Product Launches
Learn To Convert Scanned Documents Into Editable Text With OCR
Top mini split air conditioner for summer, related post, comfortable and luxurious family life | zero gravity massage chair, when are the halo awards 2024, what is the best halo hair extension, 5 best elegoo mars 3d printer for 2024, 11 amazing flashforge 3d printer creator pro for 2024, 5 amazing formlabs form 2 3d printer for 2024, related posts.

How To Inspect In Safari On IPad

How To Inspect On IPhone Safari

How To Get Developer Tools In Safari

How To Inspect Page On Safari

How To Enable Inspect In Safari

How To Debug In Safari

How To Open Developer Tools In Safari

What Is Web Inspector In Safari
Recent stories.

Fintechs and Traditional Banks: Navigating the Future of Financial Services

AI Writing: How It’s Changing the Way We Create Content

How to Find the Best Midjourney Alternative in 2024: A Guide to AI Anime Generators

How to Know When it’s the Right Time to Buy Bitcoin

Unleashing Young Geniuses: How Lingokids Makes Learning a Blast!
- Privacy Overview
- Strictly Necessary Cookies
This website uses cookies so that we can provide you with the best user experience possible. Cookie information is stored in your browser and performs functions such as recognising you when you return to our website and helping our team to understand which sections of the website you find most interesting and useful.
Strictly Necessary Cookie should be enabled at all times so that we can save your preferences for cookie settings.
If you disable this cookie, we will not be able to save your preferences. This means that every time you visit this website you will need to enable or disable cookies again.
Get HTTP Request Response Headers Safari Browser
Let's see an example of how you can get the HTTP Request or Response headers in Safari web browser for macOS,
Let's open Safari and visit google.com and search for the team java and see what the request-response headers are,
As you can see in the above gif example, right-click on the webpage and select "Inspect element" , go to the network tab, you may see a lot of entries of all kind of files loaded: CSS, images, javaScript, etc, you can select the Documents tab just to see the webpages request - click on Headers and you would see the Request and Response headers.
- Further comments disabled!
- How to show line numbers in Nano on Mac
- How to install Jupyter Notebook on macOS Sonoma
- How to Disable Remote Management using Mac Terminal
- Test internet speed using macOS Terminal command
- Docker Desktop needs privileged access macOS
- Google Search Hot Trends Screensaver for Mac OS X
- How to do calculations in Mac Terminal
- How to make TextEdit the default text Editor on Mac
- How to Show Full Website Address on Safari for Mac (Ventura/Sonoma)
- The Zsh Shell - Mac Tutorial
- Opening mac Terminal
- How to change the name of your Mac running on macOS Ventura 13
- How to find the Battery Cycle Count on macOS Ventura
- How to set an emoji as Zsh terminal prompt in macOS
- How to access Trash Folder using Mac Terminal Command
- macOS Ventura XCode Command Line Tools Installation
- Hide Bluetooth icon on Mac Menu Bar macOS Ventura 13
- How to run .sh file in Mac Terminal
- Terminal Command to get the list of available shells in macOS
- How to see Storage Information on macOS Ventura
- How to Go To /usr/local/bin on Mac Terminal?
- How to do screen recording on Mac
- How to Find File and Directory Size in Mac Terminal
- Open .bash_profile File in TextEdit using Terminal
- Remove Now Playing icon from macOS Big Sur Menu Bar
- How to do a Print Screen on Windows 11 to Screencapture - Windows
- Where is Maven .m2 local repository located on Mac - HowTos
- Java: Convert String to InputStream - Java
- JSON Nest Objects Example: JSON Tutorial - Json-Tutorial
- How to clear Microsoft Teams Cache on Mac (macOS) - Teams
- Python: How to create a Dictionary of Lists with Examples - Python
- Android Shared Preferences API tutorial - Android
- How to Export a PowerShell Script/Cmdlet Output to a Text File - Powershell
How to create Rules to Modify HTTP Requests in Chrome & Safari

- June 30, 2023
 - Requestly")
Requestly is a lightweight proxy available as a browser extension & desktop app to intercept & modify network requests. We bundle powerful tools to do a lot more with network requests than ever, such as Mocking API Responses, Modifying Headers, Redirecting URLs, Delay/Throttle requests, and much more. This article will explain the different rule types available in Requestly and the different use cases for each rule type.

There are currently 10 rule types available in Requestly.
Redirect Network Requests
Redirect Rule is used to redirect one URL to another URL. Example of common use cases could be:
- Test API version changes : Suppose there is a new version of some API which you are using. In order to test the backward compatibility of the API, you can just set up a redirect rule to redirect all URLs from older version to newer version and check if your application behaves as expected. This way, you don’t need to change single line of your code and test the API upgrades.
- Fix Broken Urls, Redirect dead bookmarks, and Create URL shortcuts : You can setup redirect rule to fix some broken rules, redirect the dead bookmarks to new working bookmarks and create URL shortcuts .
There can be many more examples like these but the above two examples give you an idea of where you can use the Redirect Rule.
Cancel/Block Network Requests
Cancel Rule is primarily used for Blocking Requests therefore it is alternatively called as Blocker Rule as well. Primary use cases include:
- Blocking Websites — You can use Cancel Rule to block social media websites to stay focussed.
- Test your app when certain resource is not loaded — You can use Cancel rule to block a certain request which is not mandatary in your app and test how your app behaves without that resource.

Modify Headers
Headers Rule is used for modifying request and response headers . There are not many extensions available in Chrome Store and Firefox Store which allow you to modify response headers.
Bypass Iframe Buster Header : Most websites use X-Frame-Options header to prevent opening inside iframe. However, a developer may want to open the website inside iframe for debug/demo purposes. This articl e explains how you can do that using Header Rule .
You can setup Header rule to modify Request and Response headers according to your use cases. This rule is mostly used by developers and is the most used rule in Requestly as per Google Analytics. Have a look at list of headers not allowed for modification.
Modify API Response
Requestly provides Modify API response option using which you can modify the response body of APIs. Helpful in debugging APIs directly on production (or live) sites.Similar to other Rules, this Rule will also allow you to specify advanced filters including the regular expressions. Some use cases are:
- Test AJAX response without actually modifying backend
- Mock fluctuating responses.
- Mock response to focus on front-end development even if back-end is not available.
Inject custom javascript (Code or from URL)
Script Rule is very handy and powerful. It allows you to inject custom scripts on a website. You can write custom code (Upto 500 characters) or use Requestly Library to host your code and use the url inside script rule. It also allows you to pick when should the script be executed before page load or after page load.
Modifying QueryParams Rule
QueryParams Rule , as the name suggests is used for modification of Query parameters in a request. You can perform these operations:
- Add Parameter
- Remove given parameter
- Remove all parameters
QueryParams rule can be used to debug/test how the site behaves with different/unwanted query params . You can also use Query Params and apply random query parameter to each request and it will serve as cache buster .

Replace Strings in URL
As the name indicates, Replace String allows users to replace a string (or matching pattern) with another string in the url. It looks to be very simple but it can achieve very complex use cases:
- Switch Domains
- Change Query Parameter Values
- Fix broken/updated URLs
- Pattern Matching in Replace Rule
Delay Network Requests
Many times, testing certain parts of web applications require you to simulate a delay in one or more components of the web app. Here are some scenarios where you would like to delay the network requests:
- Test performance of your web app on a slower condition
- Test behaviour of your app when one or more APIs respond slow (API Latency has gone up)
- Check if any race conditions exist when some resource X gets loaded after/before another resource Y.
- Test the impact of slow loading of external resources impact on your app.
- Test your loading experience in the app.

Override User-Agent Rule
UserAgent Rule is used to modify user agent on a given website and all the urls in that website. Internally, it just modifies the request header and overrides the navigator.userAgent at client side.
- Cross Browser Testing : UserAgent rule can be used to check how your website behaves when passed different user agents. For example :- You may have done browser specific coding based on user agent. You can use the rule to test that functionality instead of switching between browsers.
- Test Responsiveness of website : You can set user agent of mobile device and see how the website adapts to the user agent for the mobile device.

This article was written by:

Share this article:
You may also like

Why is there no Charles Proxy Chrome Extension?

Requestly Update – March, 2024
How requestly can improve team collaboration using workspaces.
- HTTP Rules (Web Debugger) Intercept and modify requests, inject scripts, Map Local, Map Remote, etc.
- Mock Server Quickly create API Mocks.
- SessionBook Beta Capture, report and debug with screen recording, network logs and console logs.
- API Client A minimalistic API Client to test APIs.
- Case Studies
- Release Notes
When you're reporting an issue to HappyFox support, we may ask for a screenshot of your Web Browser's Console and/or Network Logs to troubleshoot the problem thoroughly 🛠.
Console/Network Logs often contain important error details essential to identify the root cause of the issue/bug that you're facing inside HappyFox.
This article describes how you can access these logs in popular web browsers like:
- Google Chrome.
- Mozilla FireFox.
Google Chrome:
Console Logs in Chrome:
In Google Chrome, the Console Logs are available as a part of Chrome Dev Tools .
To open the dedicated Console panel, either:
- Press Ctrl + Shift + J (Windows / Linux) or Cmd + Opt + J (Mac).
You can also access this Console panel from the Chrome Menu :
- Locate and Click the " Three dots Menu bar" on the top right of your chrome browser.
- Go to More tools >> Developer Tools.
- Switch to Console Tab.
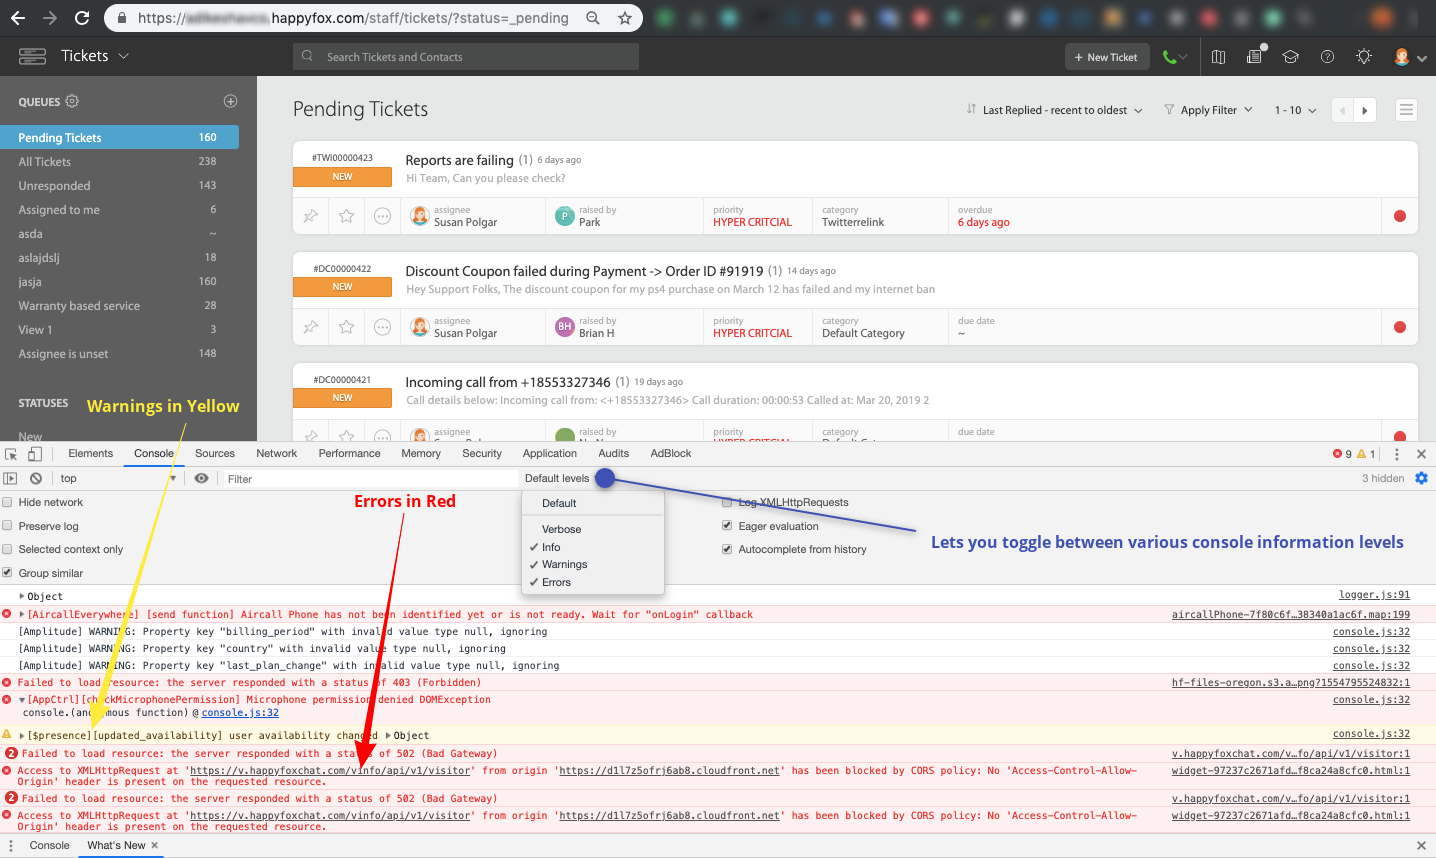
In the Console Tab, you can find the current error messages (Displayed in Red) along with other console level information such as warnings and info.
Network Logs in Chrome:
In general, Network panel is used when you need to make sure that resources are being downloaded or uploaded as expected. Open DevTools by pressing Control + Shift + I or Command + Option + I (Mac). Refresh the contents of the webpage.
- Finding the Error : Scroll through the network logs to find entries with " Red " font, such as the one below:

- Click on the error to find the error details. Navigate across Header, Preview and Response tabs to know more about the error and its origin. Header tab may contain critical information related to the error. Please check with your designated support representative to know which information to share.
Mozilla FireFox:
Console logs in FireFox
In Mozilla FireFox, the Console Logs are available as a part of FireFox developer tools .
To open the Web Console:
- either select "Web Console" from the Web Developer submenu in the Firefox Menu (or Tools menu if you display the menu bar or are on Mac OS X)
- or press the Ctrl+ Shift+ K ( Command+ Option+ K on OS X) keyboard shortcut.

Network Logs in FireFox:
Opening the Network Monitor :
- Press Ctrl + Shift + E ( Command + Option + E on a Mac).
- Select "Network" from the Web Developer menu, (which is a submenu of the Tools menu on OS X and Linux).
- Click the wrench icon, which is in the main toolbar or under the Hamburger menu, then select "Network".
- Finding the Error : Scroll through the network logs to find entries with " Pink " font, such as the one below:

- Click on the error to find the error details. Navigate across Header, Params and Response tabs to know more about the error and its origin. Header tab may contain critical information related to the error. Please check with your designated support representative to know which information to share.
In Safari Browser, console and network logs are available as a part of "Develop Menu". By default, these options are disabled. To enable "Develop Menu",
- Launch "Safari".
- Go to Safari >> Preferences >> Advanced (From the header).
- Enable "Show Develop Menu in Menu Bar".
Console logs in Safari:
Post enabling "Develop Menu", go to the desired webpage and click Develop >> Show Javascript Console.

Network Logs in Safari:
Opening the Network Log:
- Open Safari JavaScript Console.
- Switch to "Network Tab".
- Refresh the webpage.
- Errors are displayed in " Red " font. Clicking on the error would open the details area. You can find critical error information in the header and Preview tabs.
Need additional information
Hard to understand
Inaccurate/irrelevant content
Missing/broken link
If Safari doesn't open a page or work as expected on your Mac
If Safari doesn't load a webpage, stops responding, quits unexpectedly, or otherwise doesn't work as expected, these solutions might help.
These solutions are for issues that can affect Safari on Mac, including issues such as these:
A webpage is blank, doesn't load all of its content, or otherwise doesn't work as expected.
You can't sign in to a webpage, despite using the correct sign-in information.
A webpage asks you to remove or reset cookies.
Safari slows down, stops responding, or quits unexpectedly.
Reload the page
From the menu bar in Safari, choose View > Reload Page. Or press Command-R.
If Safari doesn't reload the page, quit Safari, then try again. If Safari doesn't quit, you can press Option-Command-Esc to force Safari to quit .
If Safari automatically reopens unwanted pages, quit Safari, then press and hold the Shift key while opening Safari. Learn how to control which windows Safari automatically reopens .
Install software updates and restart
Update macOS , which can include updates for Safari. If your Mac didn't restart automatically, choose Apple menu > Restart. Some important background updates take effect only after restarting.
Check Safari extensions
If you installed any Safari extensions, turn extensions off. From the menu bar in Safari, choose Safari > Settings (or Preferences). Click Extensions, then deselect each extension to turn it off. Learn more about Safari extensions .
If you find that an extension is causing the issue, make sure that the extension is up to date.
Test with a private window
A website can store cookies, caches, and other data on your Mac, and issues with that data can affect your use of the website. To prevent the website from using that data, view it in a private window: From the menu bar in Safari, choose File > New Private Window, or press Shift-Command-N.
If that works, use the following steps to remove the website's data, including its caches and cookies. The website can then create new data as needed. If it's a website that you sign in to, make sure that you know your sign-in information before continuing.
Choose Safari > Settings (or Preferences), then click Privacy.
Click Manage Website Data.
Select the affected website from the list shown.
Click Remove.
Click Done.
Open the website again in a non-private browser window.
Check Safari settings
The webpage might not be compatible with one or more browser settings, which you can turn on or off as needed. From the menu bar in Safari, choose Safari > Settings (or Preferences). Then click Websites, Privacy, or Security to access these settings:
Privacy settings . These settings apply to all websites. For example, a website might require that you allow cross-site tracking, show your IP address, or allow cookies.
Security settings . These settings apply to all websites. For example, a website might require that you enable JavaScript.
Websites settings . These settings can be configured for specific websites. For example, a website might require that you allow pop-up windows, allow downloads, allow access to your camera or microphone, or turn off content blockers.
Check iCloud Private Relay
If you subscribe to iCloud+ and are using its Private Relay feature, try reloading the page without Private Relay: From the menu bar in Safari, choose View > Reload and Show IP Address. This menu item appears only when Private Relay is turned on for your network. Learn more about iCloud Private Relay .
Check VPN or other security software
If you installed VPN or other software that monitors or interacts with your network connections, that software could affect your use of the website or the internet. Learn about network issues related to VPN and other software .
Check network settings
Certain network settings, such as custom proxy settings or custom DNS settings , can affect access to content on the internet. Even if you haven't changed these or other network settings yourself, you might have installed software that changed them for you.
To find out whether the issue is with the network settings on your Mac, try viewing the page from a different web browser or different device on the same network. Or reset your network settings by setting up a new network location on your Mac.
If the issue affects other devices and web browsers on the same network, the issue is probably with the website, and you should contact the website developer for help.
If the issue continues to affect only a particular webpage, contact the website developer for help.
Learn how to block pop-up ads and windows in Safari .
Learn what to do if your iCloud or Safari bookmarks aren't syncing .

Related topics
Explore Apple Support Community
Find what’s been asked and answered by Apple customers.
10 Ways To Fix Cannot Parse Response Error in Safari
- written by Muhammad Bilal
- August 22, 2023

Safari, a default browser for Apple devices, provides an optimal browsing experience for users. However, the “Cannot Parse Response” error message while accessing certain websites in the Safari browser can disrupt your web surfing activities.
Cannot Parse Response means the web browser is unable to understand the response received from the server. This error occurs in the Safari browser due to various reasons, such as network connectivity or issues with website data.
Fortunately, there exist several troubleshooting methods to resolve this common problem that is causing your browser to fail to parse response in Safari.
Table of Contents
1. remove web content restrictions.
By default, Apple restricts your web browsing activities to ensure your privacy. However, this can cause the Safari browser to show the “Cannot Parse Response” error.
To fix this issue, enable the Unrestricted Access option on your iPhone and Mac, and try reloading the page.
It’ll clear out all temporary files stored in your browser and fetch the latest version from the server.
- Open the Settings app on your iPhone.

- Click on the Apple icon in the top left corner of the screen.

- Go to Content & Privacy > Content Restrictions.

- Now, reload the page in Safari and it should parse the response.
2. Clear Website Data From Safari
The corrupted website data stored in your Safari browser can cause problems when parsing the response.
To prevent it from happening again, try clearing website data to remove all conflicting cached files and cookies in the browser’s memory then, reload the page.
- Go to the Settings app > Scroll until you find Safari , and select it.
- Swipe down to the end and tap Advanced > Select Website Data .

- Tap Delete and go back to Safari, and refresh that website.
- Launch Safari and click on the Safari tab in the menu bar.
- Select Settings > Go to Privacy > Click on Manage Website Data .

- Relaunch Safari and open the website again to parse the response.
3. Relaunch Your Safari Browser
Restarting your Safari browser is an effective solution to fix any issue related to the parsing of responses. This will clear all the temporary memory in the browser and refresh its working.
Once restarted, try accessing the unresponsive web page again. It should work fine now.
To restart Safari on your iPhone, simply close the browser from the recent apps and then open it again. This will refresh the browser and get it running smoothly again.
On Mac, press the Option + Command + Esc keys together to force quit the Safari browser. After that, open the browser again and try loading the website causing problems.
4. Reset Safari Web Browser
Browser settings can sometimes conflict with the page you are trying to access and cause a “Cannot Parse Response” error. To fix this bug, try resetting the Safar i browser to revert the browser’s settings to their default state.
Then, relaunch Safari and check if the issue persists.
- Go to the Settings app > Scroll down and select Safari .
- Swipe down and tap Clear History and Website Data .
- Confirm this action by tapping Clear History and Data in the confirmation dialog box.
- Relaunch the Safari app and try opening the web page again.
- Launch Safari, click on the Safari menu and select Preferences or Settings .
- Choose the Privacy tab, and click on Manage Website Data .
- Select Remove All > Confirm Remove Now in the dialog window.
- Click on the Develop menu from the menu bar > select Empty Caches then, open the website again.
If Develop option is missing on your Mac, click on the Safari menu > Preferences > Advanced tab and check the Show Develop menu in Menu Bar option.
5. Enable Mobile Data For Safari
If you’re having trouble parsing a page in Safari, it may be because mobile data is not enabled for the browser.
- Go to the Settings app on your iPhone.
- Swipe down and tap Cellular .
- Find Safari from the list and turn on the switch if it was off.
- Now, restart the browser and try accessing that web page again.
If mobile data was turned off before, it could be the potential reason why your Safari browser is unable to parse the response.
Once the internet is enabled, you’ll be able to view the contents of an inaccessible website.
6. Change The DNS Servers
The default DNS servers provided by your Internet Service Provider (ISP) may have some issues which prevent you from accessing certain websites.
To fix this issue, switch to a reliable DNS server like Google from device settings then, try opening the page again in your Safari browser.
- Go to Settings > tap Wi-Fi
- Press the info icon ⓘ next to your connected Wi-Fi network.
- Tap Configure DNS and choose Manual from the top.
- Remove the current DNS servers then, tap Add Server.
- Type 8.8.8.8 and press the Save button when done.
- Open the Safari app again and refresh the problematic website.
- Click the Apple menu, and go to Settings or Preferences.
- Choose Network Settings.
- Select your Wi-Fi connection on the left pane and click Advanced .
- Go to the DNS Settings tab > Press the + button to add the server.
- Type 8.8.8.8 , hit OK , and try reloading your Safari page .
7. Check Your Internet Connection
A slow internet connection can cause the Safari browser to be unable to parse a page response. The parsing error usually occurs when the browser is unable to connect to the server due to internet connectivity issues.
To resolve this issue, connect to a high GHz Wi-Fi network or a cellular data network.
If the problem is resolved by doing so, then it indicates that the issue lies with your Wi-Fi connection. You can test your internet speed using Speedtest by Ookla service.
You can also try restarting your WiFi router or modem to clear any connectivity issues and provide a stable internet connection.
8. Disable Conflicting Safari Extensions
Different browser extensions installed in your Safari can sometimes interfere with the proper functioning of your browser including parsing the server response errors.
To resolve such issues, you can try disabling all extensions and then check if the parsing error still pops up.
- Go to Settings > Safari .
- Tap Extensions > Turn OFF all extensions.
- Open a page again on Safari and check if it works.
- Open the Safari browser, click on Safari > Preferences from the drop-down menu.
- Select the Extensions tab to view all installed extensions.
- Uncheck all the boxes next to extensions to disable them temporarily.
- Now, try refreshing the page again in Safari.
9. Update Your Safari Browser
At times, outdated browser versions can cause it to be unable to open web pages and generate a “cannot parse response” error. To prevent it from happening again, simply install the latest version of the Safari browser.
After that, open the page again and the browser should display its contents.
To update Safari on iPhone , open App Store > search for Safari > install the updated version if available.
On Mac , go to System Settings from the main menu options > select General on the left menu bar > Software Update then, click Update Now to install the latest Safari version.
Causes Of Cannot Parse Response in Safari
While browsing the web, Safari may not be able to parse server responses for various reasons.
- Corrupted browser data. Outdated cached files and cookies in the Safari browser can lead to a “cannot parse response” error. It usually happens when the browser is used for a long time without clearing its data.
- Connectivity Issue. When you are browsing with a slow or unstable network connection, your Safari browser may often face difficulties in parsing server responses.
- Conflicts with plugins. Safari extensions can also interfere with browser operations and cause parsing errors. Moreover, using outdated plugins can be a culprit of this issue.
Although there are other potential causes of this error in Safari, these are the most common ones. However, the fixes provided above should help you solve the issue.
Frequently Asked Questions
What does the error “cannot parse response” mean.
When the Safari browser cannot interpret a web page response that it receives from the server, it displays a “cannot parse response” message. This means that the browser is unable to display the website content. Poor network connection is one of the root causes of this issue.
How Can I Get Rid of Parsing Error in Safari?
To resolve the parsing response issue, start by updating your Safari browser and then clearing its data. If the problem persists, try clearing your browsing history and cookies as well. Additionally, disable the conflicted extensions to see if this is creating an issue.
Why is Safari Browser Not Opening Some Websites?
Due to restricted web content access on Apple devices, Safari might not be able to load some modern websites. To enable unrestricted access, go to Settings > Screen Time > Content & Privacy Restrictions > Web Content then, choose Unrestricted Access to open any website.
Although Safari, a native browser, is optimized for Apple devices, it can still face certain issues. The “cannot parse response” error is quite common and can be resolved by following the steps mentioned in this article.
Hopefully one or more of these solutions has helped you overcome this issue and move on to browsing without any issue.
If you found this guide helpful, make sure to share it with others so they can also get benefit from it.

Muhammad Bilal
I'm Muhammad Bilal, founder of Tech Axen. Being a tech enthusiast, I enjoy sharing tech tips and tricks with others to assist them with their issues. For this purpose, I feed this blog with articles that provide useful information on technology.
Related Posts

Customer Lifetime Value vs Other Metrics – Which is Most Important?

From Followers to Customers: How to Convert Social Media Engagement into Sales?

How to Design Your Own Wedding Invitations: DIY Made Easy
Leave a reply cancel reply.
You must be logged in to post a comment.
Looks like no one’s replied in a while. To start the conversation again, simply ask a new question.
Safari cannot open the page because the network connection was lost
Posted on Mar 1, 2018 8:43 AM

Posted on Mar 2, 2018 5:28 PM
Similar questions
- safari I get message that Safari cannot open page because the network connection was lost. What do I do? 275 1
- What does this mean, and how can i fix it? "safari could not open the page because the network connection was lost" What does this mean, and how can i fix it? "safari could not open the page because the network connection was lost" 242 1
- My safari is showing not connected to Internet My safari is not working it’s showing not connected to Internet 364 4
Loading page content
Page content loaded
Mar 2, 2018 5:28 PM in response to faizanfromsaddar
Mar 20, 2018 4:08 PM in response to faizanfromsaddar
I cannot open Facebook website on safari

Welcome to Panopto Support
Welcome to the panopto forums, how to capture network logs from safari web browser, who can use this feature, overview .
This article will go over how to capture network logging from the Safari web browser. This process is best suited for users who have ongoing issues with Panopto in Safari and who want to obtain their network logs for future reference and troubleshooting with Panopto's Support team. Prerequisites
- Safari browser
1. Accessing Network Logs
2. Capture Console Logs
3. Send Logs from the Viewer
Web Inspector Reference Local Overrides
Creating local overrides, configuring local overrides, exporting local overrides.
As web development workflows have gotten more complicated, it’s become increasingly difficult to make quick changes to a resource and upload it to a server to test.
Some parts of a page’s content can be modified live using Web Inspector, such as CSS or any JavaScript values, but these changes are not persistent across page reloads/navigations.
Often, however, the desired change is a modification to the control flow of a loaded script or data included with network activity.
In these cases, Web Inspector is in a perfect position to intercept the network activity and replace/block it with a Local Override , allowing for quick local testing without having to modify anything on a server.
When Web Inspector is open, network requests made by the inspected page that match the URL of a Local Override will instead use data from that Local Override in Web Inspector rather than from the network or memory/disk cache.
Local Overrides can be created in a few ways:
- Right-clicking on links or tree items that correspond to a resource loaded from the network and selecting Create Request Local override , Create Response Local Override , or Block Request URL .
- Dragging and dropping a file over any non-text-based resource loaded from the network. This will create a Response Local Override with the MIME type and contents of the dropped file, but with the response status, and response headers of the selected resource.
- Selecting Local Override… when creating a resource . This will create an “empty” Local Override that needs to be configured before it will have any effect.
When a Local Override is created from a resource, the Local Override will copy relevant data from resource depending on the type of the Local Override . For Request Local Overrides , the resource’s URL, method, and request headers are copied. For Response Local Overrides , the resource’s URL, MIME type, status code, status text, and response headers are copied.
Once there is at least one Local Override in Web Inspector, the Local Overrides section will become visible in the Navigation Sidebar in the Sources Tab . All Local Overrides , as well as the Inspector Bootstrap Script , can be found here.
Local Overrides are persistent across Web Inspector sessions, but keep in mind that Local Overrides don’t have an effect unless Web Inspector is open, and only apply the next time a resource is loaded that matches it’s configured URL.
Modifying the content of a Local Override is as simple as selecting it in the Navigation Sidebar and interacting with the controls in the Main Content Area . Response Local Overrides show the contents of the network response. Request Local Overrides show the request data. Blocking Local Overrides show a dropdown to choose the kind of error to block matching network requests.
For non-text-based resources, dragging and dropping a file over the content view will update the content and MIME type of the Response Local Override using the dropped file’s contents and inferred MIME type.
If the desired changes are not related to the content, however, right-clicking on any Local Override tree item and selecting Edit Local Override… will show a popover with inputs for modifying data for that Local Override .
Checking the Regular Expression checkbox will instead treat the URL as a regular expression, allowing a single Local Override to match multiple resources. This can be especially useful for matching against URLs with query parameters.
If no Headers are provided, the original headers will be used.
Request Local Overrides with a regular expression URL can use capture groups (e.g. $1 ) inside the Redirect URL.
Response Local Overrides can be configured to Skip Network , which will cause Web Inspector to immediately respond with that Response Local Override ‘s data when intercepting a matching network request, thereby preventing that network request from actually being sent.
Exporting the contents of a Local Override works just like any other resource, in that pressing ⌘ S when viewing the contents of a Local Override or selecting Save File after right-clicking on any Local Override tree item will show a save file dialog.
Identifying Overridden Resources
Whenever a resource is overriden by a Local Override , it’s icon is inverted throughout Web Inspector.
When looking at the content view for that resource, a banner is shown at the top with a button to Reveal the corresponding Local Override .

Written January 14, 2020 by Devin Rousso and Joseph Pecoraro
Last updated June 2, 2022 by Devin Rousso
- Skip to main content
- Skip to search
- Skip to select language
- Sign up for free
- Português (do Brasil)
Intercept HTTP requests
To intercept HTTP requests, use the webRequest API. This API enables you to add listeners for various stages of making an HTTP request. In the listeners, you can:
- Get access to request headers and bodies and response headers.
- Cancel and redirect requests.
- Modify request and response headers.
This article looks at three different uses for the webRequest module:
- Logging request URLs as they are made.
- Redirecting requests.
- Modifying request headers.
Logging request URLs
To see how you can use webRequest to log requests, create a new directory called "requests". In that directory, create a file called "manifest.json" and add:
Next, create a file called "background.js" and add:
You use onBeforeRequest to call the logURL() function just before starting the request. The logURL() function grabs the URL of the request from the event object and logs it to the browser console. The {urls: ["<all_urls>"]} pattern means you intercept HTTP requests to all URLs.
To test it:
- Install the extension
- Open the Browser Console (use Ctrl + Shift + J )

- Open some web pages.
In the Browser Console, you should see the URLs for any resources the browser requests. For example, this screenshot shows the URLs from loading a Wikipedia page:

Redirecting requests
Now use webRequest to redirect HTTP requests. First, replace "manifest.json" with this:
The changes here:
- Add the webRequestBlocking permission . This extra permission is needed when an extension wants to modify a request.
- Replace the <all_urls> permission with individual host permissions , as this is good practice to minimize the number of requested permissions.
Next, replace "background.js" with this:
Again, you use the onBeforeRequest event listener to run a function just before each request is made. This function replaces the redirectUrl with the target URL specified in the function. In this case, the frog image from the your second extension tutorial .
This time you are not intercepting every request: the {urls:[pattern], types:["image"]} option specifies that you only intercept requests (1) to URLs residing under " https://developer.mozilla.org/ " and (2) for image resources. See webRequest.RequestFilter for more on this.
Also, note that you're passing an option called "blocking" : you must pass this whenever you want to modify the request. It makes the listener function block the network request, so the browser waits for the listener to return before continuing. See the webRequest.onBeforeRequest documentation for more on "blocking" .
To test it out, open a page on MDN that contains images (for example, the page listing extension user interface components ), reload the extension , and then reload the MDN page. You see something like this:

Modifying request headers
Finally, use webRequest to modify request headers. In this example, you change the "User-Agent" header so the browser identifies itself as Opera 12.16, but only when visiting pages under " https://useragentstring.com/ ".
Update the "manifest.json" to include https://useragentstring.com/ like this:
Replace "background.js" with code like this:
You use the onBeforeSendHeaders event listener to run a function just before the request headers are sent.
The listener function is called only for requests to URLs matching the targetPage pattern . Also, note that you again pass "blocking" as an option. You also pass "requestHeaders" , meaning the listener is passed an array containing the request headers you expect to send. See webRequest.onBeforeSendHeaders for more information on these options.
The listener function looks for the "User-Agent" header in the array of request headers, replaces its value with the value of the ua variable, and returns the modified array. This modified array is sent to the server.
To test it out, open useragentstring.com and check that it identifies the browser as Firefox. Then reload the extension, reload useragentstring.com , and see that Firefox is now identified as Opera.

To learn about all the things you can do with the webRequest API, see its reference documentation .
- Introduction
- Article Information
Evolution over time in individuals with previous SARS-CoV-2 infection receiving the BNT162b2 (Pfizer-BioNTech) vaccine, SARS-CoV-2–naive individuals receiving the mRNA-1273 (Moderna) vaccine, and SARS-CoV-2–naive individuals receiving BNT162b2 (Pfizer-BioNTech) of median log 10 levels of salivary and serum anti–spike IgG or IgA at days 1, 29, 57, and 180 after vaccination. Error bars indicate 95% CI. Dotted lines indicate threshold values computed as mean plus 1 SD of measurements made at day 1 among patients without prior infection. Results of comparison between groups at each time (Wilcoxon rank sum test) are shown.
a P ≤ .001, previous infection vs infection naive with mRNA-1273 vaccine.
b P ≤ .001, previous infection vs infection naive with BNT162b2 vaccine.
c P ≤ .001, infection naive with mRNA-1273 vaccine vs infection naive with BNT162b2 vaccine.
Evolution over time in SARS-CoV-2–naive individuals receiving the mRNA-1273 (Moderna) vaccine or BNT162b2 (Pfizer-BioNTech) vaccine and previously infected individuals receiving BNT162b2 (Pfizer-BioNTech) of median log 10 salivary anti–spike IgG normalized on total salivary IgG levels at days 1, 29, 57, and 180 after vaccination, measured using digital enzyme-linked immunosorbent assay. Dotted lines indicate threshold values computed as mean plus 1 SD of measurements made at day 1 among patients without prior infection. Horizontal blue bars indicate median values. Results of the comparison between time points (Wilcoxon rank sum test) are provided in eTable 5 in Supplement 1.
Evolution over time in SARS-CoV-2–naive individuals receiving the mRNA-1273 (Moderna) vaccine or the BNT162b2 (Pfizer-BioNTech) vaccine and previously infected individuals receiving BNT162b2 (Pfizer-BioNTech) of median log 10 salivary anti–spike IgA levels normalized on total salivary IgA at days 1, 29, 57, and 180 after vaccination, measured using digital enzyme-linked immunosorbent assay (taking into account both monomeric and multimeric secretory IgA). Dotted lines indicate threshold values computed as mean plus 1 SD of measurements made at day 1 among patients without prior infection. Horizontal blue bars indicate median values. Results of the comparison between time points (Wilcoxon rank sum test) are provided in eTable 5 in Supplement 1.
Measure of anti – spike secretory IgA by classic enzyme-linked immunosorbent assay, using antisecretory piece detection antibodies. SARS-CoV-2–naive individuals received the mRNA-1273 (Moderna) vaccine and previously infected individuals received the BNT162b2 (Pfizer-BioNTech) vaccine. Horizontal orange bars indicate median values. Results of the comparison between groups (Wilcoxon rank sum test) are shown.
a P ≤ .01, days 1 vs 57, for infection-naive participants receiving mRNA-1273 vaccine.
b P ≤ .001, day 57 for infection-naive participants receiving mRNA-1273 vaccine vs day 29 for previously infected individuals.
eTable 1. Serum SARS-CoV-2 Spike-Specific IgG and IgA
eTable 2. Salivary SARS-CoV-2 Spike-Specific IgG and IgA
eTable 3. Intragroup Longitudinal Variations of Salivary SARS-CoV-2 Spike-Specific IgA
eTable 4. SARS-CoV-2 Spike-Specific Secretory IgA (OD)
eTable 5. P Values Corresponding to Data Analyses in Figures 2, 3, and 4
eFigure 1. Correlations Between Serum and Saliva IgG and IgA
eFigure 2. No Serological Evidence for Asymptomatic Infection in Moderna-Vaccinated Individuals With Late Increase in Specific Saliva IgA
eMethods. Digital ELISA Assay for SARS-CoV-2 Spike-Specific IgA
Data Sharing Statement
See More About
Sign up for emails based on your interests, select your interests.
Customize your JAMA Network experience by selecting one or more topics from the list below.
- Academic Medicine
- Acid Base, Electrolytes, Fluids
- Allergy and Clinical Immunology
- American Indian or Alaska Natives
- Anesthesiology
- Anticoagulation
- Art and Images in Psychiatry
- Artificial Intelligence
- Assisted Reproduction
- Bleeding and Transfusion
- Caring for the Critically Ill Patient
- Challenges in Clinical Electrocardiography
- Climate and Health
- Climate Change
- Clinical Challenge
- Clinical Decision Support
- Clinical Implications of Basic Neuroscience
- Clinical Pharmacy and Pharmacology
- Complementary and Alternative Medicine
- Consensus Statements
- Coronavirus (COVID-19)
- Critical Care Medicine
- Cultural Competency
- Dental Medicine
- Dermatology
- Diabetes and Endocrinology
- Diagnostic Test Interpretation
- Drug Development
- Electronic Health Records
- Emergency Medicine
- End of Life, Hospice, Palliative Care
- Environmental Health
- Equity, Diversity, and Inclusion
- Facial Plastic Surgery
- Gastroenterology and Hepatology
- Genetics and Genomics
- Genomics and Precision Health
- Global Health
- Guide to Statistics and Methods
- Hair Disorders
- Health Care Delivery Models
- Health Care Economics, Insurance, Payment
- Health Care Quality
- Health Care Reform
- Health Care Safety
- Health Care Workforce
- Health Disparities
- Health Inequities
- Health Policy
- Health Systems Science
- History of Medicine
- Hypertension
- Images in Neurology
- Implementation Science
- Infectious Diseases
- Innovations in Health Care Delivery
- JAMA Infographic
- Law and Medicine
- Leading Change
- Less is More
- LGBTQIA Medicine
- Lifestyle Behaviors
- Medical Coding
- Medical Devices and Equipment
- Medical Education
- Medical Education and Training
- Medical Journals and Publishing
- Mobile Health and Telemedicine
- Narrative Medicine
- Neuroscience and Psychiatry
- Notable Notes
- Nutrition, Obesity, Exercise
- Obstetrics and Gynecology
- Occupational Health
- Ophthalmology
- Orthopedics
- Otolaryngology
- Pain Medicine
- Palliative Care
- Pathology and Laboratory Medicine
- Patient Care
- Patient Information
- Performance Improvement
- Performance Measures
- Perioperative Care and Consultation
- Pharmacoeconomics
- Pharmacoepidemiology
- Pharmacogenetics
- Pharmacy and Clinical Pharmacology
- Physical Medicine and Rehabilitation
- Physical Therapy
- Physician Leadership
- Population Health
- Primary Care
- Professional Well-being
- Professionalism
- Psychiatry and Behavioral Health
- Public Health
- Pulmonary Medicine
- Regulatory Agencies
- Reproductive Health
- Research, Methods, Statistics
- Resuscitation
- Rheumatology
- Risk Management
- Scientific Discovery and the Future of Medicine
- Shared Decision Making and Communication
- Sleep Medicine
- Sports Medicine
- Stem Cell Transplantation
- Substance Use and Addiction Medicine
- Surgical Innovation
- Surgical Pearls
- Teachable Moment
- Technology and Finance
- The Art of JAMA
- The Arts and Medicine
- The Rational Clinical Examination
- Tobacco and e-Cigarettes
- Translational Medicine
- Trauma and Injury
- Treatment Adherence
- Ultrasonography
- Users' Guide to the Medical Literature
- Vaccination
- Venous Thromboembolism
- Veterans Health
- Women's Health
- Workflow and Process
- Wound Care, Infection, Healing
Get the latest research based on your areas of interest.
Others also liked.
- Download PDF
- X Facebook More LinkedIn
Gorochov G , Ropers J , Launay O, et al. Serum and Salivary IgG and IgA Response After COVID-19 Messenger RNA Vaccination. JAMA Netw Open. 2024;7(4):e248051. doi:10.1001/jamanetworkopen.2024.8051
Manage citations:
© 2024
- Permissions
Serum and Salivary IgG and IgA Response After COVID-19 Messenger RNA Vaccination
- 1 Sorbonne Université, Institut National de la Santé et de la Recherche Médicale (INSERM), Centre d’Immunologie et des Maladies Infectieuses (CIMI), Département d’Immunologie, Assistance Publique–Hôpitaux de Paris (AP-HP), Hôpital Pitié-Salpêtrière, Paris, France
- 2 INSERM, Institut Pierre Louis d’Epidémiologie et de Santé Publique, AP-HP, Hôpital Pitié-Salpêtrière, Département de Santé Publique, Unité de Recherche Clinique Paris Sciences et Lettres (PSL)–CFX, Sorbonne Université, Paris, France
- 3 Université Paris Cité, INSERM, Centre d’Investigation Clinique (CIC) 1417 Cochin Pasteur, French Clinical Research Infrastructure Network, Innovative Clinical Research Network in Vaccinology, APHP, Hôpital Cochin, Paris, France
- 4 INSERM SC10-US019, Villejuif, France
- 5 AP-HP, Hôpitaux Universitaires Pitié-Salpêtrière–Charles Foix, Unité de Recherche Clinique des Hôpitaux Universitaires Pitié-Salpêtrière, Paris, France
- 6 AP-HP, Hôpital Cochin, Fédération des Centres de Ressources Biologiques–Plateforme de Ressources Biologiques Centre de Ressources Biologique Cochin, Paris, France
- 7 AP-HP, Hôpital Cochin, Service d’Immunologie Biologique et Plateforme d’Immunomonitoring Vaccinal, Paris, France
- 8 Institut Curie, PSL Research University, INSERM U900, MINES ParisTech, PSL, Paris, France
- 9 Centre National de la Recherche Scientifique (CNRS), Unité Mixte de Recherche (UMR) 144, Paris, France
- 10 Research Institute for Sustainable Development 190, INSERM 1207, Institut Hospitalier Universitaire Méditerranée Infection, Unité des Virus Émergents, Aix Marseille Université, Marseille, France
- 11 Centre Hospitalier Universitaire (CHU) de Nantes, INSERM CIC 1413, Maladies Infectieuses et Tropicales, Centre de Prévention des Maladies Infectieuses et Transmissibles, Nantes, France
- 12 Département des Maladies Infectieuses et Tropicales, Hôpital de la Croix-Rousse, Hospices Civils de Lyon, Centre International de Recherche en Infectiologie (CIRI), INSERM U1111, Université Claude Bernard Lyon I, CNRS, UMR5308, École Normale Supérieure de Lyon, Université Lyon, Lyon, France
- 13 CIC 1409, INSERM–Hôpitaux Universitaires de Marseille–Aix Marseille Université, Hôpital de la Conception, Marseille, France
- 14 Centre de Vaccination CHU de Tours, CIC 1415, INSERM, Centre Hospitalier Régional et Universitaire de Tours, Tours, France
- 15 Service d’Immunologie Clinique et Maladies Infectieuses, AP-HP, Hôpital Henri Mondor, Créteil, Centre d’Investigation Clinique 1430 INSERM, AP-HP, Hôpital Henri Mondor, Créteil, France
- 16 CIRI, INSERM U1111, Université Claude Bernard Lyon I, Lyon, CHU Lyon-Sud, Pierre-Bénite, France
- 17 Service de Maladies Infectieuses, CHU de Caen, Dynamicure INSERM UMR 1311, Normandie Université, University of Caen Normandy, Caen, France
- 18 Université Paris Cité, AP-HP, Hôpital Saint-Louis, Centre d’Investigations Cliniques, INSERM, CIC 1427, Paris, France
- 19 Virulence Bactérienne et Maladies Infectieuses, INSERM U1047, Department of Infectious and Tropical Diseases, CHU 37 Nîmes, Université de Montpellier, Nîmes, France
- 20 INSERM CIC 1434, CHU Strasbourg, Strasbourg, France
- 21 CIC, INSERM CIC1405, CHU Clermont-Ferrand, Clermont-Ferrand, France
- 22 CIC 1412, INSERM, CHU Brest, Brest, France
- 23 INSERM CIC 1408, Axe Vaccinologie, CHU de Saint-Étienne, Service d’Infectiologie, Saint-Étienne, France
- 24 INSERM U955, Vaccine Research Institute, Créteil, France
- 25 INSERM 101, Paris, France
- 26 AP-HP, Hôpital Européen Georges Pompidou, INSERM U970, Paris Cardiovascular Research Center, Université Paris Cité, Paris, France
- 27 INSERM, U1111, CNRS, UMR 5308, CIRI-GIMAP, Université Claude Bernard Lyon 1, Université Jean Monnet, Immunology and Immunomonitoring Laboratory, iBiothera, CIC 1408, Saint-Étienne, France
Question Can intramuscularly administered messenger RNA vaccines induce mucosal immunity?
Findings In this cohort study of 427 vaccinated individuals, a modest increase in spike-specific IgA levels in saliva of SARS-CoV-2–naive individuals having received the Moderna or Pfizer-BioNTech messenger RNA vaccines was observed using ultrasensitive digital enzyme-linked immunosorbent assay. This increase persisted after Moderna vaccination, and previously infected individuals demonstrated a stronger mucosal IgA response to vaccination.
Meaning Specific salivary IgA can be detected after messenger RNA vaccination solely, but to much lower levels than in previously infected individuals.
Importance There is still considerable controversy in the literature regarding the capacity of intramuscular messenger RNA (mRNA) vaccination to induce a mucosal immune response.
Objective To compare serum and salivary IgG and IgA levels among mRNA-vaccinated individuals with or without previous SARS-CoV-2 infection.
Design, Setting, and Participants In this cohort study, SARS-CoV-2–naive participants and those with previous infection were consecutively included in the CoviCompare P and CoviCompare M mRNA vaccination trials and followed up to day 180 after vaccination with either the BNT162b2 (Pfizer-BioNTech) vaccine or the mRNA-1273 (Moderna) vaccine at the beginning of the COVID-19 vaccination campaign (from February 19 to June 8, 2021) in France. Data were analyzed from October 25, 2022, to July 13, 2023.
Main Outcomes and Measures An ultrasensitive digital enzyme-linked immunosorbent assay was used for the comparison of SARS-CoV-2 spike-specific serum and salivary IgG and IgA levels. Spike-specific secretory IgA level was also quantified at selected times.
Results A total of 427 individuals were included in 3 groups: participants with SARS-CoV-2 prior to vaccination who received 1 single dose of BNT162b2 (Pfizer-BioNTech) (n = 120) and SARS-CoV-2–naive individuals who received 2 doses of mRNA-1273 (Moderna) (n = 172) or 2 doses of BNT162b2 (Pfizer-BioNTech) (n = 135). The median age was 68 (IQR, 39-75) years, and 228 (53.4%) were men. SARS-CoV-2 spike-specific IgG saliva levels increased after 1 or 2 vaccine injections in individuals with previous infection and SARS-CoV-2–naive individuals. After vaccination, SARS-CoV-2–specific saliva IgA levels, normalized with respect to total IgA levels, were significantly higher in participants with previous infection, as compared with the most responsive mRNA-1273 (Moderna) recipients (median normalized levels, 155 × 10 −5 vs 37 × 10 −5 at day 29; 107 × 10 −5 vs 54 × 10 −5 at day 57; and 104 × 10 −5 vs 70 × 10 −5 at day 180 [ P < .001]). In contrast, compared with day 1, spike-specific IgA levels in the BNT162b2-vaccinated SARS-CoV-2–naive group increased only at day 57 (36 × 10 −5 vs 49 × 10 −5 [ P = .01]). Bona fide multimeric secretory IgA levels were significantly higher in individuals with previous infection compared with SARS-CoV-2–naive individuals after 2 antigenic stimulations (median optical density, 0.36 [IQR, 0.16-0.63] vs 0.16 [IQR, 0.10-0.22]; P < .001).
Conclusions and Relevance The findings of this cohort study suggest that mRNA vaccination was associated with mucosal immunity in individuals without prior SARS-CoV-2 infection, but at much lower levels than in previously infected individuals. Further studies are needed to determine the association between specific saliva IgA levels and prevention of infection or transmission.
IgA is monomeric in human serum but is also produced locally in mucosal tissues mostly under dimeric or even polymeric forms and released associated with the secretory component as secretory IgA (SIgA). 1 Monomeric IgA is also present in saliva following passive transport from blood. 1 Saliva represents an easily accessible body fluid permitting probing of IgA mucosal immunity. Sterlin et al 2 previously showed that potent SARS-CoV-2–neutralizing IgA antibodies are rapidly produced following infection, even before IgG antibodies, although their levels decline and fail to be detected in saliva around 6 months after symptom onset. Recent studies 3 , 4 suggest that SARS-CoV-2 spike-specific mucosal IgA antibodies could provide protection against breakthrough infection. However, it remains unclear whether messenger RNA (mRNA)–based vaccines can induce such SIgA responses. Several studies conclude that humoral mucosal immunity is largely driven by previous infection, with little impact of vaccination, 4 - 6 while others suggest that mRNA vaccination can by itself elicit long-lasting anti–SARS-CoV-2 mucosal IgA responses. 7 - 11 Herein, we compared individuals with previous SARS-CoV-2 infection and SARS-CoV-2–naive individuals included in the CoviCompare P and CoviCompare M vaccination trials 12 for their saliva and serum responses after 2 different modes of antigenic challenge: infection and vaccination or vaccination alone.
The CoviCompare P and CoviCompare M trials received ethical approval from Comité De Protection des Personnes Ile De France 1. All participants provided written informed consent. The study followed the Strengthening the Reporting of Observational Studies in Epidemiology ( STROBE ) reporting guideline.
From February 19 to June 8, 2021, participants without prior SARS-CoV-2 infection received either 2 doses of the mRNA-1273 (Moderna) vaccine in the CoviCompare M trial or the BNT162b2 (Pfizer-BioNTech) vaccine in the CoviCompare P trial at 28 days apart, whereas participants with a documented prior SARS-CoV-2 infection and positive serologic findings received only 1 dose of BNT162b2 (Pfizer-BioNTech) in accordance with the French guidelines at the time. In each trial, participants were healthy adults in stable medical condition. Samples were collected at multiple times: before the first vaccine administration (day 1), before the second vaccine administration (day 29), 28 days after the second vaccine dose (day 57), and 6 months after the first dose (day 180). Saliva was collected in a cup and serum was collected by venipuncture. All biospecimen were stored at −80°C prior to analysis.
Overall, 180 and 267 patients were included in the CoviCompare M and P trials, respectively. For the purpose of mucosal antibody analyses, 20 patients were excluded because (1) the second vaccine dose was delayed by more than 14 days after the planned date (n = 2); (2) anti–nucleocapsid levels were either missing before day 180 or were above the positivity threshold (n = 13); or (3) a SARS-CoV-2 infection was documented (using polymerase chain reaction analysis) at any time until day 180 (n = 5).
After these exclusions, 427 participants were included in these analyses, among whom 120 had a documented SARS-CoV-2 infection at least 5 months prior to their single dose of BNT162b2 vaccine (Pfizer-BioNTech) at the beginning of the pandemic, therefore at a period when only ancestral wild-type SARS-CoV-2 (D614G) was circulating in France ( Table ). The remaining 307 patients had no prior SARS-CoV-2 infection and received either 2 doses of mRNA-1273 (Moderna) (n = 172) or 2 doses of BNT162b2 (Pfizer-BioNTech) (n = 135).
For quantification of total IgA levels, high-binding 96–half-well plates (2310M; Nunc) were coated overnight at 4°C with 4 μg/mL of polyclonal goat anti–human IgA (I1261; Sigma-Aldrich) in phosphate-buffered solution (PBS). Serial dilutions of saliva in 5% skim milk in PBS, supplemented with 0.1% polysorbate 20 (Tween 20; Sigma-Aldrich), were added and plates were subsequently incubated for 1.5 hours at room temperature. Plates were then washed and incubated for 1 hour at room temperature with horseradish peroxidase (HRP)–conjugated polyclonal goat anti–human IgA (A0295; Sigma-Aldrich) diluted at 1:10 000 in PBS 5% milk. Bound antibodies were detected using tetramethylbenzidine substrate (T0440; Sigma-Aldrich). The color reaction was stopped with 0.5M sulfuric acid (H 2 SO 4 ) after a 10-minute incubation, and the absorbance was measured at 450 nm in an enzyme-linked immunosorbent assay (ELISA) plate reader (Varioskan; Thermo Fisher Scientific Inc). Serial dilutions of prequantified saliva pool and monoclonal IgA were used for the generation of standard curves and measurement of concentration.
For measurement of total IgG, goat antihuman IgG Fc fragment antibody (A80-104A; Bethyl Laboratories) was coated overnight at 4°C (100 μL per well at 1 μg/mL in PBS) in 96-well plates (Immuno Maxisorp plates; Nunc). Plates were blocked for 1 hour in combined PBS and 3% bovine serum albumin, and a 500-fold dilution of saliva in combined PBS–3% bovine serum albumin was added and incubated for 1 hour at room temperature. Plates were washed 5 times with PBS–0.5% polysorbate 20 (Sigma-Aldrich) and incubated for 1 hour at room temperature with goat anti–human IgG Fc fragment HRP conjugated (A80-104P; Bethyl Laboratories) diluted to 1:150 000. After washing, 100 μL of tetramethylbenzidine (002023; Life Technologies) was added to each well, the reaction was stopped with 50 μL of 0.5M H 2 SO 4 after 10 minutes of incubation, and the absorbance was measured at 450 nm in a microplate reader. Calculation of individual IgG concentrations was based on standard curves prepared with a commercial standard (N Protein Standard SL, model OQIM13; Siemens Healthcare Diagnostics AG).
Serum samples were tested for anti–SARS-CoV-2 IgG and IgA antibodies directed against the S1 domain of the spike protein of the virus using a commercial ELISA kit (EUROIMMUN). The kit is based on the detection of the Wuhan spike protein. Quantitative results were expressed in standardized units (binding antibody units [BAU] per milliliter). Serum IgG levels against SARS-CoV-2 nucleocapsid protein were detected using the V-PLEX COVID-19 serology kit (Meso Scale Discovery) and interpreted according to the manufacturer’s instructions.
SARS-CoV-2 spike IgG antibody levels were measured as previously described 13 , 14 by using a SARS-CoV-2 spike IgG assay (Simoa Advantage kit; Quanterix Corporation) on the SR-X Platform (Quanterix Corporation) according to the manufacturer’s instructions. Saliva samples were diluted 100-fold in sample diluent provided in the kit. We used an ultrasensitive digital ELISA for the measurement of specific anti–SARS-CoV-2 spike IgA mucosal responses, which allowed a better discrimination from background signals than classical ELISA performed in parallel on the same samples. The SARS-CoV-2 spike IgA antibody assay was developed using reagents provided in the SARS-CoV-2 spike IgG assay kit (Quanterix Corporation). Saliva samples were diluted 100-fold in sample diluent plus 0.5% polysorbate 20. Biotinylated antihuman IgA (clone REA1014; Miltenyi Biotec) diluted in sample diluent at 100 ng/mL was used as detector reagent. Streptavidin-β-galactosidase (SβG) was diluted to 25 pM in SβG diluent (SR-X 103158; Quanterix Corporation). Calibrator reagent consisted of recombinant anti–SARS-CoV-2 spike IgA (clone CR3022; Diaclone) diluted in sample diluent in a 4-fold dilution series (range, 0.05-200 ng/mL). Signals are expressed in BAU per milliliter. The lower limit of quantification was estimated to be 10 BAU/mL (eMethods in Supplement 1 ).
To avoid biases related to the fact that total IgA concentration within saliva is variable in samples from the same individual collected at different times, depending on various factors such as mode of sample collection and stress, 1 we normalized SARS-CoV-2 spike-specific IgA and IgG titers to the total IgA and IgG concentrations, respectively, within each saliva sample. Normalization of SARS-CoV-2 spike-specific saliva antibodies was calculated as follows: Normalized IgG = Anti–spike IgG/Total IgG and Normalized IgA = Anti–spike IgA/Total IgA.
To compare the best response in saliva samples among SARS-CoV-2–naive participants (ie, the group receiving mRNA-1273 vaccine) with individuals who had a previous infection, for secretory piece-bound SIgA only, we selected groups exposed to 2 antigenic stimulations: previous infection and SARS-CoV-2–naive individuals after a single or a second injection, respectively. High-binding 96–half-well plates (2310M) were coated overnight at 4°C with 1 μg/mL of S1 spike protein (Wuhan strain) in carbonate coating buffer. Saturation of the coated plates were performed with 5% skim milk in PBS during 90 minutes at 37°C. Serial dilutions of saliva in 5% skim milk in PBS supplemented with 0.1% polysorbate 20 were added, and plates were subsequently incubated overnight at 4°C. Plates were then washed and incubated for 1 hour at room temperature with mouse antihuman secretory piece (1:1000 dilution; MilliporeSigma). After washing, plates were then revealed with HRP-conjugated polyclonal goat antimouse IgG (Invitrogen). Bound antibodies were detected using tetramethylbenzidine substrate (T0440; Sigma-Aldrich). The color reaction was stopped with 0.5M H 2 SO 4 after 10-minute incubation, and the absorbance was measured at 450 nm in an ELISA plate reader (Varioskan).
Data were analyzed from October 25, 2022, to July 13, 2023. Data were expressed as medians (IQRs) for continuous data and as frequencies and proportions for categorical data. For specific IgG and IgA levels, we computed a cutoff arbitrarily set at the mean plus 1 SD of measurements performed at baseline in SARS-CoV-2–naive participants. Comparisons between groups were performed using the Wilcoxon rank sum test (with stratification on age as sensitivity analysis) and Fisher exact test for categorical data. Within groups, comparisons between different times were performed using Wilcoxon rank sum test for paired data or McNemar test for proportions of participants above threshold. Fold changes of the geometric means were estimated with their 95% CI. All tests were performed on log 10 -transformed data at the 2-sided 5% significance level ( P < .05). Correlations between salivary and serum antibody levels were estimated using the Spearman correlation coefficient. All calculations were performed using R software, version 4.1.1 (R Program for Statistical Computing).
We included 427 participants at the beginning of the pandemic, a period when only ancestral wild-type SARS-CoV-2 (D614G) was circulating in France. Of these, 120 participants had a documented SARS-CoV-2 infection prior to their single dose of BNT162b2 vaccine. The median age was 68 (IQR, 39-75) years; 228 participants (53.4%) were men and 199 (46.6%) were women. Race and ethnicity data were not collected, in conformity to French law.
Serum baseline SARS-CoV-2 spike-specific IgG and IgA levels ( Figure 1 and eTable 1 in Supplement 1 ) were elevated in individuals with previous infection and increased to higher levels following vaccination, compared with SARS-CoV-2–naive individuals. Among SARS-CoV-2–naive patients, at all times following vaccination, serum anti–spike IgG and IgA levels were significantly higher in the mRNA-1273 compared with the BNT162b2 groups (IgG: 285.4 vs 117.5 BAU/mL at day 29, 2090.9 vs 1292.4 BAU/mL at day 57, and 395.4 vs 247.9 BAU/mL at day 180 [ P < .001 for all comparisons]; IgA: 217.1 vs 74.4 BAU/mL at day 29, 603.9 vs 249.4 BAU/mL at day 57, and 119.2 vs 63.0 BAU/mL at day 180 [ P < .001 for all comparisons]) ( Figure 1 ).
A significant increase in specific IgG saliva levels was mostly detected after vaccination in previously infected individuals, but also in SARS-CoV-2–naive individuals after each injection ( Figure 2 ). Levels of salivary and serum anti–spike IgG antibodies were correlated in all 3 groups and at all times measured (eFigure 1 in Supplement 1 ), consistently with the known predominant systemic origin of saliva IgG. 1
The highest levels of SARS-CoV-2 spike-specific saliva IgA were detected in patients with previous infection 1 month after vaccination and slightly declined afterward (medians of normalized levels: 155 × 10 −5 [IQR, 69 × 10 −5 to 387 × 10 −5 ] at day 29; 107 × 10 −5 [IQR, 63 × 10 −5 to 217 × 10 −5 ] at day 57; and 104 × 10 −5 [61 × 10 −5 to 208 × 10 −5 ] at day 180) ( Figures 1 and 3 and eTable 2 in Supplement 1 ). Levels were lower in SARS-CoV-2–naive recipients of the mRNA-1273 vaccine (37 × 10 −5 [IQR, 23 × 10 −5 to 71 × 10 −5 ] at day 29; 54 × 10 −5 [IQR, 31 × 10 −5 to 90 × 10 −5 ] at day 57; and 70 × 10 −5 [IQR, 41 × 10 −5 to 118 × 10 −5 ] at day 180 [ P < .001]). Levels of serum anti–spike IgA were better correlated with salivary-specific IgA among individuals with previous infection (remaining at day 180), rather than that of individuals without a prior infection (eFigure 1 in Supplement 1 ). In the latter groups, the correlation between blood and saliva IgA levels remained weak, with correlation coefficients substantially smaller than in individuals with previous infection (eFigure 1 in Supplement 1 ).
SARS-CoV-2 spike-specific saliva IgA levels remained more elevated 180 days after vaccination in individuals with previous infection compared with mRNA-1273–vaccinated individuals (104 × 10 −5 [IQR, 61 × 10 −5 to 208 × 10 −5 ] vs 70 × 10 −5 [IQR, 41 × 10 −5 to 118 × 10 −5 ]; P < .001) ( Figure 1 and eTable 2 in Supplement 1 ). In individuals without prior infection, compared with day 1, increases of specific salivary IgA levels were substantially smaller, particularly after BNT162b2 vaccination, reaching statistical significance only at day 57 (36 × 10 −5 [IQR, 19 × 10 −5 to 79 × 10 −5 ] vs 49 × 10 −5 [IQR, 25 × 10 −5 to 103 × 10 −5 ]; P = .01) ( Figure 3 ). In mRNA-1273–vaccinated individuals, specific saliva IgA levels increased significantly, albeit modestly, after the first (day 29 vs day 1, 1.4-fold [95% CI, 1.3- to 1.6-fold] change of geometric mean; P < .001) (eTable 3 in Supplement 1 ) and second vaccine doses (day 57 vs day 29, 1.3-fold [95% CI 1.1- to 1.5-fold] change of geometric mean; P < .001) ( Figure 3 and eTable 3 in Supplement 1 ). In parallel, specific serum IgA levels increased in the same participants by 64.5-fold at day 29 vs day 1 (95% CI, 54.8- to 75.8-fold) and 182.6-fold at day 57 vs day 1 (95% CI, 154.3- to 216.1-fold) (eTable 1 in Supplement 1 ). Similar to IgG, salivary anti–spike IgA levels were significantly higher at day 180 in the mRNA-1273 group, compared with the BNT162b2 group (70 × 10 −5 [IQR, 41 × 10 −5 to 118 × 10 −5 ] vs 43 × 10 −5 [IQR, 24 × 10 −5 to 84 × 10 −5 ]; P < .001) ( Figure 1 ). By definition, anti–nucleocapsid IgG levels were below the positivity threshold in individuals assigned to the mRNA-1273 group. Nevertheless, to verify whether asymptomatic infections might explain the late increase in anti–spike saliva IgA in the mRNA-1273 group, we split individuals in 2 groups according to anti–nucleocapsid IgG levels (SARS-CoV-2 nucleocapsid is not encoded by mRNA vaccines). As shown, anti–spike saliva IgA levels were not significantly elevated in individuals with anti–nucleocapsid serum IgG levels at day 180 above the 90th percentile of the distribution, compared with the others (eFigure 2 in Supplement 1 ). In conclusion, we did not find evidence that asymptomatic infections might explain the late increase in anti–spike saliva IgA in the mRNA-1273 group.
Finally, we verified whether bona fide mucosal secretory IgA could be locally induced at similar levels in SARS-CoV-2–naive individuals and those with previous infections by comparing SIgA levels at their peak of response in both groups (ie, days 57 and 29, respectively). As shown ( Figure 4 and eTable 4 in Supplement 1 ), spike-specific SIgA levels were significantly more elevated in previously infected individuals (median optical density, 0.36 [IQR, 0.16-0.63] vs 0.16 [IQR, 0.10-0.22]; P < .001). Age-stratified Wilcoxon rank sum tests as sensitivity analyses for the comparisons between individuals with previous infection and SARS-CoV-2–naive individuals produced similar results as nonstratified tests, suggesting that differences between these groups were not confounded by age.
In this cohort study, we compared individuals with previous SARS-CoV-2 infection and SARS-CoV-2–naive individuals included in 2 large vaccination trials for their saliva and serum IgA and IgG antibody responses. Importantly, we limited the study to individuals vaccinated at the beginning of the pandemic to select a substantial number of confirmed SARS-CoV-2–naive participants to be included in the study.
Since SARS-CoV-2 infection became extremely prevalent in Europe and in the US, we speculate that some of the previous inconsistencies reported in the literature 3 - 11 on saliva IgA responses might relate to difficulties recruiting participants who were truly SARS-CoV-2 naive. Many SARS-CoV-2 infections are indeed asymptomatic and even more so in the recent phases of virus circulation. 15 Furthermore, infections do not always leave a lasting serologic signature. 15 A recent study 11 including a proportion of individuals with a history of SARS-CoV-2 infection concluded that mRNA vaccination induces by itself a robust mucosal antibody production. In this study, more robust responses were induced primarily in participants with previous infection ( Figures 1 and 3 ).
However, a modest but significant increase in specific saliva IgA levels was observed in SARS-CoV-2–naive individuals receiving mRNA-1273 (Moderna) after the first and second administrations ( Figure 1 and eTable 3 in Supplement 1 ). In parallel, specific serum IgA levels increased by 64.5-fold in the same participants (eTable 1 in Supplement 1 ). The correlations observed between serum and saliva IgA levels (eFigure 1 in Supplement 1 ) do not imply a blood origin for salivary IgA. Since the digital ELISA used in the study detects total anti–spike IgA, encompassing SIgA and possibly monomeric blood-borne IgA, we also measured electively secretory piece-bound SIgA to verify that bona fide SIgA levels were detected both in SARS-CoV-2–naive individuals and those with previous infection. However, specific SIgA levels were significantly more elevated in individuals with previous infection compared with SARS-CoV-2–naive individuals who received 2 antigenic stimulations ( Figure 4 ).
Interestingly, we noted that anti–spike saliva IgA levels significantly increased between days 57 and 180 in the mRNA-1273 group ( Figures 1 and 3 ), corresponding to an increase from 40 of 164 individuals (24%) to 55 of 159 (35%) with specific IgA levels above threshold ( Figure 3 ). We reasoned that such a late variation could be related to asymptomatic SARS-CoV-2 infections. Data pertaining to anti–nucleocapsid saliva levels, by definition always below detection threshold in infection-naive individuals, were available to test that hypothesis. We found no correlation between anti–spike saliva IgA and serum anti–nucleocapsid IgG levels (eFigure 2 in Supplement 1 ) that could have pointed in the direction of asymptomatic infections to explain a late increase in anti–spike saliva IgA levels in the mRNA-1273 vaccine group. It appears unlikely as well that late seronegative SARS-CoV-2 infections would have only occurred in the same latter group. Finally, our observation that specific serum and saliva IgA levels were significantly higher in SARS-CoV-2–naive individuals at day 180 after vaccination with mRNA-1273 (Moderna) compared with BNT162b2 (Pfizer-BioNTech) ( Figure 1 ) coincides with reports of more elevated antibody responses, which are associated with slightly lower hospitalization rates in the former group. 16 , 17
This study has some limitations. We cannot determine whether the discrete increase in specific SIgA observed in some SARS-CoV-2–naive vaccinations is the result of asymptomatic or seronegative exposures to respiratory virus, mucosal seeding by rare antibody-secreting cells trafficking from vaccine-draining lymph nodes, or both. In addition, we did not include data on neutralizing antibodies; however, prior studies 2 , 18 suggest that specific antibody levels are strongly correlated. The number of vaccine breakthrough cases reported in our cohort was too limited to address the association between SIgA levels and prevention of infection or transmission of SARS-CoV-2.
The findings of this cohort study suggest that mRNA vaccination was associated with mucosal immunity in individuals with prior SARS-CoV-2 infection. Further studies are needed to determine the association between SIgA levels and prevention of infection or transmission.
Accepted for Publication: February 26, 2024.
Published: April 23, 2024. doi:10.1001/jamanetworkopen.2024.8051
Open Access: This is an open access article distributed under the terms of the CC-BY License . © 2024 Gorochov G et al. JAMA Network Open .
Corresponding Authors: Guy Gorochov, MD, PhD, Sorbonne Université, Centre d’Immunologie et des Maladies Infectieuses, Institut National de la Santé et de la Recherche Médicale (INSERM), Assistance Publique–Hôpitaux de Paris, Hôpital Pitié-Salpêtrière, 83 Boulevard de l’Hôpital, 75013 Paris, France ( [email protected] ); Stéphane Paul, PhD, Laboratoire d’Immunologie et d’Immunomonitoring, Centre d’Investigation Clinique, 1408 INSERM/Agence Nationale de Recherches sur le Sida Vaccinologie, Faculté de Médecine, 10 Rue de la Marandière, 42270 Saint-Priest-en-Jarez, France ( [email protected] ).
Author Contributions: Drs Gorochov and Ropers had full access to all of the data in the study and take responsibility for the integrity of the data and the accuracy of the data analysis.
Concept and design: Gorochov, Ropers, Launay, Durier, Desaint, Vieillard, Lachatre, Parfait, Hupé, Ninove, Kieny, Tartour, Paul.
Acquisition, analysis, or interpretation of data: Gorochov, Ropers, Launay, Dorgham, da Mata-Jardin, Lebbah, Bauer, Radenne, Vieillard, Rekacewicz, Batteux, Ninove, Lefebvre, Conrad, Dussol, Maakaroun-Vermesse, Melica, Nicolas, Verdon, Kiladjian, Loubet, Schmidt-Mutter, Dualé, Ansart, Botelho-Nevers, Lelièvre, de Lamballerie, Tartour, Paul.
Drafting of the manuscript: Gorochov, Ropers, Lebbah, Desaint, Parfait, Tartour, Paul.
Critical review of the manuscript for important intellectual content: Gorochov, Ropers, Launay, Dorgham, da Mata-Jardin, Durier, Bauer, Radenne, Vieillard, Rekacewicz, Lachatre, Batteux, Hupé, Ninove, Lefebvre, Conrad, Dussol, Maakaroun-Vermesse, Melica, Nicolas, Verdon, Kiladjian, Loubet, Schmidt-Mutter, Dualé, Ansart, Botelho-Nevers, Lelièvre, de Lamballerie, Kieny, Tartour, Paul.
Statistical analysis: Ropers, Lebbah, Durier, Bauer, Tartour, Paul.
Obtained funding: Gorochov, Launay, Radenne, de Lamballerie, Kieny, Tartour.
Administrative, technical, or material support: Gorochov, Ropers, Launay, da Mata-Jardin, Radenne, Vieillard, Rekacewicz, Parfait, Batteux, Hupé, Ninove, Lefebvre, Nicolas, Botelho-Nevers, Lelièvre, de Lamballerie, Paul.
Supervision: Gorochov, Ropers, Launay, Vieillard, Kiladjian, Paul.
Conflict of Interest Disclosures: Dr Launay reported receiving nonfinancial support from Pfizer Inc, MSD, Sanofi SA, and AstraZeneca, grant funding from Moderna Inc, Pfizer Inc, MSD, Sanofi SA, and AstraZeneca, and personal fees from Moderna Inc, Pfizer Inc, MSD, Sanofi SA, and AstraZeneca outside the submitted work. Dr Conrad reported consulting for Pfizer Inc and Moderna Inc outside the submitted work. Dr Schmidt-Mutter reported receiving financial support for personal and material investigation from Assistance Publique–Hôpitaux de Paris (AP-HP) outside the submitted work. Dr Dualé reported receiving grant funding from INSERM during the conduct of the study. Dr Botelho-Nevers reported participating on the scientific advisory boards for Pfizer Inc, Moderna Inc, Sanofi SA, and Janssen Global Services LLC outside the submitted work. Dr de Lamballerie reported receiving grant funding from the French Ministry of Research during the conduct of the study. No other disclosures were reported.
Funding/Support: The CoviCompare M and CoviCompare P trials have been supported by the Ministère des Solidarités et de la Santé and Ministère de l’Enseignement Supérieur, de la Recherche et de l’Innovation. In addition, the CoviCompare P trial was supported by ANRS Maladies Infectieuses Émergentes and the CoviCompare M trial was supported by AP-HP.
Role of the Funder/Sponsor: The funders had no role in the design and conduct of the study; collection, management, analysis, and interpretation of the data; preparation, review, or approval of the manuscript; and decision to submit the manuscript for publication.
Disclaimer: The views expressed in this article are those of the authors and do not necessarily reflect the opinions of the French research and public health institutions with which they are affiliated.
Data Sharing Statement: See Supplement 2 .
Additional Contributions: The authors are grateful to the volunteers included in CoviCompare M and CoviCompare P trials and clinical participating centers. This study has been labeled as a National Research Priority by the National Orientation Committee for Therapeutic Trials and other research on COVID-19 (CAPNET). The investigators would like to acknowledge ANRS Maladies Infectieuses Émergentes for their scientific support, the French Ministry of Health and Prevention, and the French Ministry of Higher Education, Research and Innovation for their funding and support.
- Register for email alerts with links to free full-text articles
- Access PDFs of free articles
- Manage your interests
- Save searches and receive search alerts
Internet Explorer lacks support for the features of this website. For the best experience, please use a modern browser such as Chrome, Firefox, or Edge.

National Marine Mammal Stranding Response Network
The U.S. Marine Mammal Stranding Response Network responds to live stranded, sick, injured, out of habitat, or entangled marine mammals, and investigates dead stranded marine mammals.
Table of Contents
What is a stranding, objectives of the stranding network, marine mammal strandings, safety first, animal welfare, importance to conservation, funding for stranding responses, what can you do, regional programs, more information.

Marine mammals are important indicators of ocean, climate, and human health. They tell us a great deal about environmental changes, especially those caused by humans. NOAA Fisheries’ Marine Mammal Health and Stranding Response Program authorizes and oversees the U.S. Marine Mammal Stranding Response Network. There are more than 120 partner organizations in the Network, including:
- Non-profits
- Zoos and aquaria
- Academic institutions
- Government agencies (federal, tribal, state, and local)
These organizations are composed of trained and experienced responders and veterinarians. They are authorized under the Marine Mammal Protection Act to respond to—and in some cases rehabilitate—stranded marine mammals. Most organizations are authorized to conduct this important work through stranding agreements issued by NOAA Fisheries. Some individuals are authorized through their capacity as federal, tribal, state, or local government employees.
NOAA Fisheries is responsible for conserving and recovering all cetaceans (whales, dolphins, and porpoises) and pinnipeds (seals, fur seals, sea lions).

A “stranding” occurs when a marine mammal is:
- Dead, whether found on the beach or floating in the water
- Alive on a beach but unable to return to the water
- Alive on a beach and in need of apparent medical attention
- Alive, in the water, and unable to return to its natural habitat without assistance
Not all pinnipeds on the beach are stranded. Seals, fur seals, and sea lions spend time on the beach to rest, molt, and breed.
Marine mammals strand for a variety of reasons. Results from examinations and necropsies (animal autopsies) show common causes of strandings, include:
- Infectious diseases due to parasites, bacteria, fungi, and viruses
- Non-infectious diseases, including cancer
- Harmful algal blooms and associated biotoxins
- Injuries due to vessel collisions, entanglement in active and derelict fishing gear and marine debris, ingestion of marine debris, or other human interactions, such as gunshots
- Malnutrition
- Pollution exposure
- Separation of pups or calves from their mothers
- Human disturbance or harassment
- A combination of these or other factors
Some strandings may also be related to unusual weather or oceanographic events such as hurricanes and tropical storms or marine heatwaves . In many cases, the causes of a stranding event remain undetermined, especially when carcasses are found in advanced states of decomposition and examinations are limited.
The overarching goals of the U.S. Marine Mammal Stranding Response Network are to:
- Monitor, track, and investigate causes of marine mammal illness, injury, and death, as well as health trends over time, including the impacts of climate change
- Collect data from stranded marine mammals as a resource for scientific information, management decisions, and/or law enforcement investigations
- Minimize risks to public health and safety from stranded marine mammals (such as bites, disease transmission, etc.)
- Provide for the welfare of live stranded or otherwise distressed marine mammals in some cases
- Advance public education and engagement in ocean conservation
- Enhance the conservation and management of wild marine mammal populations and the wider marine ecosystem
The Stranding Network strives to return live stranded and rehabilitated animals to the wild when it is safe to do so for the individual animal and the wild populations. In some cases, such as when injuries are severe or the overall prognosis is poor, euthanasia is the most humane course of action. Some animals, such as those with chronic medical conditions that require long-term care, may be deemed non-releasable . Non-releasable animals are placed in permanent managed care to serve as ambassadors for their species.

Every marine mammal stranding event is unique and poses different challenges. The information we learn helps us understand ocean health and how marine mammals are responding to threats. Responses to abundant marine mammal species, such as California sea lions or bottlenose dolphins, provide for animal welfare and collect important data. These responses also keep the Stranding Network organizations trained and prepared for emergency events involving endangered and threatened species. In those cases, each individual animal can be critical to the overall population. Live animals that are rescued and rehabilitated provide additional valuable information on the biology, physiology, and health of those and related species. Necropsies provide valuable insight into causes of death, age and reproductive status, disease and contaminant exposure, physiology, and population health of species not readily observed in the wild.
The proper disposal of marine mammal carcasses is also an important aspect of marine mammal stranding response. Disposal methods vary based on the stranding. Stranding Network organizations consider several factors such as the number and size of the animal(s), carcass condition, stranding location, amount of drugs administered to the animal, and logistics. They determine the most appropriate disposal method for each carcass and follow all laws, regulations, and guidelines.

All stranding responses prioritize human safety to ensure the Stranding Network members and the public avoid injuries. Environmental conditions may become worse during the course of a response. A response may not always be considered safe and/or practical (e.g., animals rolling in the surf, scavenging, tides, light, etc.). Stranded marine mammals are large, wild, unpredictable, and may have diseases that are transmissible to people. For these reasons—as well as legal requirements—only trained and authorized responders should approach or pick up a stranded marine mammal . Over the past several decades, the Marine Mammal Health and Stranding Response Program has worked with the Stranding Network to develop and update best practices to follow in the field. They are based on lessons learned and evolving animal care techniques.

Stranded marine mammals are often sick or injured. The Stranding Network uses best practices, combined with nationally approved veterinary methods, to provide compassionate care and treatment to reduce pain and suffering when possible. These actions are conducted respectfully and, in some cases, can increase the likelihood of an animal surviving.

The Stranding Network provides data that are foundational to our science and management efforts for mitigating human interactions. This information is particularly important in our efforts to reduce bycatch in commercial fisheries or collisions with commercial or recreational vessels. These data are entered into the National Marine Mammal Stranding Database . This allows comparison of the causes of illness and death of stranded marine mammals with physical, chemical, and biological environmental parameters.
Data on marine mammal strandings directly informs our List of Fisheries and take reduction plans and teams . It justifies and provides evidence for agency policies and regulations, such as measures implemented to reduce vessel strikes (e.g., shipping lane changes, speed restrictions, implementation of Areas to be Avoided) as well as time-area closures and gear modifications. Marine mammal health data also inform marine mammal mortality and serious injury reports and stock assessments , which help us balance marine mammal conservation and fisheries management.
We also use marine mammal health data to:
- Investigate violations of environmental laws pertinent to marine mammals
- Monitor disease outbreaks or harmful algal blooms impacting marine mammals
- Determine when marine mammal Unusual Mortality Events are occurring and conduct effective investigations
- Monitor climate impacts on ecosystems
We fund a portion of eligible members of the U.S. Marine Mammal Stranding Response Network through the competitive Prescott Grant Program . Prescott grants help recipients:
- Respond and treat (i.e., rehabilitate) marine mammals
- Collect data from living or dead marine mammals for scientific research
- Improve facility operations dedicated to these purposes
Prescott Grants provide valuable support for Network members, but do not fully cover the cost of stranding network activities. They are not the sole source of funding for the organizations. Many stranding organizations are supported by their local communities and volunteers.
We need your help. The Marine Mammal Health and Stranding Response Program relies on reports of stranded marine mammals by the public to save animals in distress and understand causes of injuries and mortalities.
If you see a stranded marine mammal, do not attempt to touch or handle the animal. Immediately report it to your regional 24/7 hotline, which will connect you to your local stranding network organization:
- Alaska: (877) 925-7773
- Greater Atlantic: (866) 755-6622
- Pacific Islands: (888) 256-9840
- Southeast: (877) 942-5343
- West Coast: (866) 767-6114
When reporting a stranded marine mammal, include the following information:
- Date and time
- Location of stranding (including latitude and longitude, if known)
- Number of animals
- Condition of the animal (alive or dead)
- Species (if known)
Photos or video from different angles and from a safe and legal distance (note that regulations apply to certain species and areas) can provide valuable information to Stranding Network responders. While we make every effort to respond to each stranded marine mammal, sometimes it is not possible (e.g., when human safety would be compromised).
- New England/Mid-Atlantic
- Pacific Islands
- 2020 and 2021 Combined Report of Marine Mammal Strandings in the United States
- 2019 Report of Marine Mammal Strandings in the United States: National Overview
- 2018 Report of Marine Mammal Strandings in the United States: National Overview
- 2017 National Report of Marine Mammal Strandings in the United States
- Working Group on Marine Mammal Unusual Mortality Events
Last updated by Office of Protected Resources on 04/26/2024
Subscribe to our newsletter

MITRE Response to Cyber Attack in One of Its R&D Networks
To offer learnings from its experience, MITRE has published initial details about the incident via the Center for Threat-Informed Defense, found here .
McLean, Va., April 19, 2024 – MITRE today disclosed that despite its fervent commitment to safeguarding its digital assets, it experienced a breach that underscores the nature of modern cyber threats. After detecting suspicious activity on its Networked Experimentation, Research, and Virtualization Environment (NERVE), a collaborative network used for research, development, and prototyping, compromise by a foreign nation-state threat actor was confirmed.
Following detection of the incident, MITRE took prompt action to contain the incident, including taking the NERVE environment offline, and quickly launched an investigation with the support of in-house and leading third-party experts. The investigation is ongoing, including to determine the scope of information that may be involved.
MITRE has contacted authorities and notified affected parties and is working to restore operational alternatives for collaboration in an expedited and secure manner.
“No organization is immune from this type of cyber attack, not even one that strives to maintain the highest cybersecurity possible,” said Jason Providakes , president and CEO, MITRE. “We are disclosing this incident in a timely manner because of our commitment to operate in the public interest and to advocate for best practices that enhance enterprise security as well necessary measures to improve the industry’s current cyber defense posture. The threats and cyber attacks are becoming more sophisticated and require increased vigilance and defense approaches. As we have previously, we will share our learnings from this experience to help others and evolve our own practices.”
NERVE is an unclassified collaborative network that provides storage, computing, and networking resources. Based on our investigation to date, there is no indication that MITRE’s core enterprise network or partners’ systems were affected by this incident.
Hi, I'm Charles Clancy, Chief Technology Officer of MITRE.
In January this past year, over 1700 organizations were compromised by a sophisticated nation state threat actor.
This threat actor compromised the Ivanti Connect Secure appliance that's used to provide connectivity into some of our most trusted networks.
MITRE was one of those compromised. In the interest of transparency and public interest, we really want to share our experiences, so others can learn from it.
We took all the recommended actions from the vendor, from the U.S. government, but they were clearly not enough. As a result, we are issuing a call to action to the industry.
The threat has gotten more sophisticated, and so too must our solutions to combat that threat.
First, we need to advance secure by design principles. Hardware and software needs to be secure right out of the box.
Second, we need to operationalize secure supply chains by taking advantage of the software bill of materials ecosystem to understand the threats in our upstream software systems.
Third, we should deploy zero trust architectures, not just multi-factor authentication, but also micro-segmentation of our networks.
Fourth, we need to adopt adversary engagement as a routine part of cyber defense. It can provide not only detection, but also deterrence to our adversaries. Adversaries are advancing new threats and new techniques.
We need new solutions, and together we can develop and deploy those solutions, thank you.
As part of our cybersecurity research in the public interest, MITRE has a 50-plus-year history of developing standards and tools used by the broad cybersecurity community. With frameworks like ATT&CK ® , Engage ™ , D3FEND ™ , and CALDERA ™ and a host of other cybersecurity tools, MITRE arms the worldwide community of cyber defenders.
To offer learnings from its experience, MITRE has published initial details about the incident via the Center for Threat-Informed Defense, found here , and plans to release additional information as the investigation continues and concludes.
Media Contact:
Tracy Schario, [email protected]
IMAGES
VIDEO
COMMENTS
7. In Safari 12, select the row in the network tab. The response will be displayed in the main area. Above it will be a few tabs. Select the Headers tab and take a look in the request part of the displayed data for some request info. For details on the request data, take a look under "Request Data".
You can open by Safari Web Inspector by selecting Develop menu and click Show Web Inspectorbutton. Please refer to the following image for the above listed steps. 3. Open up Network tab. With web inspector opened, Navigate to Network tab and you can see the files requested over network. Select one of the requested items and go to its Headers ...
Powered by the WebKit engine, Safari offers a great set of built-in web development tools. ... Network. See a detailed list of all network requests made to load every web page resource, so you can quickly evaluate the response, status, timing, and more. ...
Step 3: Go to the Network Tab. Let's go to the Network Tab. Follow these steps: Click on the "Develop" menu in the Safari menu bar at the top of your screen. A dropdown menu will appear. Select "Connect Web Inspector"/"Show Web Inspector" from this menu. Access the Network Tab. Step 4: Go to the Network Tab.
In Safari, there are two ways to begin inspecting a webpage. The first is via the Develop menu. With the webpage you wish to inspect frontmost in Safari, go to the Develop menu and choose Show Web Inspector (⌥⌘I). Web Inspector will then appear, and will be inspecting the webpage. The second was to show Web Inspector is to right click on ...
In Technology Preview 118, Safari introduced a feature called Local Overrides. It enables web developers to customize network request and response activities from within the Safari developer tools…
Network Tab. The Network tab within Safari's Inspector is a vital tool for analyzing the network activity of web pages, providing valuable insights into the loading and transmission of resources. ... Whether you're analyzing network requests, fine-tuning performance, or validating response data, the Network tab equips you with the tools to ...
Method 1: Using Network Link Conditioner in iOS Device. Here's the step-by-step process to perform network throttling in Safari for testing purposes: Step 1 - Open Mac App Store and install "XCode". First, open the Mac App Store on your Mac. Search for "XCode" and install it on your Mac. Step 2 - Connect your iPhone to your Mac.
Let's open Safari and visit google.com and search for the team java and see what the request-response headers are, As you can see in the above gif example, right-click on the webpage and select "Inspect element", go to the network tab, you may see a lot of entries of all kind of files loaded: CSS, images, javaScript, etc, you can select the ...
There are currently 10 rule types available in Requestly.. Redirect Network Requests. Redirect Rule is used to redirect one URL to another URL. Example of common use cases could be: Test API version changes: Suppose there is a new version of some API which you are using.In order to test the backward compatibility of the API, you can just set up a redirect rule to redirect all URLs from older ...
To open the Web Console: or press the Ctrl+Shift+K ( Command+Option+K on OS X) keyboard shortcut. Network Logs in FireFox: Opening the Network Monitor: Press Ctrl + Shift + E ( Command + Option + E on a Mac). Select "Network" from the Web Developer menu, (which is a submenu of the Tools menu on OS X and Linux).
Reload the page. From the menu bar in Safari, choose View > Reload Page. Or press Command-R. If Safari doesn't reload the page, quit Safari, then try again. If Safari doesn't quit, you can press Option-Command-Esc to force Safari to quit. If Safari automatically reopens unwanted pages, quit Safari, then press and hold the Shift key while ...
Go to Settings > Safari. Tap Extensions > Turn OFF all extensions. Open a page again on Safari and check if it works. On Mac. Open the Safari browser, click on Safari > Preferences from the drop-down menu. Select the Extensions tab to view all installed extensions. Uncheck all the boxes next to extensions to disable them temporarily.
I understand from your post that you are receiving a message saying, "Safari cannot open the page because the network connection was lost." The following article has steps which may help to resolve this type of issue: If Safari displays a blank page or quits on your iPhone, iPad, or iPod touch - Apple Support. Best Regards. View in context.
Minimize the Web Inspector and then replicate the steps you took to reproduce the issue you are having with Panopto and Safari. Then, reopen the Web Inspector window. 1.6. In the Web Inspector, on the Network tab, right-click any empty space in the Name column, and select Export HAR or select the Export button from the upper right corner (Fig ...
Safari can't open the page "freenas.local" because the server unexpectedly dropped the connection. This sometimes occurs when the server is busy. Wait for a few minutes, and then try again." (Trying again doesn't help.) Firefox, Chrome: connect successfully, via http. via https, to https://freenas.local. Safari: "Safari can't connect to the ...
Creating Local Overrides. Local Overridescan be created in a few ways: Clicking the [Create Local Override] button when viewing the contents of a resource that was loaded from the network. This will show a dropdown with Create Request Local override, Create Response Local Override, and Block Request URL. Right-clicking on links or tree items ...
The server must grant access to the requested resource to your remote domain by sending a Access-Control-Allow-Origin response header. In Safari 12, select the row in the network tab. The response will be displayed in the main area. Above it will be a few tabs.
Safari was sending an initial request to fetch the video with a Range header set to bytes=0-1. ... from either the cache or network response, the real work starts. The Range header looks like:
The {urls: ["<all_urls>"]} pattern means you intercept HTTP requests to all URLs. To test it: Install the extension. Open the Browser Console (use Ctrl + Shift + J) Enable Show Content Messages in the menu: Open some web pages. In the Browser Console, you should see the URLs for any resources the browser requests.
To compare the best response in saliva samples among SARS-CoV-2-naive participants (ie, the group receiving mRNA-1273 vaccine) with individuals who had a previous infection, for secretory piece-bound SIgA only, we selected groups exposed to 2 antigenic stimulations: previous infection and SARS-CoV-2-naive individuals after a single or a ...
All stranding responses prioritize human safety to ensure the Stranding Network members and the public avoid injuries. Environmental conditions may become worse during the course of a response. A response may not always be considered safe and/or practical (e.g., animals rolling in the surf, scavenging, tides, light, etc.).
Michael Douglas, who plays "Franklin" in the Apply TV+ series, says Joe Biden is not too old for a second term despite being close in age to the President.
Apparently, the issue was that I had the submit button defined using <button onClick={this.doSave} > Save Changes </button> This has a default type of submit so there was a race condition as Safari/Firefox attempted to submit the form. Adding type="button" to the button tag took care of that issue and everything works as expected.
New York, NY —Seven months after Tropical Storm Ophelia inundated New York City with over eight inches of rain, Comptroller Brad Lander released findings of his office's investigation into the City's handling of the storm, along with key recommendations for New York City agencies to better prepare for extreme weather and flooding conditions. . The investigation, Is New York City Ready ...
McLean, Va., April 19, 2024 - MITRE today disclosed that despite its fervent commitment to safeguarding its digital assets, it experienced a breach that underscores the nature of modern cyber threats. After detecting suspicious activity on its Networked Experimentation, Research, and Virtualization Environment (NERVE), a collaborative network used for research, development, and prototyping ...