

Pages Per Visit (PPV) – A Simple Guide

January 30, 2024
Share This Article:
Wondering what’s a good benchmark for user engagement on your website? We measure this with the metric called ‘average Pages per Visit’. Whether the number of average Pages per Visit or PPV is good or bad depends on a lot of factors. For example, your business model, industry, etc.
However, in September 2022, “ Littledata surveyed 5,941 sites and discovered that, on average, users view 2.6 Pages per Session. And, the top 20% of websites get 4.0 pages per session.” So, if your site scores above on average, 2.7 to 4.4 Pages per Visit is a very good number, and you’re surely outperforming the majority! Now, let’s cut through the clutter and understand the concept of ‘pages per visit.’ No jargon, no fuss—just the essentials you need to grasp this engagement metric. Let’s get started!
What is Pages Per Visit (PPV)
Pages per Visit or PPV is a user engagement metric that measures how many pages, on average, users view during a single visit to a website.
It serves as a key indicator of user interest and interaction. Pages per Visit is like counting how many pages people look at when they visit a website within a single session.

If they look at a lot of pages, like the image placed above, it means they really like what they find there. It helps us know if the website or the pages are interesting for visitors and how well it’s set up for them to explore better.
Why Pages per Visit is important
Tracking an average Pages per Visit is important for understanding the overall user engagement . Analyzing how many pages visitors view provides insights into the site’s appeal and stickiness. Also, it helps measure the potential for achieving goals, such as increased page views or purchases.
So, in short, we can say, Pages per Visit is important because it,
- Measures user engagement and interest in your content.
- Reflects the stickiness of your website—how long users stay.
- Indicates the likelihood of users completing desired actions, such as making purchases.
When Pages per Visit (PPV) matters
- Useful for content-driven sites where user exploration is vital.
- Relevant for e-commerce websites that are aiming to increase product views and conversions.
- It helps identify areas for improvement in user experience, content layout, and page structuring.
When Pages per Visit (PPV) might not be a priority
- Single-page newsletter subscribing websites: Primarily focused on a quick, specific action (newsletter subscription).
- For transactional sites with a single specific goal (e.g., completing a form).
- Landing pages designed for quick interactions without extensive exploration.
How to measure Pages per Visit (PPV)
The formula for average Pages per Visit is:
Average Pages per Visit (PPV) = No. Page Pageviews During a Timeframe / No. of Visitors During a Timeframe
Pages per Visit with Google Analytics
Now, as all of us are quite familiar with Google Analytics (GA) let’s learn to track how many pages, on average, visitors view during a session. First, let’s go through it with a mix of GA data and some manual calculations. After that, we’ll move forward with the existing setup.
The formula for this calculation:
Average Page Views per Visit = Page View Events + Screen View Events / Total Sessions
- Page View Events: Tracks user views of specific pages on a website.
- Screen View Events: Records user views of different screens within a mobile app.
- Total Sessions: Counts all user visits or interactions with a website or app within a set timeframe.
Suppose for a specific timeframe according to your GA data, you have 20,000 Page View Events, 5,000 Screen View Events, and a total of 15,000 sessions. So, the average Pages per Visit will be,
= (20000 + 5000) / 15000 = 1.67
This means that typically each visitor views around 1.67 pages during their visit.
On Google Analytics 4 (GA4) you can find your property’s average Pages per Visit aka Pages per Session in this manner:
- Log in to Google Analytics .
- Select your property .
- Go to Reports .
- Click on Engagement .
- Click on the Pages and Screens option.
- On the right, you’ll find the average number of mobile app screens or web pages viewed per user by the title Views per user .
- Adjust the timeframe as you need to.
Similar to Google Analytics, there are other tools that offer average Pages per Visit metrics. For example, Similarweb, HubSpot Analytics, etc.
Final thoughts

Every contact we have with a customer influences whether or not they’ll come back. We have to be great every time or we’ll loose them. Kevin Stirtz , American Author
Finally, along with Pages per Visit use other key metrics , like session duration, First Response Time, conversions, etc. Also, try to gather customer feedback data using various methods for a better picture.
To boost your site’s average Pages per Visit, optimize site navigation with clear Calls to Action (CTAs) and internal links. Moreover, try to craft better compelling content, and reduce FRT .
Remember, for a higher on average Pages per Visit there’s nothing better than securing a seamless user experience and a good amount of engaging content.
Uttam Kumar Dash
A full-time digital marketing strategist, self-taught writer, content creator, and tech enthusiast. Apart from tech, I’m a professional music composer. A disciple of arts and history.
Related Articles

Fluent Support 1.7.8: MemberPress Integration, Ticket search and more

GCP VS AWS: The Best Cloud Development Platform

Use WordPress Slider Plugin to Make Your Website Captivating

Customer Service Automation – How to Save Time & Delight Customers

WordPress Admin Dashboard: A Complete Walkthrough

Disney Four Keys Of Successful Customer Service You Should Adopt
Leave a reply cancel reply.
Your email address will not be published. Required fields are marked *
Save my name, email, and website in this browser for the next time I comment.
Page Views vs. Visits: What's The Difference? We Break It Down
Published: December 29, 2021
When it comes to your website reporting, it’s important to know exactly what you’re tracking and what the metric means.

If you’re using HubSpot’s Marketing Analytics tool , you may have noticed the following metrics in your dashboard: page views, page visits, page sessions. So what’s the difference between these three? Let’s dive in.
Understanding Page Views vs. Visits
A page view occurs when a page on your website is loaded or reloaded whether the user was already on your page or came from an external page. A page visit, on the other hand, only occurs when someone lands on your site from an external page, such as Google or another website.
So technically, every page visit is a page view, but the same is not true the other way around.
It’s important to know this difference, as it can greatly impact your understanding of audience behavior and page performance.
Without this knowledge, you might think that high page views is an indicator of a high-performing website but that’s not always the case. You’ll need to look at more metrics, like page sessions, unique page views, page visits, and other metrics to get a full picture.
Now that we broke that down, we’re going to further explain each metric in detail. Before we get there, it’s important to understand what a session is, as that can help your understanding of other website metrics.
What is a session?
A session is a measurement of visitor engagement that groups together analytics activities taken by a single visitor on your website. It expires after 30 minutes of inactivity.
It works by grouping together the actions taken by visitors as they navigate through your site. This includes the pages they are viewing, the elements they engage with (Think CTAs, forms, or events.)
The time-sensitive element of a session allows you to drill into engagement and traffic on your site.
Here’s an example: A visitor lands on your website’s homepage by clicking on a link from a blog post. They spend some time scrolling down the page, navigating to your product page, and even reading your "About Us" page. Then, they decide to leave the website.
Ten minutes later, the same visitor is still thinking about your product and decides to return directly to your pricing page. All of these actions would count as one session.
Even though the visitor completely left your site, they have not been inactive for more than 30 minutes, so the second visit to your website is recorded as a continuation of their original engagement to your site. If the visitor chose to return after that session has elapsed, their visit would kick off a new session.
How to Understand the Page Views of a Website
A page view is when a page on your site is loaded by a browser.

Don't forget to share this post!
Related articles.

How to Effectively Run an A/B Test On Your Landing Pages

4 Best Practices For Effective Landing Pages in 2015
![Personalize Your Simple Follow-up Emails [Product Update]](https://blog.hubspot.com/hs-fs/hub/53/file-411136170-png/academy/images/new_lps_available.png "pages per visit meaning")
Personalize Your Simple Follow-up Emails [Product Update]

Why You Need A Blog Subscription Landing Page

Why Landing Page Optimization is so Important
Calls to Action and Landing Pages [Concept of the Week]

3 Secrets of the Top HubSpot Customer Landing Pages
![Place Your Landing Page Content Above the Fold [Google Tool]](https://blog.hubspot.com/hs-fs/hub/53/file-405636074-jpg/academy/images/place-your-content-above-the-fold.jpg "pages per visit meaning")
Place Your Landing Page Content Above the Fold [Google Tool]

Better Landing Pages Start With a Marketing Persona

Top 5 Landing Page Mistakes
Outline your company's marketing strategy in one simple, coherent plan.
Marketing software that helps you drive revenue, save time and resources, and measure and optimize your investments — all on one easy-to-use platform
- Web Support Request
7 Website Analytics That Matter Most
Published by Spinutech on October 13, 2015

If you have a Google Analytics account or web metric reporting of any kind, you probably know how easy it is to feel overwhelmed by all the data provided. Sure, there’s lots of information, but is all of it meaningful? And how can you tell if your website is successful? In this post, I’ve outlined 7 universal key performance indicators, their benchmarks, and how to use them to turn your analytics reports into an analytics story you can attribute meaningful and actionable information to.
There are many other metrics that you should be using for in-depth analysis, but for now I recommend starting with these for evaluating initial site performance. Please note, average based metrics can be very dangerous. For meaningful analytics, segmentation is necessary, and I encourage you to view the following metrics by traffic source.
The number of visits and visitors to your website, reported as sessions and users. Most often referencing the number of visits (sessions) to your site.
Traffic, specifically number of visits, is a fundamental measurement of site reach and growth. It’s helpful at gauging how well your marketing efforts are working, and helps to give a great overall snapshot of site performance. You spend all this time figuring out how to get traffic to your website, but the key is to make sure it’s the right traffic.
How Much Traffic Should Your Website Get?
That depends. Unfortunately, there isn’t a magic number or range for website visits.
Site goals based on a number or range of visits should not be used as an indication of success. Your only goal should be to do better than you did this time last year.
When setting your blog or website traffic goals, start by asking yourself why you want to grow your traffic to begin with and what you intend to do for that audience. Your goal shouldn’t be to grow the number of visits simply for the sake of growth or based on arbitrary numbers, but to grow a dedicated audience that supports your digital business goals. Although I don’t recommend setting goals based on traffic, it is important to know healthy ranges to expect and how you stack up to other similar sites in your industry and region. For a general benchmark, you can find comparisons in the benchmarking report in Google Analytics.
At a general site level, there’s very little value in measuring / pursuing goals in overall site traffic without context from traffic channels and location (if you’re a regionally based business). Additionally, although I do recommend monitoring your month over month traffic performance to look for trends and changes, this isn’t an accurate measure of success due to seasonal traffic fluctuations and other factors. The best measurement of success when it comes to traffic is a year over year performance comparison and growth progression.
2. Bounce Rate
The percentage of single-page site visits.
At the site level, bounce rate is useful as a general signal of user engagement and the state of content quality, and helps to identify when problems exist on your site. However, bounce rate is very dependent on the site, and unreliable on its own, and must be used alongside other engagement metrics such as average session duration and pages per visit.
What is a Good Bounce Rate?
This will honestly depend, as there’s no hard and fast rule. 50% is an industry indicator, but this number should always be taken into consideration with other metrics, the nature of your business and industry. I often see bounce rates that range from 25% - 65% across different industries.
An abnormally high bounce rate is generally a warning that people are leaving your site, and aren’t willing to stick around to explore the rest of your website.
Bounce rate is often unfairly flagged as a ‘bad’ metric, but it’s not inherently good or bad. It simply states how often site visits stay on the same page from their initial entry. Standard bounce rate (in Google Analytics) has nothing to do with time on site or how quickly a user leaves the site, so if you’re judging the success of your site on a high bounce rate, you’re missing key information about how users are actually interacting. For instance, consider a user that clicked on your site from a search result, spent 5 minutes reading the content on your landing page, then leaves or completes an off-site call to action. In Google Analytics, that’s technically considered a bounce, even though it lead to an interaction.
A number of factors can be responsible for high bounce rates. Anything from the ease of navigation, slow page loads, poor aesthetics, low or irrelevant quality content. Once you can identify there’s an issue, dig a little further with segmentation to determine why your visitors are leaving.
3. Pages / Session
An average of the number of pages viewed during a visit on your site.
Pages per session broadly gauges how compelling users find your content and the ease of access.
How Many Pages Per Session Should I Aim For?
The unofficial industry standard is 2 pages per session.
For most sites, the goal is keep users engaged, nurture their interest, and get them to take the next step. More pages per session often indicates that your users are highly engaged and willing to explore more of your site. This is an excellent way of measuring interest and curiosity about your company. Use the behavior user flow reports to follow their click trail.
Additionally, while some would suggest that the greater the number of pages per session, the better, this isn’t always the case. Again, I must stress the importance of considering metrics together to avoid making inaccurate judgements. Consider the average time on site and bounce rate to piece together a better idea of what’s happening at large. A site with a high number of pages per session, low session duration, and a high bounce rate can indicate page flipping behavior due to irrelevant content, poor accessibility, or disinterest. Similarly, a site struggling with low number of pages per session coupled with low session duration, and a high bounce rate can indicate low quality content or user engagement. However, it’s best to always consider your goals. In some instances, this might be exactly what you want for your marketing campaign.
4. Average Session Duration
The average length of all site visits combined.
Alongside bounce rate and pages per session, average session duration contributes to the user engagement story by illustrating how long users stay on your site. At the site level, it’s a helpful metric for indicating engagement the true value of your site content (time is money, right?).
What Should Your Average Time on Site Be?
For a good average session duration, the industry standard is 2 - 3 minutes.
What can happen in two minutes? Two minutes might not seem like much time, but it’s enough time for users to read content and interact with your website. And for this reason, longer sessions indicate more engaged visits. Time is the most precious resource we have as human beings, and this number shows us how much of their time users are willing to sacrifice for your content.
However, because this number is an average based metric, we must be careful at trusting this number without further context.This metric is most helpful when looking at segmented views, traffic sources and in consideration with other engagement metrics.
5. Conversions
The quantifiable measurement of expected or desired site outcomes, reported as goal completions and conversion rate.
When evaluating overall initial site performance, conversion rate tells us about the effectiveness of your site and marketing efforts. Used with other engagement metrics, goals also contribute to your site’s analytics story by highlighting value as they relate to your business goals.
What is a Good Conversion Rate?
Industry standard conversion rate is 2%.
Goal completions and conversion rate allow us to determine the events on your site that are most important to your business and should be connected in some way to your company’s objectives.
Not to be confused with events, conversions are the outcomes mentioned in the definition and signify the reason why your site exists. Although events are incredibly important to measuring engagement, events are could be classified as secondary site interactions that are not tied to business objectives.
This benchmark varies by industry and will completely depend your business goals and the the intention of your site. Generally, a lower than average conversion rate may indicate issues with accessibility, calls to actions, low quality content, and general disinterest. However, if your site engagement is suffering, it’s likely the case that your conversion rate will suffer as well.
Because this is one of the few digital marketing metrics that reflects your business goals most, conversions are truly most powerful in a segmented view to identify areas on the site that hold the greatest amount of value and where improvement is needed most.
6. Percent of New Sessions
An average percentage of first time visits to your site.
This metric measures how many of your site visits are from first-time visitors or returning visitors, and indicates the efficacy of your marketing efforts at driving new site traffic. However, this is an important KPI to for measuring the ‘stickiness’ of your site, or whether your site is worthy of multiple visits from users.
What Percentage is Ideal for New Sessions?
No benchmark. I often see a range of 45 - 75%, but maybe the 80/20 rule works for you.
A good site will have a healthy mix of new and returning site visitors, and this mix will vary depending on your site goals, business and industry. If your goal is to generate leads from your site, you’ll want a healthy number of returning visits as it often takes multiple interactions with your site for users to convert.
However, don’t get so lost in acquiring new visits that you neglect your existing audience base. Additionally, it’s important to note that not ALL site visitors are worthy of retention.
7. Click Through Rate
The percentage of clicks resulting from a search impression.
CTR is important for paid advertising and organic listings alike. However, in this post, I’m referring specifically to CTR from organic search.
Click through rate (CTR) helps us understand how well your site is performing from search engine results pages as it measures how many people click your site’s listings. This metric indicates how compelling and relevant your search results are, and the impact of your improvements to search results.
What is a Good Click Through Rate?
The industry average CTR for all sites is 2%. The average CTR will vary depending on the nature of the query and your industry.
Click through rate is a powerful metric that allows us to evaluate how well your indexed search result is driving users to click. If your site has a lower than average click through rate, it may indicate that your indexed results may need some work. This could be due to poor keyword targeting, irrelevant content for the user’s search, or you’re missing compelling descriptions or rich snippets.
Although rankings and impressions are important to understand to monitor overall growth in search results, click through rate offers a better measure of performance from organic search. When paired with bounce rate and other engagement metrics, this metric is also incredibly helpful for identifying issues content efficacy and user engagement. If you’d like to get into more detail, I suggest looking at CTR of the top queries for which your site appeared in search in Google Search Console. Because branded searches typically result in higher CTR than non-branded search, I would add that a true measure of effective marketing using click through rate would be to monitor CTR by non-branded search queries only.
What Metric Should I Use to Determine if My Site is Successful?
All of them. Not any one metric should be used alone to indicate performance success. Each metric presents only a piece of the puzzle, and the full situation can only truly be understood when used together. If you were to focus on only one metric, instead of letting them lend to the story together, you’re missing the bigger picture. This can lead to some dangerous judgments and decisions.
There are hundreds of ranking factors for which Google considers your website, and this post by no means even grazes measurement of these factors. However, as stated before, the seven areas highlighted above simply represent the overarching scope of your site performance and initial engagement with your site. Once you understand your general site metrics, by traffic source, I encourage you to dig further into behavior and page level analysis. Further, always consider your goals when reviewing these metrics, as this provides context for your site’s analytics story.
We value your privacy
We use cookies to enhance your browsing experience, serve personalized ads or content, and analyze our traffic. By clicking "Accept All", you consent to our use of cookies. Privacy Policy
Understanding Basic Visitor Metrics
CREATED FOR:
Learn about Page Views , Visits , and Visitors in Adobe Analytics.
Get definitions of these basic visit metrics and learn about their similarities and differences.
Learn the various terms (synonyms or keywords) associated with visitor metrics and Website traffic.
View a sample Workspace project that shows how these metrics are displayed in the interface.
https://video.tv.adobe.com/v/28774/?quality=12&learn=on
pages per visit
Free video lessons.
- LinkedIn LinkedIn Groups
- Website Optimization Website Copy
- Email Marketing Strategy Email Types
- Social Media Marketing Using Twitter to Engage an Audience
- View Courses
- Change Password
Get the latest digital marketing data, insights and toolkits from DMI
How to Assess and Set Goals for Pages per Visit
- Share on Twitter
- Share on Facebook
- Share on LinkedIn
- Share on Pinterest
- Share via Email
You might have encountered this situation when reporting your metrics report. Your stakeholders saw the number of Pages per Visit (or Pageviews/Visit) increased or decreased, and they’ll come asking rather that is good or bad.
In this blog post, I’ll refer to Pages per Vist to PPV
First of all, if you’re getting a reaction to changes in PPV , that’s probably better than getting no reaction or comment. Usually, number of pages viewed per visit doesn’t change that much and it is a measure that is overlooked. Usually this metric changes a lot of when something technically goes wrong, and then the bounce rate drops or shoots up.
However, it is important to come to an understanding with your stakeholders that PPV could be a powerful metrics depending on how you look at it.
To me, it is quite useless if you just sit there and look at this metric go up and down, and claim it as good or bad without any context or a goal.
Web site’s goal and objective Depending on what you’re trying to accomplish with your website, how you look at every metrics and KPI’s would be different. In terms of PPV, what would be your bottom line? How do you determine the good amount of page views per visit and call it a success?
How do you want your PPV to look like when you put your site’s goal into consideration?
Let’s say you’re going to run a mini-site to acquire site registrations and attempt to market to those registrants later.
It turns out you’ll need a minimum of 3 pages to complete the registration process. In other words, reach the confirmation/thank you page.
Then ultimately, you’ll like to see your PPV on this mini-site around 3~4. Obviously, if your PPV says 2, then people are probably not reaching the confirmation page. Time to look at the conversion funnel in more detail.
For news related site (like NYT, WSJ, Reuters, etc.), you can see PPV in many different ways.
Because it is very likely that these sites are monetizing through CPM-based media ads, from that standpoint, they may want to acquire a lot of PPV as much as possible. In that case, high PPV would be nice, but it is also important to assess different levels of PPV by various news categories.
In that case, high PPV would be nice, but it is also important to assess different levels of PPV by various news categories.
If they’re promoting related articles through artificial intelligence tool (IA, predictive modeling, etc.), then that will be another area where they would want to see multiple PPV as well. Meaning you want to be able to segment and see how different segments do differently for a number of pages viewed per session. Setting goals for PPV by verticals or by different micro-objectives within a site would become important as well.
Translate that analysis and educate your users From an analyst standpoint, each analysis is probably thorough and covers enough details through basic reporting from web analytics tools. However, your insights would need to be translated to others, so that they don’t limit their views on PPV on one flat number in one dimension. In other words, generate various angles to articulate how different user segments behave differently and how marketing is trying to improve user experience to drive more traffic through the funnel.
My personal story: I’ve encountered a site where PPV dropped 50% after the site relaunched, and it was due to multiple reasons, which was mostly attributed to better site design. It was a little challenging to translate to others that this “decline” was good. What’s your story?

Kris Twitter
As a data journalist, I enjoy curating and analyzing marketing trends, and data. The things that fascinate me the most are the transforming business landscape due to evolving marketing technologies.
ZoomMetrix Newsletter
Join the newsletter to receive the latest updates in your inbox.
Pages per visit measures the volume of content (Web pages) a particular user or a group of users views on one single website. Pages per visit is displayed as an average, which is the total number of page views divided by the total number of visitors.
- Analytics platform
- Session replay
- Conversion funnel
- Event analytics
- Usability testing
- Customer support
- Campaign validation
- Get started
Table of Contents

Website Analytics
Let’s Make It Clear: Pageviews, vs. Visits vs. Sessions
The Internet community and the number of websites are vast, only to be outnumbered by the plethora of web analytics-related terms that sound similar but have different meanings. Have you ever felt lost between terms like pageview, visit, and session? We are here to help you out on this one.
In this article, we clarify what pageview, visit, and session means. We will highlight the similarities and differences and then dive into the endless possibilities of session analysis. We will cover everything you need to know about session replay , from its meaning, through its benefits, to its usage. What’s more, we have gathered some tips to take session replay analysis to the next level. Finally, we also look ahead to future opportunities for improvement.
Want to know more? Keep on reading.
Glossary of Web Analytics Terms

When someone loads your website in their browser, it is called a page view. Let’s imagine a visitor comes across your blog post using a search engine. However, one of their browser addons stops some of the content from displaying properly, necessitating a page reload. In that case, your analytics report will show two page views, even though they were created by the same visitor (and in a short period of time).
A page visit, on the other hand, occurs when someone comes to your site from somewhere other than your website’s domain. For example, a visitor who finds your content online and then reloads the page is still considered one visit. This is often complemented by the word unique, as in unique visits or unique visitors because users are identified by the cookie used on the computer. If a visitor comes to the site five times in a month, for example, this measure will count as one person regardless of the number of visits. In website analytics, users are a critical metric.
This figure depicts the number of visitors who engage with your website over a given period of time. When someone visits your website, a session begins, and it normally ends a few minutes after he or she stops doing so. A Google Analytics session normally terminates after 30 minutes of inactivity.
An action can take many different forms, such as visiting a website, downloading a file, or filling out a form. Another scenario is when a visitor decides to buy a product, adds it to their shopping cart, and then returns to read the product description. Although there were two page views, the number of sessions remained the same because it was the same user.
In summary, a session is the total amount of time a user spends on your website over a period. Typically, your analytics tool will track all activity such as views and engagement with items or forms within a single session. It is an important metric to keep track of because it adds context to your views and visits.
Sessions and their analysis provide a wealth of opportunities for website owners to improve. If you don’t want to be left behind, this is what we are going to talk about below.
Everything You Need to Know About Session Replay as a Web Analytics Tool
Session replay, session recording, customer experience analytics, in-page web analytics, mouse recording tool, user replay, user session replay, user experience replay, visitor session replay, visitor replay, visitor recordings, visitor playbacks, visitor behavior analytics, visual session recording, visual analytics, website session replay, website video replay are all synonymous with what we are about to discuss.
Although the names are quite revealing, let us tell you a little more about the topic.
What is Session Replay in Web Analytics?
Session replay, in a nutshell, is a solution or a qualitative web analytics tool which also known as session recording, and that allows digital teams to review footage of real, anonymous consumers interacting with their websites or apps.
This tool actually allows you to track every activity on your website for each of your visitors. It’s like looking over their shoulder, but you can do this without disturbing them with the fact that you are actually watching, so they can behave naturally.
Session replay allows you to track visitor mouse movements and clicks to identify conversion funnel pain points. It is identical to studying video footage to determine what a single visitor is looking for, what visitors have not found, what frustrations might cause them to turn back, or even quit.
Who Uses Session Replay?

The tool itself does not require significant expertise, so even novice website owners can use it with confidence. Furthermore, because it provides fully website-specific qualitative data, it can be a powerful web analytics tool for website analysis for large enterprises.
Significant results can be obtained through session replay if we combine the analysis to basic qualitative metrics (the traffic source, new visitor conversion rate, bounce rate, return visitor conversion rate, interactions per visit, value per visit, cost per conversion, exit pages, etc) and are aware of the logic behind each metric.
In summary, session replay is a great partner in the website optimization process for all e-commerce players, including web analysts, customer support managers, e-commerce specialists, digital marketers, optimizers, product managers, and UX designers.
Advantages of Session Replays
Even though web analysis with session replay is very time-consuming and demands significant focus, it has numerous advantages. Without being exhaustive, we have collected a few that clearly highlight session replays as a tool among simple quantitative metrics. So the session replay:
- Recognize and empathize with your visitors’ feelings and user experience
- Provides a clear picture of the user journey
- Examine how visitors engage and interact with various website features.
- Identify bugs , issues, and obstacles
- Uncover why visitors are leaving your website
- Help team members and clients make decisions by visualizing findings
- Answers what quantitative metrics leave open
- Prevents guesswork through reliable, real user data.
Nevertheless, some people have concerns about private information. This personal initiable information (PII) can be names, phone numbers, emails, or even other account data. However, most session replay vendors use selective or full masking to prevent such data from falling into unauthorized hands.
How to Use Session Replay

Once you have found the most useful web analytics tool on the market to provide you with a complete analysis, you can get down to the real work.
The first thing you should do is segment your visitor group. Determine which visitors are returning and which are new. The reason for this is that returning users are already familiar with your website, so they can navigate it as if nothing were wrong. This may lead to incorrect conclusions, so take your time and do not rush through the process.
Do not try to repair all the flaws at once after you uncover them — you’ll be shocked by how many you may find in a single session. Make a hierarchy list and take notes. Select the issues that have the greatest influence on the overall user experience and address them while running usability tests until you are happy with the results of your conversion rate and user interface. Then move on to the less important concerns and repeat the process.
Tips to Get The Most Out of Your Session Replay Analysis
Owning a powerful analytics tool like session replay does not mean you have a winning case for undiscovered customer journeys, low conversion rates, or high bounce rates. If you know what to look for and how to look for it, you are on the road to an optimized website. That is why we have put together a list of tips that can bring decisive results to your session replay analysis with little investment of time and energy.
1. Focus on what’s important
“Data are just summaries of thousands of stories – tell a few of those stories to help make the data meaningful.” – Chip & Dan Heath, Authors of Made to Stick, Switch.
As a website owner, it is understandable to want to look into every session and solve the problems or frustrations of every visitor, but this usually results in a long, endless, and often fruitless analysis. Instead of watching random sessions, go over the most important ones and their timestamps. But how will you know which sessions are important? – You may ask. Today, most session recording tools, such as Capturly, have add-ons that provide a solution to this very problem. By using artificial intelligence to highlight the most essential sessions and timestamping critical user events, you can focus on the key events and important sessions.
2. Follow the trails
“The goal is to turn data into information, and information into insight.” – Carly Fiorina
Once you have narrowed down the myriad of sessions to review, you can start the actual analysis. You can even begin the examination with some preliminary assumptions as a hypothesis , but after a few sessions, a key user problem may emerge. Further analysis should be built on this particular problem, looking for indications of it. The issue may only occur on a specific operating system, device or browser, so you need to optimize your website based on this information.
3. Complete the analysis with heatmaps
“Visualization gives you answers to questions you didn’t know you had.” – Ben Schneiderman
For a fully optimized website, it is worth combining your session replay tool with other qualitative web analytics such as website heatmaps . So we recommend it choose a tool that gives you both options. Capturly offers three types of website heatmaps for a completely optimized result: click heatmap, scroll heatmap, and segment heatmap. Unlike a session replay, heatmaps show an aggregated view of individual subpages of your website, such as the main page or a product page. Different heatmaps focus on different analytical aspects of your website.
Click heatmap

Click maps visualize the most commonly used elements of your page by showing you which buttons are clicked, analyzing the effectiveness of the structure, finding out what motivates your visitors.
Scroll heatmap

Scroll maps show you how far your visitors scroll down on each page. This is useful because it makes it easier to decide where to put your main call-to-action on different platforms like mobile and desktop. It is also helpful when it comes to deciding on how to optimize the position of the elements.
Segment heatmap

A segment map is a less common type of website heatmap. It allows you to segment your visitors in several ways. You can use it to compare new vs. returning visitors, visitors arriving from certain operating systems (Microsoft Windows, Apple macOS, Linux, Android, and Apple’s iOS, etc), and browsers (Google Chrome, Mozilla Firefox, Safari, Opera), and visitors arriving from different devices (desktop, laptop computers, mobile phones, tablets).
4. Do not forget about the big picture, aka conversion funnel optimization

“The big picture doesn’t just come from distance; it also comes from time.” – Simon Sinek
With a thorough understanding of the bugs and issues with the user experience on each site, and the strengths and most popular elements of the user interface revealed, it is time to look at the conversion funnel . After all, this is how visitors, leads, and potential customers will encounter our website. Leaks may occur in the funnel after some pages have been optimized. Session replay and heatmaps are excellent tools to optimize your conversion funnel which decreases bounce rate, boosts your sales, and this way increases your profit. Not worth missing, is it?
The Future of Session Replay

Nowadays, although the world of numbers, i.e. quantitative metrics, dominates web analytics, qualitative solutions such as session replay or website heatmaps are also very popular, as they offer websites an unmissable opportunity to stay ahead of the competition.
That’s why most session replay tool vendors already provide users with monitoring all digital channels like websites or mobile app on a single platform, reducing the impact on the performance of channels while still getting data, and sharing access with business users throughout the enterprise to reduce reliance on IT and business analysts.
However, if it has not already been done, greater importance is attached to creating visual maps of all customer journeys, funnels, and individual sessions, also no need for pre-configuration or tagging to accommodate any application changes in real-time will be typical. Compressing high volumes of data, importing and exporting data at a lightning speed, masking PII, and meeting the highest security standards of the industry will be essential properties.
However, one thing that will change hugely will change the entire session replay analysis. And it is something that is weaving its way into our everyday lives ever more imperceptibly and rapidly. It is nothing other than artificial intelligence, or AI. Artificial intelligence will bring big changes to the lives of website analysts, as they will no longer need to analyze hundreds of sessions because AI will examine them, discover patterns, link them, analyze them, and make recommendations.
While thousands of developers are working on this, it is worth experiencing the power of session replay analysis for yourself.
The Internet community and quantity of websites are enormous, but they are dwarfed by the variety of web analytics-related phrases that seem the same but have diverse meanings. We defined pickoff, visit, and session in this post and explored the unlimited possibilities of session analysis.
Session Replay is a web analytics solution that lets digital teams examine footage of real, anonymous users interacting with their websites or apps. Because the tool itself does not require a lot of knowledge, even inexperienced website owners can use it with confidence. It’s akin to analyzing video footage to figure out what a single visitor wants.
It is a great partner in the website optimization process for all e-commerce players. Since it has many advantages, including helping team members and clients decide by visualizing findings.
Heatmaps can aid in the optimization of your website depending on data from your analytics tool. Check to see if you have a compelling case for untapped customer journeys. You can improve your user experience by looking at the most popular elements of your website. Click heatmaps, scroll maps, and segment maps can all help you figure out what makes your visitors tick. But do not lose sight of the bigger picture, often known as conversion funnel optimization.
Artificial intelligence will drastically alter the life of website analysts. Thousands of developers are working on it, but you should see for yourself how powerful session replay analysis may be.
Related posts:
Don't forget, sharing is caring! :)
Learn with our growing community! We show you how to convert one time visitors into actual paying customers We at Capturly respect the privacy of our readers. Therefore, the information you provide will be only used to inform you about upcoming relevant content and product update. If you are unsatisfied, you are free to unsubscribe whenever you desire. Leave this field empty if you're human: Leave a Reply
Copyright © 2023 Capturly Inc. All rights reserved.
- Marketing Tips
- Blogging Tips
- Social Media Tips
- Website Development Tips
- Online Business Tips
- FREE Training!
- Affiliate Marketing Machine
What Number of Pages Per Visit Is Acceptable for a Website?
Page views per visit and bounce rate are important metrics for measuring the health of a website. Together, these two metrics let website owners know just how relevant, interesting, and engaging their content is. Properly monitored, these metrics can reveal important information to help webmasters convert good sites into great sites and great sites into stellar sites.
Measuring page views per visit simply tracks the number of unique pages that a visitor to a site engages with during any given session. This information can be used to assess interest, but it can also be used, in more complex ways, to assess things like conversion rate, bounce rate, and so forth. Having so many metrics that depend on the number of page views in a visit makes it difficult to say just how many page views are appropriate for a given visit on a given site. The simple answer is that it all depends on the nature of the site, the visitor in question, and the needs of the site owner. For one site, a few page views may be enough. Another site owner, however, may not be happy until reaching a few dozen page views per visit. Here is a look at how to to determine how many page views per visit appropriate for your website.
- Want More Help? Sign Up For This ALL-INCLUSIVE Training Course From Startup To Profitability
Audience, Topic, and Page Views Per Visit
To get an idea of how much traffic your site should be getting, you first need to determine who your audience is. Hopefully, if you already have a website up and running, you’ve thought about this some. In simple terms, the larger your target audience is, the more page views you should expect. A website for a restaurant in a town of 30,000 people probably isn’t going to get the same amount of traffic as a website for a restaurant in Manhattan.
A restaurant is also likely to have fewer page views per visit to its website than, say, a news outlet. People who visit restaurant websites probably just want to see a menu or get a phone number, both of which can be displayed on just one page. People who are interested in the news may want to read anything from weather to politics to crime. The topic you cover is going to greatly influence the number of pages per visit that each user views.
Once you have a good idea of who your audience is, you can start to think about average numbers of page views per visit. Restaurants may think that two page views per visit are great while a news outlet will be highly disappointed with a number like that. The best way to determine how many page views is appropriate is to gather information on your competitors. See how you stack up to other players in your industry. For those that are doing well, visit their websites and try to learn what they do different from you (and the same as one another) that makes them so successful.
Measuring Page Views Per Visit Isn’t Enough
Just using the number of page views per visit as a measure of your site’s appeal isn’t enough. After all, if you are getting an average of ten page views per visit, it may be that users are interested in your content or it may be that they can’t find what they are looking for and are just clicking around. Obviously, the latter effect is not a good one.
To really understand what the number of page views per visit is telling you, you need to keep track of other metrics like the time users spend on any given page (dwell time), conversion rates (ad clicks or eCommerce sales), and so forth. Metrics like dwell time will let you know if your content is engaging. Sites with high numbers of page views and short dwell times probably have low-quality content or aren’t organized well. Sites with high numbers of page views and long dwell times are the holy grail.
Completion Rate
As important as page views are, they won’t make you any money. Depending on the purpose of your site and how you fund it, that may not matter much. For most people, however, they at least need to make enough money from ads to pay for their web host and perhaps a coder. Money comes from completion of sales and from people click on ads, neither of which is dependent on the number of pages a visitor views.
If your completion rates and click-through-rates (CTRs) are high, then you may not care about page views. In fact, you may prefer to have lower page views in favor of higher conversion (conversion to income that is) rates. If, however, your income depends on getting people engaged with your content (e.g. getting them to read enough to purchase a subscription), then page views and income may be tightly linked. Simply put, worry about page views per visit if such a metric impacts your bottom line and forget about it if you can afford to because there may be other metrics you are more interested in following.
Negative Aging
In the advanced study of website traffic, there is a concept known as a Weibull distribution . A Weibull distribution is actually a metric used in quality assurance assessment of manufactured goods. It essentially compares the age of a manufactured item to its failure rate. When the odds of a product failing increase with age, it’s called positive aging. When the odds of a product failing decrease with age, it’s called negative aging.
It turns out that good webpages follow a negative Weibull distribution; the longer they are out there on the web, the more traffic they are likely to get. It is also true that web visitors follow this curve, which is to say that the longer people stay on a page, the longer they are likely to stay on the page (or the less likely they are to leave it).
You may be wondering what Weibull distributions have to do with page views, but the concepts are intimately tied. Web users generally have a limited amount of time to browse the web. If they invest more time into one page, they have less to invest in another. If you have really good content, then users may not have enough time to visit multiple pages on your site. In this scenario, if page views are important to you, then you need to chop your content up and distribute it across multiple pages. This is just one example of how measuring a single metric, like the number of page views per visit, often isn’t enough to tell you what is really going on with your website.
Measuring Page Views Per Visit to Get Ahead
The whole point of monitoring page views is to improve content. If you measure just page views per visit, however, you’re likely to be chasing the wrong goal, which can cost you time and money. For instance, an increase in page views per visit may mean that customers are interested in your content or it may mean that they can’t find what they are looking for on your website. You won’t know unless you monitor other metrics. Like every web analytic, page views per visit can’t be used in a vacuum. Before you fire off an analysis of your website, ask yourself first what your goals are and then tailor your metrics to ensure that they are actually measuring your progress toward those goals and not something else entirely.

Share :
- Social Media Marketing Tips
- SEO Tips & Trends
- Online Business
- Affiliate Marketing Tips
Recent Posts
16 Coffee Affiliate Programs for 2024 and Beyond
Jasper ai review: pros and cons + is it for you, how to start a christian blog (5 easy steps anyone can follow), 15 best blogging platforms to make more money in 2023, 5 reasons why affiliate marketing is the dream career for introverts, how to start affiliate marketing on facebook – a complete 2023 guide.
Learn Affiliate Marketing With Us!

Related Posts
Page [tcb_pagination_current_page] of [tcb_pagination_total_pages]
- Affiliate Marketing
- Landing Pages
- Lead Generation
- Marketing Attribution
- Native Advertising
- Brand Awareness
- Content Marketing
- Performance Marketing
- Taboola Best Practices
- Programmatic Marketing
- Video Marketing
- Driving Traffic
- Research & Reports
- Case Studies
- Data & Trends
- Revenue Optimization
- Data Science
- Machine Learning
- Tips and Tricks
- Product News
- Taboola Life
- Company News
- Taboola Blog
- Audience Engagement
Everything You Need To Know About Pages Per Session
How many clicks do you register on a site before navigating away to a different one?
Pages-per-session is a measurement that simply reflects how many pages a visitor loads within one visit to your site. Upon arriving by way of search or social traffic—or perhaps even by typing your address into the good old-fashioned URL bar—this measurement helps point to how engaged visitors are with your site specifically.
Of the wide variety of metrics used to gauge a site’s performance, this one gives you a great perspective into how your site is engaging your audience. As previously discussed with a metric like time-on-site, you’re only getting part of the story on how visitors interact with your pages.
It’s difficult to capture 100% of a user’s time-on-site, but this is not the case with pages-per-session. With every page load, your analytics platform will record a tally, so nothing is lost.
The Advertiser's Launch List for Landing Pages that Convert
How to succeed without really trying.
Pages-per-session is helped along by page design. Are your pages beautiful and easy to navigate? Visitors will then be more inclined to do some navigating of their own volition, naturally driving up your pages-per-session. The readers click because they want to.
News sites and other content sites stand to best flex this metric by making use of “related stories” links, motivating users to stick around and interact with more of your site’s content. It’s called organic recirculation, giving people an easy means to continue loading pages without leaving your site.
Also, pay attention to page depth, described by the screenshot below. Page depth is pages-per-session’s cousin metric, which tells you how many sessions are yielding one pageview, two pageviews, three pageviews, and so on. Identify the steepest dropoffs and observe how they change. This is another reliable way to track your site’s level of engagement .
Your goals may vary.
Point boldly to your high-value pages. Depending on what you’re trying to accomplish with your traffic goals, a single video view could be more valuable than several article views. Make it as easy as possible for people to click on the links you most want them to click.
Don’t fear the occasionally low pages-per-session. Not all sites operate like a news site, which depends upon attracting visitors and keeping them around. Some sites might hook a visitor with one page only to see them buy something—clearly a successful session despite a low page count.
This is closely related to our previous discussion on bounce rate. When someone loads a page and immediately exits, it may simply mean you gave them what they were looking for very quickly.
Visitors will hate the player and the game.
Beware the temptation to game this metric. As they lead directly to ad impressions, pageviews are a key revenue generator for online media properties. This means it’s in every publisher’s direct interest to take steps to drive them as high as possible. This too often means taking shortcuts and sacrificing the quality of a reader’s experience.
Publishers may be motivated to break up single articles into multiple pages in order to drive up pages-per-session, but this is merely a bald-faced means of squeezing more clicks out of the same amount of content.
Yes, this strategy will certainly increase pageviews in the short term, but it will leave your visitors feeling scammed in the long term, and the additional ads may not perform for your advertisers. Who wants to click three times (or five times, or seven?) just to finish reading one article? Such tactics put the reader last and discourage repeat visits. It feels deceitful to any reader who’s paying attention.
Bringing it home.
Pages-per-session is an advantageous metric because it cuts out much of the gray area that others, like time-on-site, necessitate. It’s an absolute answer to how many pages people load with each visit to your site. It becomes easier to more directly track the correlation between template changes, like changing your related posts or organic recirculation modules, and your overall site performance.
By providing your users with a sharp site design, many opportunities to click links to worthwhile pages, and steering clear of pageview tricks, you’ll soon have engaged visitors that trend your pages-per-session upward.
And what kind of publisher wouldn’t want that?
Create Your Content Campaign Today!

All Features
Explore all functions.
Intelligent link suggestions.
Anchor Text Analysis
Optimize anchor text for rankings.
Keyword Cannibalization Report Tool
Solve keyword cannibalization for SEO.
Orphan Pages Tool & Reporting
Uncover hidden challenges.
Link Preview Tool
Enhance UX, boost performance.
Knowledge Base
Feature Requests
Link Whisper vs Linkilo
Interlinks Manager vs Linkilo
Internal Link Juicer vs Linkilo
Last updated on: January 8, 2024 at 9:18 am
What Is Pages Per Session? 20 Ways To Improve It
- by Jay - Linkilo
- Published Date: May 25, 2021 January 8, 2024
- 13 min read
- Conversion Optimization , Content Marketing , SEO

Although there are numerous website engagement metrics to monitor, one of the most useful is “pages per session.” Here’s what it means and how you can improve it.
Table of Contents
When you spend money and time attracting new people to your website, you want to do your best to keep them coming back.
Depending on the site, this may include reading a few articles, purchasing a product, or signing up for a newsletter.
Tracking site engagement is critical in all of these situations. Pages per session are one metric that can be useful.
What are Sessions ?

Before we get into Pages Per Session, it’s important to understand a session. A session is a set of activities on your website during a specific period for a single user. A session, for example, could include a variety of Page Views and goal completions, as shown in the image below:
Sessions and clicks are not the same things. If you’re not familiar with the differences, we’ve summarized them below:
- Multiple ad clicks can lead to multiple clicks, while a single session is time-based.
- A user who returns to your site directly (via a bookmark, for instance) after clicking on an ad would frequently result in several sessions but just one click.
- If a page does not load correctly after an ad click, you can not see a recorded session in which a click occurs.
- Invalid clicks are deleted from click records but remain in sessions.
What are pages per session?
Pages per session refer to the total number of pages a user sees during a session. This metric is determined by dividing the total number of sessions by the number of page views.
This metric will assist in determining how sticky and engaging your site is. In principle, any content site that generates revenue from Adsense, advertising, or affiliate links needs to increase the number of web pages each user sees. More visitors and time spent on the website’s pages equals more sales.
For context, if your website has a page per session average of three, this means that the average user visits three sites before leaving your website.
One of online retail’s primary goals (and obstacles) is to offer customers as many options as they need to make a buying decision. A lot depends on the target demographic, product type, and stage of the customer’s journey, but the more products we see, the more probable we are to locate what we’re looking for.
How many pages per session is okay?
According to Littledata , which examined 3,698 sites, the average number of pages per session ranges from 1.8 to 4.4. If you get more than 4.4, your website is in the top 20% of all websites in their report. If it is less than 1.4, you are burning your advertising money.
However, as previously mentioned, the importance and priorities of pages per session vary depending on the industry. If you have online media, the more people who visit your sites, the more ads they encounter, and the more money you make. This metric is pointless if you have a single-page website.
In terms of e-commerce, the following are some benchmarks from SimilarWeb for 2020:
- The average number of pages per visit – is 5.6
- Average visit duration – 3m 56s
- Average bounce rate – 47.28%
Compared to 2019, the trend is declining, making this metric even more significant. People’s attention spans seem to be getting shorter and shorter, so you must build a one-of-a-kind shopping experience to conquer their hearts and wallets.
How many pages per session is bad?
A Page per session of less than 1.8 would place you in the bottom 20% of sites, and less than 1.4 would place you in the bottom 20% of sites.
Is your website getting under 1.8 pages per session?
Can you enhance the navigation or page layout to keep visitors on your site longer? Consider rethinking the customer journey. We expect a much lower average if this is a single-page application where much activity occurs without reloading a page.
How do you track the number of pages per session?
You can find your website’s average pages per session in Google Analytics’ Acquisition>>Overview>>Channels Report. You can see this in the left sidebar.

You will see an overview of the total pages per session for your overall website here.

Do you want to go any further into this metric? In addition, you can see the average number of pages per session for each channel, medium, source, and referral. This will allow you to determine which traffic sources bring in the most active users.
You will find the pages per session for each of your main acquisition channels. This lets you identify which channels bring more engaged users to your website.
Methods for increasing pages per session
So, how can you raise your pages per session after all of that?
We polled hundreds of marketers to determine the most effective and beneficial methods.
1. Conduct customer feedback analysis.
Collect reviews from your target audience. Requesting a review is a simple way to rectify costly errors that affect our page per session metrics. It never hurts, to be honest with customers, and it’s almost easy. Most businesses, however, struggle to capitalize on the power of surveys, believing it to be a cheap and sly tactic.
On the other hand, your visitors appreciate this practice because it shows that you took the time to understand their point of view on the subject.
2. Know your intended audience
Creating content important to your target audience is an effective way of increasing your average pages per session. There seem to be no particular shortcuts here. If you create high-quality content, your pages per session and conversions will spike!
Interlinking content articles or indicating what the user should do next is the key to increasing average pages per session.
3. Map out a user journey map.
Designing a user experience through your website is important to increase the average number of pages per session. Figure out what page should follow each landing page, then make the next move extremely obvious. Specific call-to-action text, conspicuous CTA buttons, simple navigation, and internal linking are all recommended.
4. Increase the interactivity and engagement of your pages.
Interactive web pages are very good at increasing the average number of pages per session. Customers can spend more time on your website and navigate pages if you have CTAs, in-text internal linking, downloadable content, videos, and some design magic.
5. Concentrate on user experience and navigation
The easiest way to increase pages per session is to significantly improve navigation and integrate it into the site–not just in the main menu. Use sidebars, grouping-related content, and hyperlinks within the body for immediate changes.
After that, select 3-5 pages you want visitors to see each time they visit your site. This may be a booking page or your mission statement, but once identified, these should be visible on your site and not only in the main menu. You will immediately see an increase in the number of pages viewed per session!
6. Have a list of related posts at the bottom of each blog post.
WordPress sites automatically do this, but it’s also a good idea to manually add posts to related posts listing to draw attention to previous posts that could benefit from it.

7. Keep a simple web design.
Websites with high-tech and animated interfaces are more prone to lag and necessitate a more stable and robust internet connection to work properly. Visitors who cannot navigate your website would have a lower page per session rate because they are frustrated by their computer’s slow loading.
8. Create a content hub
Creating content hubs and linking to different sites from each page in the content hub is the easiest and most efficient way to increase the average page views on my blogs.
9. Build content clusters
Each article should be thoroughly covered on its own.
Adopting this strategy will help you establish yourself as an authoritative figure with extensive knowledge of the topic. Furthermore, since the pages are all about the same thing, you can link them internally. Users will navigate from page to page through internal links to fully comprehend the pillar content. This effectively raises your total number of pages per session, thus raising your SERP ranking.”
10. Choose the relevant keywords
There are numerous technical, formatting, and User interface optimization measures that can be taken to increase the number of pages per session and minimize bounce rate. However, the relevancy (or irrelevancy) of the content you serve visitors is at the heart of low page per session and bounce rates.
11. Make use of SEO auditing tools.
The threshold for a site with a good page per session is 4.4, which indicates that the site is almost certain to transact or engage with your content. To be among the best, I ensure my website has engaging content every time. To ensure this, I create high-quality, SEO-optimized blog content.
Using plugins like Yoast or Rank Math for WordPress can help you check off some of the actual items that most make content successful.
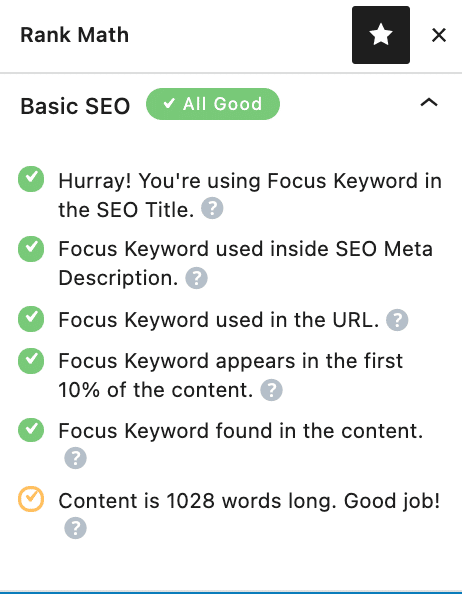
If the content has too much of the same word, it can be spammy, etc. The idea is to not just base your content by checking all the boxes off but use it to measure and track your content performance.
12. Make use of the Skyscraper Method
Including links to similar content on your web inside the body of your posts is a great strategy for increasing average pages per session. This can appear as Skyscraper content that links to different sections of your web, or it can link to other blog articles within the same box of content. Many visitors could use these links to get more information on various topics of interest.
13. Include several articles on the same topic.
Adding the inline related articles section or an anchor text to help your readers is one powerful way we have effectively increased the average pages per session. This will take the reader straight to the next related article. Or if they did end up in your article and it’s not what they were looking for, you can refer to other others that might help them.
Anchor text example:

Inline related post example:

14 Create engaging content
The best approach is to make truly helpful content. If users enjoy your content and see you as a resource, they would be more likely to remain on your site for reasons other than their immediate needs.
This isn’t a fast fix like running a campaign or internal linking, but it can be more effective over time.
15. Create eye-catching headlines
Add beautiful graphics inside your blog posts with eye-catchy headlines, and if anyone clicks on those, they will be led to another blog post on your website. This benefits your readers because they no longer have to navigate your entire website to get relevant content. It also helps you in the long haul because your readers are now staying on your website for longer periods.”
16. Make your readers want to learn more.
When writing a blog post, always include a pitch for another of your blog posts on a similar topic and a link to that related blog post. As a result, readers who enjoyed your first post would inevitably move on to reading a second post, increasing average page views.
To retain and engage your website visitors, you should end your posts with a pitch to see one of your product pages. This is a very easy tip. It can result in significantly higher average page views and stay time when implemented correctly, resulting in higher conversions and better search engine rankings.
17. Make downloadable content available.
The more time your visitors spend, the more likely they will sign up for a service or buy a product. One way to accomplish this is to have some excellent downloadable content. Case Studies and White Pages can provide very informative, topic-specific knowledge that is incredibly useful. It should also entice them to explore your website further and take advantage of the additional information you offer.

18. Add redirect links
I suggest adding links that guide your readers to other content on your site to increase the average number of pages per session. However, make sure to insert the links naturally that bring additional information to the content they are reading. For example, an eCommerce website can include links to customer reviews, related products, etc.
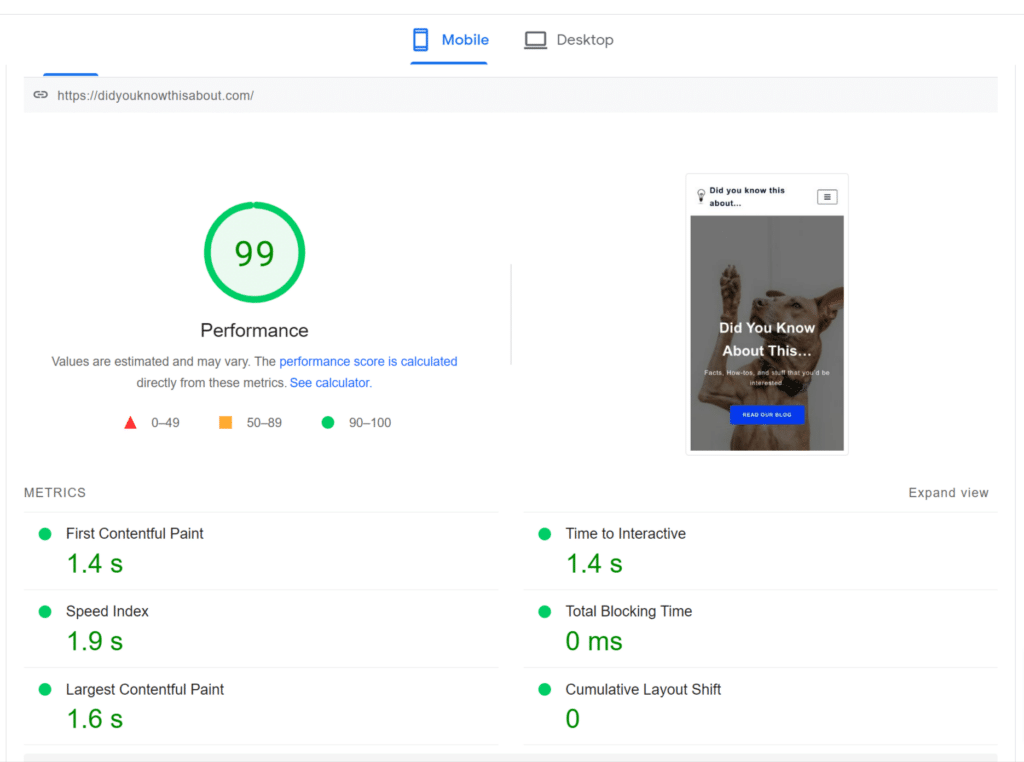
19. Make sure the pages load quickly.
A reader will enjoy navigating and bookmarking a site that loads quickly, is easy to navigate, and has great content. It doesn’t take much site navigation to determine whether pages would take a long time to load. If a visitor thinks he’ll be waiting for the next page to load, he’ll be less likely to hang around.
20. Disable third-party cookies
According to Tiffany Johnson of Wunderman Thompson, “the most powerful way to increase average pages per session is to prevent third-party cookies on your site.” “When a user visits a website, the first pop-up is a regular cookie agreement. You lose half of your traffic as they attempt to fill out the consent form. People will remain if you make things easier and more transparent.”

An entrepreneur and SEO expert, is the driving force behind innovative platforms like linkilo.co, productreview.tools and more. Committed to empowering marketers, Jay continues to make a positive impact in the digital marketing space.
Leave a Reply Cancel reply
You must be logged in to post a comment.
Related Posts:

Affiliate info
General info.
© Copyright Linkilo.co 2023. A Product by SEO RANK SERP LLC | Privacy Policy | Terms and Conditions | Return Policy
2055 Limestone Rd STE 200-C Wilmington, DE 19808 United States
Pages Per Session: How to Track It + Why It’s Important

Pages per session is one of those key metrics that helps you track user engagement and experience.
It measures the average number of website pages viewed by a user during a single session. It provides valuable insights into user engagement, user behavior, content effectiveness, and conversion potential.
This Article Contains
Why is the pages per session metric important, how do you calculate the number of pages per session, what is a good number of pages per session.
- How Do You Track Pages Per Session in Google Analytics?
What Is a Bad Number of Pages Per Session?
5 failsafe tips for increasing the number of pages per session, 8 metrics you should track alongside pages per session, 3 faqs on pages per session.
Let’s get started!
Note : Tracking pages per session is no longer possible in GA4. It is still available in Universal Analytics, which is what we’ll be covering here.
Tracking the pages per session metric can help you make informed decisions to optimize user engagement and improve user experience.
Let’s explore all this in detail:
- User Engagement : Pages per session reflects the level of engagement and interest that visitors have when navigating your website. A higher number of pages per single session typically indicates that users actively explore your site, find value in your content, and spend more time engaging with it.
- Content Relevance: The metric can provide insights into the relevance and quality of your site content. If a visitor is consistently navigating through multiple pages, this suggests that your content is compelling and informative.
- Site Navigation and Structure : This metric can highlight the effectiveness of your website’s navigation and structure. If visitors easily navigate through multiple pages, it suggests that your site’s layout and navigation are intuitive and user-friendly.
Who Should Track the Pages Per Session Metric?
This metric is particularly relevant for businesses that rely on website traffic and content engagement. This includes eCommerce platforms, media and publishing companies, and online service providers (such as SaaS companies).
Let’s now check out how to calculate this metric.
To calculate the number of pages per session, divide the total number of pageviews by the total number of sessions.
Here’s the equation:

In this case, “Total Pageviews” refers to the number of times that site visitors viewed the pages on your website. Meanwhile, “Total Sessions” represents the overall number of individual sessions or visits that users made to your site.
How Often Should You Measure the Pages Per Session Metric?
The frequency of measuring this metric depends on your website’s traffic patterns and site content updates.
For example, if you change the layout of your site or add category pages, measuring your pages per session changes is vital to determine the effectiveness of your changes.
But it’s often best to measure it regularly (daily, weekly, or monthly) to track user engagement and user behavior.
A good number of pages per session ranges from 1.7 to 4.0, according to research conducted by Littledata. But then again, the ideal or “good” number of pages per session for your site can vary depending on factors such as your goals and website type.
Ultimately, it’s best to analyze this metric in the context of your website’s goals, industry benchmarks, and historical data. This will help you determine what constitutes a good number for your specific case.
Now, let’s explore an example.
Let’s say you have the following data for your website:
- Total pageviews: 4,500
- Total sessions: 1,000
Here’s how you’d calculate the pages per session:
In this example, users viewed 4.5 pages during each session on the website.
In simple terms, every site visitor viewed almost five pages on your site before leaving — which is good since it’s above the benchmark discussed earlier. However, if it was lower than 2 pages, it would be best to implement strategies to increase this metric .
How Do You Track Per Session in Google Analytics?
Here’s how to track the number of pages per session in Google Analytics:
- Sign in to your Google Analytics account and navigate to the desired property or website you want to evaluate.
- Once you’ve started your Google Analytics session, click on the “Acquisition” tab in the left-hand sidebar. From there, expand the “All Traffic” drop-down menu and select “Channels.”

- Click on the “Pages / Session” section in the middle pane to track the number of pages per session for your site.

Anything below 1.4 is considered a bad value, according to Littledata.
But what causes the pages per session value to decline? Let’s find out.
What Causes the Number of Pages Per Session to Decline?
These factors can result in a drop in the number of pages per session:
- Poor User Experience : If a website has a confusing layout, difficult navigation, or a slow page load time, users may be discouraged from exploring multiple pages.
- Lack of Relevant Content : If your website fails to provide engaging or relevant content, site visitors may not feel compelled to browse further.
- Single-Page Design or Limited Content : Websites with a single-page structure or limited content (such as landing pages) usually have a lower number of pages per session. That’s because there are fewer pages to explore.
Now, it’s time to discover how you can improve your number of pages per session.
Want to keep visitors hooked so they can navigate through multiple pages on your site?
Try these strategies:
- Research Your Target Audience
- Collect Feedback From Your Potential Customers
- Create a Simple Website and Optimize the User Journey
- Craft Engaging, SEO-Optimized Content
- Track Other Metrics Alongside Pages Per Session
1. Research Your Target Audience
Researching your target audience helps you understand customers’ preferences and interests. You can do this research on social media or through customer surveys and competitor analysis.
And by tailoring your content to customers’ needs, you can increase engagement and encourage users to explore more pages.
2. Collect Feedback From Your Potential Customers
By collecting customer feedback, you can identify areas for improvement and address any barriers that might prevent visitors from exploring more pages.
And how do you gather customer feedback? Use surveys and interviews!
3. Create a Simple Website and Optimize the User Journey
Create a website with a clean and user-friendly interface that prioritizes ease of navigation.
How? Streamline the path to customers’ desired content, ensure smooth transitions between pages, and remove any unnecessary steps or barriers. Also, optimize the user journey by strategically mapping out the flow of your website.
Take a look at Mailchimp’s home page, for example.

If you want to navigate to different pages, there are buttons for that in the top-left corner. And if you want to contact the business, create an account (or log in), you can do that with the buttons in the top right corner. And what if you want to quickly check out their solutions?
You can simply click on each of the sections displayed in the middle pane. Essentially, everything you need is right there, and the information is arranged clearly.
4. Craft Engaging, SEO-Optimized Content
Create engaging, SEO-optimized content that captivates your audience.
This can include:
- Addressing the search intent (the underlying purpose or motivation behind a user who performs a Google search)
- Writing compelling headlines
- Adding relevant internal links
- Using compelling calls-to-action (CTAs)
Sounds complicated? Leave it all to Startup Voyager — a reputed Content and SEO agency. We’ll help you craft engaging, SEO-optimized content that drives traffic and conversions.
The best part? You’ll save all that cash you’d be burning if you were to drive website traffic with link building or a Google Ad.
5. Track Other Metrics Alongside Pages Per Session
While tracking the number of pages per session, also monitor other metrics such as traffic, average session duration (avg session duration), bounce rate, and conversion rate .
Why? This allows you to gain a comprehensive understanding of user engagement and the effectiveness of your marketing strategies .
Let’s now explore some of these metrics in more detail.
The Google Analytics metrics worth tracking along the pages per session metric are:
- Traffic/Users
- New Users/Percent of New Sessions
- Average Session Duration
- Bounce Rate
- Click-Through Rate
- Conversions
1. Traffic/Users
This metric refers to the number of visitors or users who access your website within a given period.
Monitoring it alongside pages per session can help you evaluate the engagement level of visitors and identify any discrepancies. For example, a high traffic volume but low pages per session might indicate that your site isn’t interesting enough for visitors to explore extensively.
2. Sessions
This metric refers to the total number of individual site visits or sessions made on your website within a specific time frame.
A high “sessions” value means that your digital marketing tactics are working because people are visiting your site more often. Meanwhile, tracking pages per session can then tell you if all that traffic is being utilized effectively as they’re extensively viewing your site.
3. New Users/Percent of New Sessions
This metric represents the percentage of users who visit your website for the first time within a given time period.
When you analyze it alongside pages per session, it helps you understand how well your website captivates the interest of first-time visitors. A high percentage of new users with satisfactory pages per session indicates that your site successfully engages new visitors.
4. Page Views
The page views metric (known as “Views” in GA4) refers to the total number of times that users view individual pages on your site.
This engagement metric can help you identify your best-performing pages. And if you want to increase your average pages per session, you can implement the best practices from the pages that garner a lot of views.
5. Average Session Duration
The average session duration (avg session duration) metric represents the average time users spend on your website during a session.
When you analyze it in conjunction with pages per session, it offers a deeper understanding of the user experience. A longer session duration/session length with a higher pages per session indicates that users find value in your content.
6. Bounce Rate
The bounce rate metric represents the percentage of visitors who leave your website after viewing only one page.
This metric is inversely related to the pages per session metric. A high bounce rate typically indicates that users are not exploring additional pages beyond the initial landing page.
7. Click-Through Rate
This engagement metric measures the percentage of users who click on a specific element, such as internal links, CTAs, or a button.
A higher click-through rate on internal links or CTAs within your content can encourage users to navigate to additional pages — potentially increasing the pages per session value.
8. Conversions
The conversions metric measures the percentage of users who complete a desired action on your website, such as buying an item or subscribing to a newsletter. It helps you measure the success of your marketing campaigns and content strategies.
Analyzing pages per session alongside conversions helps you assess the level of engagement, content relevance, and the ability of your website to guide users toward conversion.
Have some doubts? It’s time to explore some FAQs.
Tracking Google Analytics Metrics without fully understanding them can leave you more confused than ever.
But don’t worry!
Below are the answers to questions you may have about this metric:
1. How Does Google Analytics Track Pages Per Session?
Google Analytics tracks pages per session by using a combination of JavaScript code and session-level data. When a user visits your website, Google Analytics assigns a unique identifier (client ID) to that user’s session.
As the user navigates through your website, each pageview triggers a JavaScript tracking code that sends information to the Google Analytics server. The tracking code captures the pageview and associates it with the user’s session based on the assigned client ID.
Google Analytics then counts the number of page views within a session. From there, it calculates the average pages per session by dividing the total number of page views by the total number of sessions.
So, does Google Analytics count the exit page (the last page viewed before leaving a site) when determining the number of pages viewed per session?
Yes, it counts the exit page too!
A page view means that a page on your website has been loaded (or reloaded) by a user. So, that page will be included when calculating the pages per session metric — regardless of the total duration or average time (avg time) spent on it.
2. How Long Does a User Session Last?
In Google Analytics, the default session duration is set to 30 minutes of inactivity. But it’s worth noting that you can modify the total time taken per session in Google Analytics based on your preferences.
3. How Do You Change the Session Timeout Settings in Google Analytics and Universal Analytics?
Here are the steps for changing the total duration that users can spend on your site before a session ends:
- Sign in to your Google Analytics 4 account.
- Navigate to the desired property or website when your Google Analytics session starts.
- Select the “Admin” tab in the bottom-left corner of the screen.

- Navigate to the “Property” column and select “Data Streams.”

- Click the “Web” tab on the next screen (this should display your website URL). From there, click on your website URL to continue.
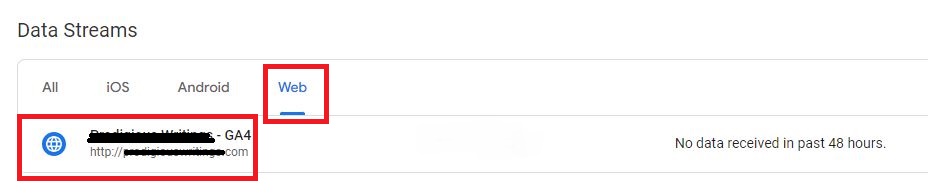
- On the next screen, scroll to the bottom and click “Configure tag settings.” From there, scroll to the “Settings” section and click the “Show all” drop-down menu.
- Select the “Adjust session timeout” option.
- Finally, adjust the settings in the “Adjust session timeout” section. This will now change the total time users can spend on your page before the session ends.

Note : In Google Analytics 4, the minimum allowed session duration/session length is 5 minutes, and the maximum is 7 hours and 55 minutes.
Now, let’s explore how to change the session timeout settings in Universal Analytics:
- Sign in to your Google Universal Analytics account and navigate to the desired property or website.
- Click the “Admin” tab toward the bottom-left corner of the screen.

- Navigate to the “Property” column, click the “Tracking Info” drop-down menu, and select “Session Settings.”

- When you get to the “Session Settings” page, adjust the session timeout duration in the “Session timeout” section. From there, click the “Apply” button to save the changes.

As indicated in the “Session timeout” section, the minimum required timeout value is 1 minute for Universal Analytics, while the maximum is 4 hours.
Boost Your Pages Per Session Value With Top-Notch Content
Pages per session is a vital metric that indicates the level of user engagement on your website. By analyzing it, you can make informed decisions to enhance user experience, optimize content strategy, and drive higher conversion rates.
And if you want to gain a comprehensive understanding of the effectiveness of your marketing strategies, be sure to track pages per session alongside other metrics.
But don’t forget that one of the best ways to increase the number of pages per session is by crafting engaging, SEO-optimized content.

Get in touch with Startup Voyager today and find out how we can help you create top-notch content that can 10x traffic and conversions. 🚗
Want to know the best part? We don’t rely on methods like link building to drive massive traffic to your site.
Share this:
- Click to share on Twitter (Opens in new window)
- Click to share on Facebook (Opens in new window)
About the author
Ready To Acquire Massive Traffic?
We've helped several companies drive hundreds of thousands of visitors/month with SEO and content.
Would you like to know more?
OUR SERVICES
Latest articles, 100+ top venture capital firms in london (2024), top 100 venture capital firms in san francisco (2024), 15 lucrative venture capital events in london (2024), 10 must-attend saas events in london and beyond in 2024, 14 critical b2c seo elements + b2b vs b2c seo, company address.
Level39, One Canada Square, Canary Wharf, London, United Kingdom, E14 5AB
Copyright © 2024 Startup Voyager. All rights reserved.
Privacy Policy
What is Average Page Views per Visit? – Formula and Ways to Increase Average Page Views per Visit [With Examples]

What are average page views per visit?
Average page views per visit measure the average number of web pages a user views on your website. This metric is used to gauge how compelling your site is to your users and how well it is arranged and easy to navigate.
How to calculate average page views per visit?
To calculate the average page views per visit, divide the ‘total number of page views’ by the ‘number of visitors’ and you’ll get the average number of pages a user views on your website.
You need to calculate the average page views per visit for a particular time frame. For example, for a week, 15 days, or a month. You may also calculate the average page views per visit for different segments – based on country, region, gender, or preference.
Formula for calculating average page views per visit

Real-life Eexample of average page views per visit
Take a look at an example to understand the average page views per visit:
Let’s say you get a total of 1,000 page views in a week on your website. In the same week, the total number of visitors to your site was 500.
Now, the average page views per visit are: 1000 / 500 = 2 page views. This means, when a user visits your website, they go through 2 pages of your website, on average.
What’s considered a good page views per visit? (benchmark)
The average number of page views per session across all industries is 4. It depends on your business model, industry, and many other factors.
Littledata surveyed 5,941 sites in September 2022 and found the average number of pages per session was 2.6 .
A score of more than 4.4 shows that your site is doing better than most!
But if you can’t achieve an average number of pages per session above 2, you immediately need a round of optimization on the homepage, add more relevant content, and get that number up.
According to the latest data (from the second quarter of 2022) consumers browse through an average of 6.5 pages on US eCommerce stores every time they visit.
The grocery segment had the highest average page view count of 7 in 2021, while B2B had the lowest, with an average of 2 page views per session.
Ways to increase your page views per visit
- Focus on user experience and navigation: Pay attention that your navigational elements are well arranged and easily discoverable. If your site will be difficult to navigate then, visitors will leave prematurely out of frustration and lack of information. Read the Essential Guide to Website Navigation .
- Create great content and optimize it: You need to create great content for your blog above all else, to hook visitors – making them want to read more and discover your services, thus increasing your page views. Not only this, but blogging is also important for several other reasons .
- Promote related blog posts in the sidebar: Use your website’s sidebar to display the related blog content section to nudge people to read your other blog posts and a search option as well.
Also Read: Related Metrics
- SEO Click-through Rate
- Website Conversion Rate
- Bounce Rate
- Average Session Duration
Subscribe to our newsletter
Occasionally, we send you a really good curation of profitable niche ideas, marketing advice, no-code, growth tactics, strategy tear-dows & some of the most interesting internet-hustle stories.
DEMYSTIFIED
Average page views per visit.
Average page views per visit are an excellent indicator of how compelling and easily navigated your content is. Definition The total number of page views divided by the total number of visits during the same timeframe.
Page Views / Visits = Average Page Views per Visit
Sophisticated users may also want to calculate average page views per visit for different visitor segments.
Presentation Presentation of average page views per visit can be supplemented by associating the monetary value of a page view for the advertising business model. Based on an average cost per thousand (CPM) advertising impressions, you can calculate the value of the average visit as follows:
Average Dollar Value / 1,000 Page Views * Page Views / Visit = Value of Average Visit
For example, an advertising site having an average CPM of $25.00 and an average 3 page views per visit would make the following calculation:
$25 / 1,000 page views * 3.00 page views / visit = $0.075 per visit
Expectation Expectations about average page views per visit depend on your business model.
• CPM-based business models that depend on high page view volumes should work to increase the average number of page views per visit, thusly increasing the value of each visit. • Marketing and retail sites generally want to increase this average, indicating a greater interest on the part of the visitor. However, depending on the specific goals of the site, more page views can indicate confusion on the part of the visitor. • Customer support sites generally want to decrease the number of page views per visit, at least in sections specifically designed to help visitors find information quickly.
Action When the average number of page views per visit trend against expectations, I recommend examining a handful of common site components that affect page views:
• Navigational elements (e.g., your information architecture). If it is difficult for visitors to navigate your site they will often be forced to view more pages as they hunt. Conversely, if your site is difficult to navigate, visitors may leave your site prematurely out of frustration. • Content. If your content is poorly written and doesn’t follow best practices for writing for the web, visitors may leave your site prematurely. Conversely, if your content is well written, visitors may be inspired to “keep reading”, driving up the average number of page views. • Search technology. If your search functionality is poor, visitors may be forced to click to look for information. Conversely, if your search functionality is good, visitors may be leveraging search, thusly reducing the number of pages viewed. • Marketing efforts. If your marketing efforts are poorly targeted, visitors are less likely to view many pages. Conversely, if your marketing efforts are good, visitors may view a large number of pages.
It is worthwhile to use the KPIs for average time spent on site and average time spent on pages for key pages when diagnosing problems with average page views per visit. You may also want to look at how your internal search application is being used by examining percent visitors using search, percent “zero result” searches and average searches per visit.
Leave a Reply Cancel reply
Discover more from analytics.
Subscribe now to keep reading and get access to the full archive.
Type your email…
Continue reading
- Metric Library
- Integrations
- HubSpot Marketing
Pageviews / Session

The Pageviews / Session metric measures the average number of pages viewed per session on a website. It helps to understand the engagement level of website visitors and their interest in exploring different website pages.
With Databox you can track all your metrics from various data sources in one place .

- Tech details
Visualizations

Used to show a simple Metric or to draw attention to one key number.
How to track Pageviews / Session in Databox?
Databox is a business analytics software that allows you to track and visualize your most important metrics from any data source in one centralized platform.
To track Pageviews / Session using Databox, follow these steps:
- 1 Connect HubSpot Marketing that contains the metric you want to track
- 2 Select the metric you want to track from the list of available metrics
- 3 Drag and drop the selected metric onto your dashboard
- 4 Watch your dashboard populate in seconds
- 5 Put Pageviews / Session on the Performance screen
- 6 Get Pageviews / Session performance daily with Scorecards or as a weekly digest
- 7 Set Goals to track and improve performance of Pageviews / Session

Set Goals to track and improve your performance

Get your daily progress every morning with Scorecards

Receive detailed weekly performance updates

Built your own custom metrics with Metric Builder

Get instant insights into your top-performing metrics
- Description The Pageviews / Session metric measures the average number of pages viewed per session on a website. It helps to understand the engagement level of website visitors and their interest in exploring different website pages.
- Category Marketing
- Subcategory Page views
- Date Added 2015-07-09
- Cumulative Support No
- Favorable Trend increasing
- Changing historical data No
- Forecast Support Yes
- Benchmark Support Yes
- Dimension N/A
- Metric Type general Learn more
- API Value Key
- API Dimension Key
- API Endpoint https://api.hubapi.com/analytics/v2/reports/sources/{time_period1}/{time_period2}
Related Metrics
New contacts by direct traffic source.
This metric shows the number of new contacts acquired through direct traffic sources, such as typing in the website URL or clicking on a bookmark.
New Contacts by Paid Social Source
The New Contacts by Paid Social Source metric shows the number of new contacts gained from paid social media advertising campaigns.
The Contacts metric in Hubspot tracks the number of individuals in your database, including leads, customers, and any other individuals you may have added through various sources. This information can be used to measure the size and growth of your audience, as well as inform your marketing efforts and outreach strategies.
Contacts (w/o Offline Source)
The Contacts (w/o Offline Source) metric in Hubspot measures the number of contacts in your database that were acquired through online channels such as website forms, landing pages, social media, and email, excluding any offline sources such as events or direct mail.
Emails Delivered by Email Title (by Create Date)
The Emails Delivered by Email Title (by Create Date) metric shows how many emails were successfully sent to recipients with a specific email title during a specified time period.
Emails Unique Opened by Email Campaign
Emails Opened by Email Campaign is a metric that measures the number of times a recipient opened an email sent as part of a specific campaign.
Emails Unique Clicked by Email Title (by Last Updated)
The Emails Clicked by Email Title (by Last Updated) metric measures the number of clicks on each email title, sorted by the date the email was last updated, providing insights into the effectiveness of recently updated email campaigns.
Recent Blog Posts by CTA Clicks
The Recent Blog Posts by CTA Clicks metric in Hubspot tracks the number of clicks generated by the calls-to-action (CTAs) within your blog posts over a specific period of time. It helps you understand the effectiveness of your CTAs and improve your content strategy for better engagement and conversion.
Track all of your key business metrics from one screen

Build your first dashboard in 5 minutes or less
Latest from our blog
- Playmaker Spotlight: Tory Ferrall, Director of Revenue Operations March 27, 2024
- New in Databox: Safeguard Your Data With Advanced Security Settings March 18, 2024
- Metrics & KPIs
- vs. Tableau
- vs. Looker Studio
- vs. Klipfolio
- vs. Power BI
- vs. Whatagraph
- vs. AgencyAnalytics
- Product & Engineering
- Inside Databox
- Terms of Service
- Privacy Policy
- Talent Resources
- We're Hiring!
- Help Center
- API Documentation
- For Agencies
- Case Studies
- Resources Product Updates Features Roadmap Free SEO Tools Blog Help Center Educational Partnership Affiliate Program
Pages Per Session: How to Calculate, Improve, and Understand Different Benchmarks Across Niches

- What is Pages Per Session?
Tracking the Number of Pages Per Session
- Google Analytics 4 (GA4) and "Pages Per Session" Metric
How Pages Per Session Metric Impacts SEO
- Common Problems and Solutions
- Manage "Pages Per Session" and Analyze User Behavior On-Site
Free SEO Audit
Crawl the website for technical issues and get a prioritized to-do list with detailed guides on how to fix.
“Pages per session” is a web analytics metric that represents the average number of pages viewed by a user during a single visit or session on a website. It indicates user engagement and the effectiveness of site navigation.
To keep new visitors returning to your website, you need to monitor their interactions using metrics like ‘Pages per session’. A ‘session’ refers to a user’s activities on your site within a specific period.
Understanding the difference between ‘sessions’ and ‘clicks’ is crucial, with ‘sessions’ being time-bound and ‘clicks’ being action-driven. ‘Pages/session’ is the average number of pages a user views per visit, calculated by dividing total views by the number of sessions.

This metric is key for measuring site engagement and can help drive revenue. For instance, an average of three ‘pages/session’ means a user typically visits three pages before leaving. For online retailers, showing more product options increases the chance of customer purchases.
Tracking the number of the metric is often done using web analytics tools like Google Analytics. Here’s a simplified guide to doing this:
- Set up Google Analytics. First, you’ll need to have Google Analytics installed and properly configured on your website.
- Access the Report. Once Google Analytics is set up and collecting data, you can access the report that contains all session and tracking data. To do this, log in to your Google Analytics account, then navigate to your website’s profile.
- Find Pages per Session Metric. To find the metric, go to “Audience” in the left-hand side menu, then click on “Overview.” This will take you to the Audience Overview report.
- Analyze the Data. On the Audience Overview report, you’ll see a number of metrics listed, including sessions, users, pageviews, the number of screens viewed per visit, and more. The “Pages/Session” metric tells you the average number of pages viewed per visit.

Remember, like all metrics, it should be analyzed in context and used alongside other metrics to get a complete picture of your site’s performance and user engagement.
Google Analytics 4 (GA4) and “Pages Per Session” Metric
In Google Analytics 4 (GA4), “Pages/Session” is now termed as “Engagement per session”. It is a new approach that focuses on the engagement of a user in a visit rather than the number of publications viewed.
This move toward engagement-based metrics aligns with Google’s focus on user experience, allowing for a more holistic understanding of user behavior. This shift acknowledges that user engagement can take many forms beyond just views, including events like clicks, form submissions, video plays, and other interactions.
Google Analytics 4 (GA4) now empowers users with the flexibility to change the conversion counting technique, introducing an option of “once per session”, mirroring the operation style of Universal Analytics (UA).
This enhancement was initially identified by Charles Farina, a leading expert in GA4 & Adobe Analytics at Adswerve, and was subsequently verified on a Google support page .

To access engagement data in GA4, follow these steps:
- Log in to your Google Analytics account.
- Navigate to the appropriate GA4 property.
- In the left-hand menu, select “Engagement,” then click “Engagement Overview.”
In this section, you can see various metrics that detail user engagement, including “Engagement Time” and “Engagements.” These metrics should help you better understand user behavior and how users interact with your website during their visit.
While GA4 doesn’t provide an exact equivalent to the old “Pages/Session” metric, you can still gather insightful data on how users engage with your website. This new focus can offer a more comprehensive view of visitor behavior.
“Pages per session” is a significant metric when evaluating user engagement on a website, and it indirectly influences SEO in the following ways:
- User Engagement. A higher “pages/session” value typically implies that visitors find your content compelling and are sufficiently engaged in exploring further sections of your site. This engagement could result in longer visit durations, which search engines might interpret as a positive user experience.
- Bounce Rate. A low “pages/session” rate could be associated with a high bounce rate, i.e., when users exit your site after viewing only one screen. This could adversely affect your SEO if the high bounce rate stems from users not finding the desired information.
- Interlinking and Site Structure. A high “pages/session” rate might indicate that your interlinking strategy and site navigation are effectively encouraging users to spend more time browsing your website. This helps search engines comprehend your site’s structure, which can enhance indexing.
- Indirect SEO Benefits. Although it is not a direct ranking factor for search engines, it can offer valuable insights to bolster your SEO strategy. If you discern which content spurs more user interaction, you can optimize these pages/posts and apply similar strategies to others.
Bear in mind, SEO is a complex process encompassing numerous factors. While “pages/session” is a useful metric for understanding user behavior, it should be contemplated as part of a more comprehensive SEO strategy. Prioritizing the creation of high-quality, relevant content for your users is always crucial.
Common Problems and Solutions: How to Improve the “Pages per Session” Metric
Low pages per session.
If your analytics indicates that users are viewing a few pages/sceens per visit, this could signify that users aren’t finding your site engaging or useful enough to explore further.
Solution: Elevate the quality and relevance of your content. For example, if you operate an SEO blog, ensure that your articles are informative, up-to-date, and relevant to your audience’s interests. Also, make your website navigation intuitive and use internal links effectively, guiding visitors to other relevant content, like from a basic SEO guide to a more detailed article on keyword research.
High Pages per Session but Low Time on Site
If users view many pages per session but spend little time on your site, they may quickly click through your site without genuinely engaging with your content.
Solution: Reevaluate your content quality and its presentation. For example, if your site is a cooking blog, ensure your recipes are well-written, visually appealing, and easy to follow. Also, verify your site’s loading speed, as slow loading can lead to users clicking away out of impatience.
Misinterpretation of the Metric
Sometimes, a higher result doesn’t mean a better user experience. For example, a user might be visiting multiple publications because they can’t find the information they seek, not because they’re engaged.
Solution: Always analyze this metric alongside others, like bounce rate, visit duration, and user feedback. For instance, if you run an e-commerce site, conduct user experience testing to understand visitor behavior better and use the insights to streamline the shopping process.
Irrelevant Pages Inflating the Metric
Occasionally, users might visit your privacy policy or terms and conditions, which could inflate your metric without indicating real engagement.
Solution: When analyzing your metric, exclude the pages by segmenting your data. Focus on those that are pertinent to your primary content or user goals. For example, if your site offers online courses, pay more attention to others, like course descriptions, user reviews, and enrollment screens.
Misconfigured Google Analytics
In some cases, the metric might be inaccurate if your Google Analytics setup is flawed.
Solution: Ensure Google Analytics is correctly implemented across your website. If your site is large, like a news portal with multiple categories and subcategories, consider using a tool to perform an audit of your Google Analytics setup.
Remember, this metric is just one of many metrics that can help you comprehend user behavior on your site. Always contemplate it within the larger context of your site’s performance and objectives.
Manage “Pages Per Session” and Analyze User Behavior On-Site With Website Traffic Checker

SiteChecker’s Traffic Checker can provide insights into overall website traffic.
Understanding your traffic sources and audience demographics, which Traffic Checker provides, can support strategies to improve user engagement and, consequently, the time people spend on your site.
Furthermore, by using SiteChecker’s Traffic Checker, you can identify which pages attract the most visitors and from what sources. This can allow you to focus on improving the user experience and the content, potentially leading to higher “Pages/ Session” rates.
A well-rounded approach, combining valuable insights from Traffic Checker with other user behavior metrics, can guide your strategies for enhancing user engagement and website navigation efficiency.
“Pages per Session” is a key metric indicating the average number of pages viewed per user visit on a website. It’s crucial for user engagement and indirectly impacts SEO. It’s tracked via tools like Google Analytics and should be analyzed alongside other metrics for a comprehensive site performance view. Issues like low “Pages/session”, high “Pages/session” with low site time or irrelevant pages inflating the metric can be mitigated through strategies like improving content quality, site navigation, and proper analytics implementation.
Overall, it’s not just about enhancing the metric but boosting overall user engagement.
What is 'Pages per Session' in Google Analytics?
What constitutes a good 'pages per session' value, how can i increase the 'pages per session' metric, what is the formula for 'pages per session', how many 'pages per session' is considered a benchmark, what's the difference between pageviews and 'pages per session', what kind of website might use 'pages/screens per session' goals.
Marketing expert
Ivan works as a product marketing specialist at Sitechecker. Obsessed with analytics and creating a business strategy for SaaS products.
Check Your Website for SEO Errors
You may also like
- Collections
What is Pages Viewed per Session? What is the formula and why it is important

If you’re a business owner or marketer, you know it’s important to keep track of your website’s analytics. One statistic you may be interested in is the number of pages viewed per session. In this blog post, we’ll explain how to increase the number of pages viewed per session on your website. We’ll also provide tips on improving your website’s overall user experience.
What Is Meant By Pages Viewed Per Session?
The number of pages a person can view in a particular session is known as the pages viewed per session. You can calculate this metric when you divide the pageviews by the number of sessions in total.
While pages viewed per session is a fairly straightforward metric, it can still be helpful in understanding your audience’s engagement with your site. For example, if you see that the average number of pages viewed per session is low, it could indicate that your visitors are leaving your site quickly.
On the other hand, a high number of pages viewed per session could mean that users are finding your site’s content interesting and are spending more time on your site as a result.
Why Are Pages Viewed Per Session Important?
It is crucial because your website’s success depends on how well it can keep the user interested enough to explore pages beyond their initial landing page. A site with high Page Views Per Session and a long Average Time On Page will generally lead you towards higher conversion rates for potential customers!
When it comes to analyzing website performance, there are many different metrics that you can track. However, one of the most important measures of success is pages per session. This metric tells you how many pages, on average, each user visits during a single session.
A high page per session indicates that users find your site informative and engaging and spend time exploring its content. Conversely, low pages per session could mean that users quickly leave your site due to a lack of interest or poor navigation. For this reason, tracking your pages per session number and striving to increase it over time is essential. Doing so can ensure that your website provides an enjoyable experience for users and drives conversions.
How To Calculate Pages Viewed Per Session
To calculate the number of pages viewed per session, divide the total number of pageviews by the total number of sessions. This number will give you an average of how many pages are viewed during each session.
Count(Total Page Views) / Count(Total Sessions)
Keep in mind that this is just an average, and some sessions may have more or fewer pages viewed. Additionally, you can use this metric to compare the average number of pages viewed per session between different periods.
For example, you might want to see if there has been a change in the average number of pages viewed per session over the course of a month. If you notice a significant decrease, this could indicate that your website is losing users’ attention.
Various other factors could also influence this metric, so be sure to consider those. Ultimately, the number of page views per session is just one metric that can be used to assess user engagement on a website.
What Are Good Pages Viewed Per Session?
The more pages a site has, the better. A score of 4 or 5 is what you can expect from sites in the top 20% for an average number per session – with six being excellent!
Here is an example of a grocery store having the best page views per session:

After all, if a website’s average number of pages viewed per session is low, that could be a sign that something’s wrong – either with the website or with how users interact with it. On the other hand, if a website’s average number of pages viewed per session is high, that could be a sign that users are engaged and finding the content they’re looking for. So what is a “good” number of pages viewed per session? Unfortunately, there’s no easy answer to that question.
It depends on the type of website, the type of content, and the user base. For example, a news website might have more pages viewed per session than an e-commerce website because users typically read multiple articles in one sitting. Similarly, a website with long-form content might have more pages viewed per session than a website with shorter articles because users need to click through multiple pages to read the whole piece. Ultimately, it’s up to each website to decide the number of pages viewed per session is right for them.
Tools To Track Pages Viewed Per Session
There are two most helpful tools that you can use to track your pages viewed per session:
- Google Analytics
Track Pages Viewed Per Session By Gooogle Analytics
You can use Google Analytics Acquisition Overview to track pages viewed per session. It is located along the sidebar at the left.

You can get the overview of your complete website’s total pages per session here.

In order to see all of your traffic reports, go into Google Analytics and select Acquisition>All Traffic from the left sidebar.

This is where you can see ho w many pages an individual user views on their first visit. This will give insight into what channels are driving higher-engagement visitors so that we know which ones need more focus for success!

Track Pages Viewed Per Session By Databox
Page views are an important metric for marketers to track. It’s good practice but even more helpful when visualized in a way that makes it easy and quick to spot trends or discover insights from your data set by using Databox’s Pages Per Session visualization tool!
Here are some ways we know:
Pages Per Session
You can also see in this line graph how our engagement has been fluctuating over time. It’s essential to track the success of different campaigns by looking at these daily fluctuations so we know which ones work best for us!

Organic Pages Per Session
Each page can be segmented by channel or source so you’ll know when it’s most appropriate to post on social media.
The bar graph in Databox helps you visualize your average pages per session, specifically from organic traffic. Suppose it’s a content marketing strategy that works for you. In that case, we recommend using this type of visual representation on an entry page. Visitors are more likely to leave once they’ve seen all there is and go elsewhere. So knowing who has come back after clicking through can give insight into whether or not these people find what interests them about our site before leaving again!

Tips To Increase Pages Viewed Per Session
It’s no secret that one of the key metrics for any website is pages per session. This metric tells you how many pages, on average, a user views during a given session. Here are the top 10 tips to increase the pages viewed per session:
Improve Your Website’s Navigation
Make it easy for users to find their way around your site. Use clear and concise labels, and consider using drop-down menus or other navigational tools.
Create Compelling Content
Your content should be interesting and engaging, prompting users to click through to additional pages. Write headlines that grab attention and use rich media, such as images, infographics, and videos.
Promote Your Content
Ensure your target audience is aware of your content by promoting it through social media, email marketing, and other channels.
Use Internal Links
Link to related content within your website to keep users engaged and encourage them to explore more of your site.
Implement Google Analytics
Google Analytics can help you track how users interact with your website, providing valuable insights into which content is most popular and where users are dropping off.
Create A Search Engine Optimization (SEO) Strategy
Optimizing your website for search engines can help ensure that your content is more likely to show up in search results, driving traffic to your site.
Use External Links
In addition to internal links, use external links to direct users to be relevant and authoritative sources. This helps to improve the credibility of your site.
Make Your Website Mobile-Friendly
With more and more users accessing the internet from mobile devices, it’s important to make sure your website is optimized for mobile. This includes using a responsive design and ensuring that content is easily read on smaller screens.
Use Pop-Ups Sparingly
Pop-ups can be annoying, so use them sparingly and only when they’re truly relevant. For example, you might want to use a pop-up to promote a contest or offer.
A/B Test Your Website
Testing allows you to compare two versions of your website to see which one performs better. This is valuable for fine-tuning your website and increasing pages per session.
Try implementing these tips to improve your pages per session metric. And remember, always measure and track your results to optimize your website over time.
By increasing the number of pages viewed per session, webmasters can increase users’ time on their site, leading to more conversions. The key is to keep users engaged by providing interesting and relevant content. There are many ways to do this, including incorporating multimedia, engaging headlines, and providing internal links. By implementing these tactics, webmasters can keep users engaged and encourage them to view more pages on the site.
Want to learn more ?

What is Opportunity Win Rate? What is the formula and why it is important
What is Opportunity Win Rate? Opportunity Win Rate (OWR) is a metric used to measure the success of sales teams and organizations in converting potential...

What is Operating cash flow? What is the formula and why it is important
What is the Operating Cash Flow (OCF)? The Operating Cash Flow (OCF) is a measure of the cash generated from a company’s normal, ongoing business...

What is Net Profit Margin? What is the formula and why it is important
Net Profit Margin, also known as profit margin or income margin, is one of the most popular metrics that can provide valuable insight into a...

What is Net Profit? What is the formula and why it is important
What is Net Profit? Net Profit, also known as the bottom line or net income, is an accounting measure that indicates how much profit a...

What is Net Revenue Retention? What is the formula and why it is important
What is the Net Revenue Retention? Net Revenue Retention is a measure of the percentage of revenue retained by a company over time. It is...

What is Net Sales Efficiency? What is the formula and why it is important
What is Net Sales Efficiency? Net Sales Efficiency (NSE) is a measure of how effective a company’s sales team is at converting opportunities into actual...

What is New Net ARR? What is the formula and why it is important
What is the New Net ARR? The New Net ARR (Annualized Recurring Revenue) is a metric that measures the amount of annual recurring revenue for...

What is Ticket Volume? What is the formula and why it is important
Are you struggling to keep up with ticket volume demands? If so, you’re not alone. Every day, businesses of all types must grapple with the...

What is Pipeline Volume vs Goal? What is the formula and why it is important
Technology can help streamline processes and optimize your pipeline operations. Investing in the right technology can provide you with an edge over competitors and help...
Get in the game
Free tools and resources like this shipped to you as they happen.
Comments (0)
There are no comments yet :(
Leave a Reply Cancel reply
Your email address will not be published. Required fields are marked *
Save my name, email, and website in this browser for the next time I comment.
Information
- Consulting Options
- Financial model consulting
- Fundraising support structure
- Fundraising support structure application
- Startup support structure
- Startup support structure application
Start and Raise
Financial models.
- Pitch decks
- Deal structures
- Mergers and Acquisitions
- Marketplace
- App Social Financial Model
- Ecommerce Financial Model
- Enterprise SaaS Financial Model
- Marketplace Financial Model
- Basic Marketplace Financial Model
- SaaS Financial Model
- Subscription Ecommerce Financial Model
- Professional Cap Table Model
- Pro OKR PPP KPI Tracker Tool
- Investment Banking Presentations
- Complex Charts
- Excel Productivity Addin
- Simple pitch deck template
- About Alexander Jarvis
- About 50folds
- Report a bug
- Can I call you
Consulting Icon
Education icon, models icon, resources icon, join our newsletter.
COMMENTS
Pages per visit is a Web analytics measure of how many pieces of content (Web pages) a particular user or group of users views on a single website. Pages per visit is usually displayed as an average, which is calculated by dividing the total number of page views by the total number of visitors. It can be further broken down by country, region ...
Pages per Visit or PPV is a user engagement metric that measures how many pages, on average, users view during a single visit to a website. It serves as a key indicator of user interest and interaction. Pages per Visit is like counting how many pages people look at when they visit a website within a single session.
Using this metric. For most websites, the goal is to keep users engaged, nurture their interest, and encourage them to take the next step. Use pages per visit in conjunction with other engagement metrics to understand your visitors' on-site activities and stickiness, and to evaluate how likely users are to complete the website goal (page ...
A page view occurs when a page on your website is loaded or reloaded whether the user was already on your page or came from an external page. A page visit, on the other hand, only occurs when someone lands on your site from an external page, such as Google or another website. So technically, every page visit is a page view, but the same is not ...
Why Pages Per Visit Metric is So Important. Pages per visit measures or at least indicates quite a few attributes of a site: Navigation. Speed. Depth and quality of content. Relevance of content. In general, user experience. Sites with thoughtful and easy to use navigation will have a higher PPV number because people will click on more pages.
An average of the number of pages viewed during a visit on your site. Pages per session broadly gauges how compelling users find your content and the ease of access. ... Not to be confused with events, conversions are the outcomes mentioned in the definition and signify the reason why your site exists. Although events are incredibly important ...
Understanding Basic Visitor Metrics. Learn about Page Views, Visits, and Visitors in Adobe Analytics. Get definitions of these basic visit metrics and learn about their similarities and differences. Learn the various terms (synonyms or keywords) associated with visitor metrics and Website traffic. View a sample Workspace project that shows how ...
pages per visit. The average number of pages viewed during a visit to a site. Repeated views of a single page are counted. ← Previous Next →.
Usually, number of pages viewed per visit doesn't change that much and it is a measure that is overlooked. Usually this metric changes a lot of when something technically goes wrong, and then the bounce rate drops or shoots up. ... Meaning you want to be able to segment and see how different segments do differently for a number of pages ...
A page visit (or visit) occurs when a reader clicks on your website from an external source. This could be from social media, another website, or from typing in your URL directly into their web browser. Once someone lands on your site from somewhere outside of your website domain, it officially counts as a page visit.
Pages per visit measures the volume of content (Web pages) a particular user or a group of users views on one single website. Pages per visit is displayed as an average, which is the total number of page views divided by the total number of visitors.
Sessions. This figure depicts the number of visitors who engage with your website over a given period of time. When someone visits your website, a session begins, and it normally ends a few minutes after he or she stops doing so. A Google Analytics session normally terminates after 30 minutes of inactivity.
Pages per visit reflects how many pages a site visitor views in a single visit. A high pages per visit number is a sign of compelling content, strong engagement and effective navigation. It increases time on site, which is known as a positive signal to search engines. ... More page views and pages per visit mean more ad revenue, ecommerce ...
Page views per visit and bounce rate are important metrics for measuring the health of a website. Together, these two metrics let website owners know just how relevant, interesting, and engaging their content is. Properly monitored, these metrics can reveal important information to help webmasters convert good sites into great sites and great sites into stellar sites.
Say your website had 75,000 page and screen views in one month with 50,000 sessions. Calculate your page views per session like this. 75,000/50,000 = 1.5. On average, every visitor who visited your site viewed 1.5 pages per session during the month (or evaluated period.) Now, users don't view half the pages.
Pages-per-session is an advantageous metric because it cuts out much of the gray area that others, like time-on-site, necessitate. It's an absolute answer to how many pages people load with each visit to your site. It becomes easier to more directly track the correlation between template changes, like changing your related posts or organic ...
The average number of pages per visit - is 5.6; Average visit duration - 3m 56s; Average bounce rate - 47.28%; Compared to 2019, the trend is declining, making this metric even more significant. People's attention spans seem to be getting shorter and shorter, so you must build a one-of-a-kind shopping experience to conquer their hearts ...
Navigate to the desired property or website when your Google Analytics session starts. Select the "Admin" tab in the bottom-left corner of the screen. Navigate to the "Property" column and select "Data Streams.". Click the "Web" tab on the next screen (this should display your website URL).
Real-life Eexample of average page views per visit. Take a look at an example to understand the average page views per visit: Let's say you get a total of 1,000 page views in a week on your website. In the same week, the total number of visitors to your site was 500. Now, the average page views per visit are: 1000 / 500 = 2 page views.
Average page views per visit are an excellent indicator of how compelling and easily navigated your content is. Definition The total number of page views divided by the total number of visits during the same timeframe. Page Views / Visits = Average Page Views per Visit Sophisticated users may also want to calculate average page…
The Pageviews / Session metric shows the average number of pages viewed by a user during a single session on a website. It is calculated by dividing the total number of pageviews by the total number of sessions. This metric helps to measure the engagement level of website visitors. A higher number indicates that visitors are exploring more ...
Jun 2, 2023. "Pages per session" is a web analytics metric that represents the average number of pages viewed by a user during a single visit or session on a website. It indicates user engagement and the effectiveness of site navigation. To keep new visitors returning to your website, you need to monitor their interactions using metrics ...
Conversely, low pages per session could mean that users quickly leave your site due to a lack of interest or poor navigation. For this reason, tracking your pages per session number and striving to increase it over time is essential. Doing so can ensure that your website provides an enjoyable experience for users and drives conversions.