Destination Insights with
Skip to Content

Keep up with the latest travel trends
Smart business decisions rely on good insights. Keep your finger on the pulse of ever-changing global travel demand trends with actionable data, updated daily. Check out some top insights for your country below, or use the filters to find the data most relevant to you.
1}" > Fastest-growing destination globally
1}" > country with the most inbound interest, top insights for your selected country.
- Inbound destination demand
- Outbound destination demand
- Global trends
1}" > Top 3 sources of inbound demand
1}" > top city in demand (internationally), 1}" > top city in demand (domestically), 1}" > inbound demand growth, 1}" > top 3 destinations for outbound demand, 1}" > top city in demand internationally, 1}" > demand growth for top international city, 1}" > demand growth for outbound travel, 1}" > top 3 countries for worldwide demand, 1}" > top 3 cities for worldwide demand, 1}" > country with fastest growing inbound demand, 1}" > city with fastest growing inbound demand, click into the details of travel demand.
Switch between understanding country-specific demand trends, and comparing flight and accommodation demand across countries. Use the filters to refine your search.
Country-specific travel demand
Use the tabs below to discover inbound and outbound demand trends for your selected origin and destination countries., trends in country demand, city and regional demand, growth of demand, sources of demand.
View the demand trend for travel from a selected origin to a selected destination.
- Tap on the chart for more details
- The chart is horizontally scrollable
Understand the relative popularity of cities in your selected destination country. For a broader view of popular destinations for travellers in your origin country, set your destination filter to ‘Worldwide’.
Top demand by destination area
- {{$index+1}} {{item.code}} {{item.queries}}
Top demand by destination country
- {{$index+1}} {{item.country.name}} {{item.queries}}
Top demand by destination location
Top demand by destination city
Understand how demand has shifted over time for your destination country, the area it belongs to, and the cities within it.
Top growth by destination area
- {{$index+1}} {{item.code}} {{item.growthScale}}
Top growth by destination country
- {{$index+1}} {{item.country.name}} {{item.growthScale}}
Top growth by destination location
Top growth by destination city
- -10% to 10%
- -10% to -25%
- -25% to -50%
- -50% to -75%
Find out where inbound demand for your selected destination is coming from.
TOP DEMAND BY ORIGIN LOCATION
TOP DEMAND BY ORIGIN COUNTRY
- {{$index+1}} {{item.location}} {{item.queries}}
Visit Google Trends to learn more.
Comparative flight and accommodation demand data
See at a glance how different countries rank for accommodation and airline demand, with relation to inbound demand to and outbound demand from your primary country. use the filters above to select a primary country and up to 10 other countries to compare..
INBOUND INTEREST FROM SELECTED COUNTRIES TO PRIMARY COUNTRY
OUTBOUND INTEREST FROM PRIMARY COUNTRY TO SELECTED COUNTRIES
Explore these resources for additional insights
- Google Trends
Gauge consumer search behaviour over time on any topic.
- Grow with Google
Explore free training, tools and resources to grow your skills.
US Travel Header Utility Menu
- Future of Travel Mobility
- Travel Action Network
- Commission on Seamless & Secure Travel
- Travel Works
- Journey to Clean
Header Utility Social Links
- Follow us on FOLLOW US
- Follow us on Twitter
- Follow us on LinkedIn
- Follow us on Instagram
- Follow us on Facebook
User account menu
The latest travel data.
MONTHLY INSIGHTS March 04, 2024

U.S. Travel has temporarily paused our monthly data newsletter, however, the latest travel data is still available via the U.S. Travel Insights Dashboard . This dashboard is updated each month (member login required).
The U.S. Travel Insights Dashboard , developed in collaboration with Tourism Economics, is supported by more than 20 data sources. The dashboard is the most comprehensive and centralized source for high-frequency intelligence on the U.S. travel industry, tracking industry performance, travel volumes and predictive indicators of recovery including air and lodging forecasts, DMO website traffic, convention and group trends, travel spending and losses, traveler sentiment, among others to measure the health of the industry.
Key Highlights January 2024:
- Travel appetite started the year on a softer note, but overall growth continued. Air passenger growth remained positive, up 6% versus the prior year but lower than the double-digit growth seen through 2023. Foreign visits remained strong, up 24% YoY.
- Hotel room demand continued a trend of slight contraction falling 1% versus the prior year, while short-term rental demand grew 1%, a lower rate than 2023.
- A particular bright spot was that group room demand within the top 25 markets displayed solid growth of 9% relative to the prior year.
- The outlook for the economy remains fairly optimistic due to the strength of the labor market, looser financial conditions and healthy household and nonfinancial corporate balance sheets. This has filtered through to slightly higher consumer sentiment in February.
- Sentiment is also growing for upcoming leisure travel in 2024. The share of travelers reporting having travel plans within the next six months increased to 93% in January from 92% in December, according to Longwoods International’s monthly survey.
- Travel price inflation (TPI) fell slightly in January as a result of falling transportation prices. Sticky services inflation should see relief from decelerating wage growth. However, upside risks stem from rising healthcare costs, supply chain disruptions and slowing labor supply. Source: U.S. Travel Association and Tourism Economics
Member Price:
Non-Member Price: Become a member to access.
ADDITIONAL RESEARCH
Travel Price Index
Travel Forecast
Quarterly Consumer Insights
Additional monthly insights are available through the full U.S. Travel Monthly Data Report, exclusive to members. Please inquire with membership if you are interested in learning about becoming a member of U.S. Travel Association.
- Regional Support Office for Asia and the Pacific (RSOAP)
- Member States in Asia and the Pacific
- SUSTAINABLE TOURISM OBSERVATORIES (INSTO)

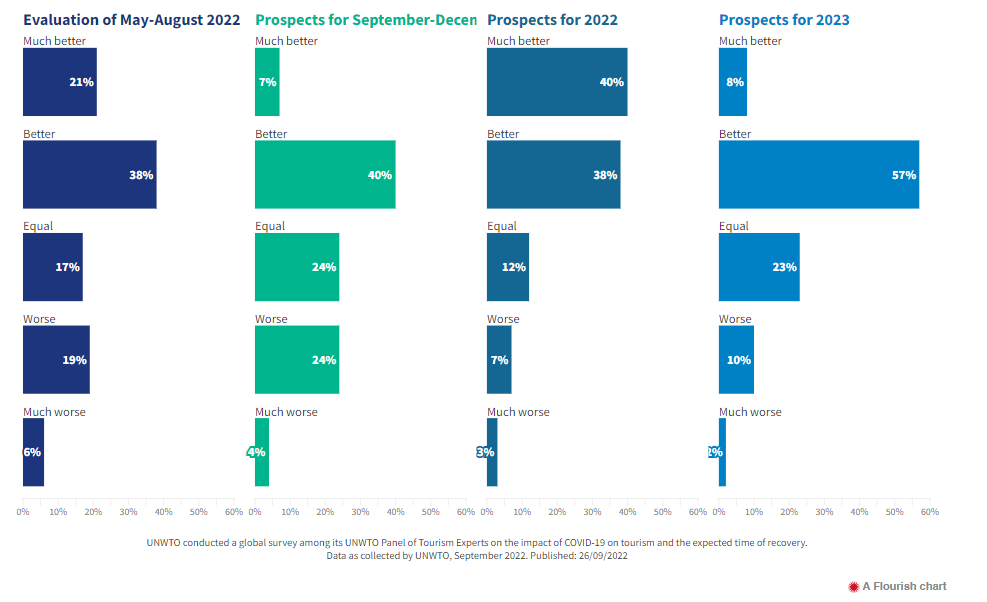
Below are excerpts from the September 2022 release of the UNWTO Tourism Barometer :
- The steady recovery reflects strong pent-up demand for international travel, especially in the months of June and July which are part of the Northern Hemisphere summer season. The easing or lifting of travel restrictions in an increasing number of countries also contributed to boost results.
- International tourist arrivals almost tripled (+172%) in January-July 2022 compared to the same period of 2021. Numbers climbed from -64% in January 2022 (versus 2019) to -28% in July, the strongest month since the start of the pandemic.
- Asia and the Pacific (+165%) saw arrivals more than double in the first seven months of 2022, though they remained 86% below 2019 levels.
- The ongoing recovery can also be seen in outbound tourism spending from major source markets. Expenditure from France was at -12% in January-July 2022 compared to 2019 while spending from Germany stood at -14%. International tourism spending remained at -10% in Belgium, -23% in Italy and -26% in the United States.
- The uncertain economic environment seems to have reversed prospects for a return to pre-pandemic levels in the near term. 61% of UNWTO Panel of Experts now see a potential return of international arrivals to 2019 levels in 2024 or later while those indicating a return to pre-pandemic levels in 2023 has diminished (27%) compared to the May survey (48%).
Know more about the global tourism sector performance from January to July 2022 by checking the UNWTO World Tourism Barometer Volume 20, Issue 5 .
LEAVE A REPLY Cancel reply
Save my name, email, and website in this browser for the next time I comment.
Regional Support Office in Asia and the Pacific (RSOAP)
Rsoap a to z.
- Sustainable Tourism Observatories(INSTO)
UNWTO A to Z
- About UNWTO
- Affiliate Members
- Member States
- Tourism in the 2030 Agenda
- World Tourism Day
- Technical Cooperation
- ASIA AND THE PACIFIC
- MIDDLE EAST
- RESOURCES/SERVICES
- Sustainable Development of Tourism
- Ethics, Culture and Social Responsibility
- Market Intelligence
- Tourism Data Dashboard
- Publications
- UNWTO Academy
Partners links

© UNWTO Regional Support Office for Asia and the Pacific (RSOAP)
Please sign in
You need to log in to use the bookmarking feature.
- Baker Library
- Special Collections
- Fast Answers
- All Services
- Plan Your Visit
- Working Knowledge
- Academic Programs
- Faculty & Research
- Harvard Business Review
- Initiatives
- Map / Directions
UNWTO Tourism Data Dashboard
This data dashboard from the United Nations World Tourism Organization (UNWTO) provides data on inbound and outbound tourism at the global, regional, and national levels; and tourism contribution to GDP, accommodation capacity and demand, and employment.
Citation Type
Meet the all-new tourism insights dashboard
The Tourism Insights Dashboard — all-new in 2024 — arms destination managers with two of the most important travel data sources: geolocation visitation data, and short-term rental data. Destinations can now effortlessly uncover high-value visitors, where they're traveling from, top-performing campaigns, and short-term rental intelligence — all in one place.
Trusted by over 500 of the worlds leading DMOs, CVBs, and tourism organizations

Trip Insights
Trip insights for traveler origin.
Where are my travelers visiting from?
Your new home base for tourism insights -- The AirDNA Trend Report is the world's most accurate, comprehensive resource for understanding everything about your short-term rental market.

How long are they staying for?
When are my visitors arriving?
Vacation Rental Intelligence
This is a question, find out where travelers are really staying.
See historical trends by individual zip code and neighborhood to determine where your non-hotel travelers are spending their time and money.
Unlock tax revenue insights
Uncover true economic impact..
Use the trend report to uncover exactly how much revenue vacation rentals are generating for government and local businesses.
Master your market’s seasonality
It’s time to rethink “peak season” .
Short-term rentals are redefining when we travel, and how long we stay for. Use the trend report to present new findings on shoulder seasons, long-term stays, and more.

Future Pacing Report
Future-looking insights, a new crystal ball for tourism.
The AirDNA Pacing Report tracks how the outlook for the current year is pacing compared to previous years. For example — see how many reservations are on the books for a future holiday weekend to see how you’re stacking up to last year.
Next-level benchmarking
Compare your destination to your neighbors.
Travel doesn’t happen in a vacuum. Use the Future Pacing report to benchmark your destination against neighboring cities to see if they’re seeing the same trends.
Outlook for all key indicators
Become the go-to source of authority.
Use the Pacing Report to inform members of your community on the latest trends in vacation rentals. Report the future outlook for active listings, demand, supply, nightly rates, revenue, and more.

Traveler Origin Data
Introducing traveler origin data, go beyond demographics with traveler origin data.
Gain insight into the states and cities your visitors are traveling from with Traveler Origin data.
Unlocked review data
Add color commentary to your analytics.
With access to the full reviews left on Airbnb, your destination will be able to know exactly what travelers are enjoying about their stays.
Measure marketing effectiveness
See real return on investment.
When your destination runs campaigns, you want to know if they were effective. Use Traveler Origin Data to report on spikes from specific cities, states, and countries.

Property Performance Data
Granular, property-level data, introducing property-level insights for your tourism org. .
Sometimes market data doesn’t cut it. That’s why we offer solutions that track the performance of individual short-term rentals. See how any given active listing performs in terms of occupancy, rates, length of stay, and more.
Custom analysis
Slice and dice property data as you wish.
Create unique comp sets to see how certain properties with certain criteria compare to others.

Global vacation rentals tracked
All-time airdna customers, accuracy on all estimates.
Tourism Data Dashboard Enabling the Sector's Growth
- 24 July 2023
SDG 08: Decent Work and Economic Growth , SDG 17: Partnerships for the Goals

Statistics and insights on global, regional, and national tourism indicators help policymakers and industry to monitor trends, make evidence-based decisions, and foster collaboration.
generated using Midjourney
Discover more, behavioural.

“Verified” – delivering science-based information in times of crises
A joint initiative of Purpose and the United Nations, Verified is a crisis communications model designed to adeptly respond to intersecting crises in an era of prolific mis- and disinformation. Heavily based on behavioral science insights, it cuts through the noise around global crises and deliver critical fact-based advice and information.

Using behavioural insights to formalize domestic work in Argentina
In 2017, the government of Argentina set as a priority the formalization of domestic work through registration to social security – a human right and a key means of accessing decent work. The ILO worked with the Ministry of Labour to design and implement a behavioural intervention. The project started with a diagnosis of the behavioural drivers of non-registration, based on which we drafted a letter to employers asking them to comply with their legal obligation to register the worker. In a randomized field experiment, the Ministry of Labour sent the letters to around 100,000 households, and this was compared to a control group of 80,000 households that received no letter. The letter led to an increase of 8.9% in the rate of registration. The experience showed the potential of behavioural science as a tool to accelerate progress to SDG 8.8, and changed the lives of domestic workers.

ICAO Innovation Fair – Digital Aviation: the Future is Now
The ICAO Innovation Fair will allow representatives of States, international organizations, industry, private sector, academia, aviation research, United Nations and non-governmental organizations (NGOs) to have substantive conversations on innovation in aviation. This edition will focus on how the experimentation and development of innovative digital technologies or services for aviation bring value to the sector and contribute to States achievement of the United Nations Sustainable Development Goals.

Primero – Protecting Vulnerable Children from Violence
Primero is an open-source platform used by social workers, child protection and gender-based violence professionals to manage case and incident data. It is a certified digital public good in use in more than 50 countries and helps improve service delivery and referrals while ensuring that sensitive data is protected. This article focuses on the East Asia Pacific region, where Primero is being used by frontline workers at scale to connect children with vital services.

PortWatch: monitor & simulate maritime trade flows
PortWatch (https://portwatch.imf.org/) is an open platform designed to monitor and simulate disruptions to maritime trade flows. The platform helps policymakers and the public assess the impact of realized and future trade shocks, such as natural disasters, based on real-time data sourced from the UN Global Platform (UNGP).
More recently, PortWatch provided alaysis on trade disruptions in the Red Sea, which has been featured in the media such as Financial Times.
The platform allows users to explore how global supply chains are exposed to present and future disruptions to port activity. Users can simulate the indirect spillover effects of port disruptions to other countries in the maritime trade network. Spillover analysis reveals which countries and sectors are at risk of experiencing trade disruptions, which can help inform timely responses to shocks.
PortWatch is a collaborative project between the IMF and the Environmental Change Institute at the University of Oxford, in cooperation with ESRI, the UNGP, the World Bank, and the World Trade Organization.

What’s In The Box? A Novel Solution For Emergency Connectivity
The humanitarian crisis in Nigeria continues to be one of the most severe and complex globally. The CrisisNet kit offers a world of communication to humanitarians to power their response — all in just one box.

Gender Data Lab for Increased Gender Data Availability
The Gender Data Lab (GDL) initiative aims to establish a dedicated team within existing government structures, such as National Statistical Offices, to accelerate gender data availability and promote evidence-based policymaking.

EMPACT digital livelihoods programme
WFP’s EMPACT (EMPowerment in ACTion) programme is a digital livelihoods programme delivering a blended curriculum that combines technical and soft skills training curriculum through a learn-and-earn model that also connects trainees to digital work opportunities. EMPACT was launched at the Kibera Town Center in 2021 following the socio-economic impacts caused by the COVID-19 pandemic. To date, more than 1,000 youth have been trained under the programme with 41 percent earning money from online work.

MEZA: AI-based App for remote health centers
WFP has invested in MEZA – which translates to ‘table’ in Swahili – an artificial intelligence (AI) solution that uses Optical Character Recognition (OCR) technology to decode handwritten medical data into machine-readable information. The solution also assists in consolidating this data into the national government’s health database to support accurate and timely reporting on health treatment for effective management of acute malnutrition. MEZA is designed to specifically support remote health centres that have limited access to electricity and internet, preventing them from using the Electronic Medical Records (EMR) system currently being deployed in the country.

H2Grow: Hydroponics for vulnerable communities
H2Grow is WFP’s hydroponics initiative that brings locally adapted and affordable hydroponic solutions to vulnerable communities. WFP is leveraging on learnings to provide technical support to local farmers implementing hydroponics. The Innovation Unit is exploring blended finance models that will contribute to reducing the cost of hydroponics to facilitate scale and broad adoption of the solution. The Unit is also supporting a global Community of Practice around hydroponics through the H2Grow Platform, and the roll-out of hydroponics training for farmers through the Hydro App.
- Privacy Notice
- Cookies Policy
Statistics and reports
The European Commission supports policymakers and stakeholders in developing better strategies for a more resilient European tourism ecosystem by gathering information and analysis on performance and trends in the sector.
EU tourism dashboard
The EU tourism dashboard is an online knowledge tool aimed at monitoring the green and digital transitions of the tourism ecosystem to make tourism more resilient and sustainable.
The dashboard visualises tourism-relevant data and indicators collected from available, trusted sources covering the tourism ecosystem. It offers snapshot views of key tourism indicators for the European Union and each member country.
Eurobarometer surveys
Flash Eurobarometer surveys reveal the preferences and attitudes of Europeans towards tourism. The Eurobarometer surveys offer a portrait of the current situation and an outlook for the upcoming seasons.
Studies and reports
An online repository is available for reports, studies and papers relevant to tourism policymakers and stakeholders. A user-friendly tool allows the library to be searched by country, theme or year of publication. This section offers access to relevant publications of the Directorate-General for the Internal Market, Industry, Entrepreneurship and SMEs, and the Commission, as well as to a wide range of works published by other institutions, international organisations, EU countries and academia.
A tourism dashboard for greener, digitally savvy and resilient EU destinations
A new tool to improve access to statistics and policy-relevant indicators for tourism, and support destinations and public authorities in tracking their progress in the green and digital transition

The Commission launches today the EU Tourism Dashboard , a new tool to help policy makers at country and regional level to steer policies and strategies in the tourism ecosystem. The aim of this tool is to improve access to statistics and policy-relevant indicators for tourism, supporting destinations and public authorities in tracking their progress in the green and digital transition.
The tourism ecosystem was one of the most heavily affected by the measures put in place to curtail the COVID-19 pandemic. Making it more resilient through the twin transition became a strong policy priority. The dashboard will support both competent authorities and businesses to identify vulnerabilities and define strategies for improvement.
The dashboard will allow tourism decision makers - be it countries or regions - to identify socio-economic vulnerabilities, thus supporting the development of effective strategies for tourism. Using a range of consistent and evidence-based indicators at national and regional level, tourism decision makers and managers will be able to recognise vulnerabilities such as high seasonality or high dependence on visitors from few origins as well as identify key marketing advantages such as excellent bathing waters or diversity of tourism offers.
The dashboard is an interactive web platform, visualising statistical data and newly developed tourism indicators, organised under four areas: environmental impacts, digitalisation, socio-economic vulnerability, and basic tourism descriptors. The data and indicators can be consulted in two ways: through destination, where information is available for one single tourist destination (country or region), and through an indicator map view, where the user can see how a specific indicator varies across tourist destinations.
The Dashboard is made available at its launch in all official EU languages through machine translation.
The EU Tourism Dashboard has been developed by the JRC and the Commission’s Directorate-General for Internal Market, Industry, Entrepreneurship and SMEs , following a request by EU countries in 2021 to design a tool for the tourism ecosystem. The initiative contributes to the Transition Pathway for Tourism published in February 2022, which was created in collaboration with public and private EU tourism stakeholders to identify 27 areas of actions for the green and digital transition and for improving the resilience of EU tourism.
- Green transition
- Territorial intelligence
- Zero pollution
Related links
More news on a similar topic.

- News announcement
- 11 April 2024

- General publications
- 13 March 2024

- 12 March 2024

- 14 February 2024
Share this page
Study with us
- How to Apply
- Scholarships
- Student Stories
- Accommodation
- Courses and Units
- Undergraduate A-Z
- Postgraduate A-Z
- Spring and Summer School
- Winter School
- Download Course Guides
- Study online
- Pathways Programs
Domestic Students
- Course Costs
- Application Dates
- Undergraduate Application Information
- Aboriginal and Torres Strait Islander Students
International Students
- Courses by Type & Fees
- Entry Requirements
- The Explorer Blog
- UTAS Authorised Agents
- Events in your country
Popular Links
Enrolment & fees.
- Course & Unit Handbook
- Manage your Enrolment
- Student Services & Amenities Fees (SSAF)
- Australian Government Assistance
Exams & Results
- Examinations
- About Results
- Access your Results
- Academic Transcripts
- About Our Research
- Research Performance
- Institutes, Centres and Groups
- Partnering with Industry
- Office of Research Services
Research Degrees
- Find a Supervisor
- What is a Research Degree
Research Themes
- Environment, Resources and Sustainability
- Creativity, Culture and Society
- Better Health
- Marine, Antarctic and Maritime
- Data, Knowledge and Decisions
- Stay Connected
- Get involved
- Services and Benefits
- News and Publications
- Support Scholarships
- Support Research
- Bequest Planning
- Your Gift Changes Lives
- Public Events
- Vice-Chancellor's Awards
- Our Rankings
- University Council
- Vice-Chancellor
- Aboriginal Business
- Jobs and Careers
- Campus Maps
- Campus Information
- Security and Access
- Northern Transformation
News, Events & Publications
- Our Stories
- Breaking News
- Research to Reality
- Media Releases
- Alumni News
- Future Students
- Current Students
- Our University
You currently have no saved courses.
Tourism Tracer
Data dashboards.
The Tourism Tracer team uses cutting edge GPS technology and world leading computer programming to understand the travel behaviour of tourists. We are committed to high impact, user friendly access to academic research via our data dashboards. This technology is being utilised by numerous tourist destinations worldwide, and allows the tourism industry to access information on tourist behaviour in unprecedented detail.
Tourism Skåne Project Sweden
This this ground breaking research project will assess the travel behaviours of cyclists using the 274 km long Sydostleden (Southeastern) Trail in Southern Sweden. A closed source library containing the Tourism Tracer © app technology has been synced to the back end of an existing Sydostleden Trail app. This will allow tourists' location and survey data -designed by the Tourism Tracer team- to be sent through to the Tourism Tracer© database and visualizations to be made via the Tourism Tracer dashboard.
Tourist Tracking Project Tasmania
Since early 2016 the Tourism Tracer team has been tracking a randomised representative sample of approximately tourists and collecting information from them while they travel around Tasmania. The collected data supports industry and government infrastructure and investment decision-making.
Tourist Tracking Project Japan
During January 2018, Tourism Tracer ran a successful pilot around Hokkaido, Japan's northern island. Tourist were tracked in real-time throughout their journey using the Tourism Tracer Research App. Results of the pilot are now being presented to the local tourism industry.
* Funding for this project has been provided by Tourism Skåne and Tillväxtverket, the Swedish Agency for Economical and Regional Growth.
+ Funding and support has been provided by the University of Tasmania, the Tasmanian government (Department of State Growth), the Federal Group, the Tourism Industry Council of Tasmania and its four regional tourism authorities, plus the Spirit of Tasmania, the Launceston Airport and the Hobart Airport.

- Ask a Librarian
Hospitality & Tourism Management
- Introduction
- Article Databases
- Markets & Industries
- Historical Document Collections
- Course Guides
Subject Guide

HTM Data Sources
- US Tourism Data Sources
- International Tourism & Travel Data
- Statistical Databases
- Wine Statistics
- Beer Statistics
- Bureau of Economic Analysis -Travel and Tourism Data
- The United States National Tourism Office Travel and Tourism Indicators
- National Household Travel Survey (US)
- Office of Travel & Tourism Industries
- Inbound Travel to the US
- Outbound Travel From the US
- National Travel & Tourism Office
- National Health and Nutrition Examination Survey
- UNWTO Tourism Dashboard The UNWTO Tourism Data Dashboard – provides statistics and insights on key indicators for inbound and outbound tourism at the global, regional and national levels. Data covers tourist arrivals, tourism share of exports and contribution to GDP, source markets, seasonality and accommodation (data on number of rooms, guest and nights) Two special modules present data on the impact of COVID 19 on tourism as well as a Policy Tracker on Measures to Support Tourism
- World Economic Forum Travel & Tourism Development Index 2021: Rebuilding for a Sustainable and Resilient Future A direct evolution of the Travel & Tourism Competitiveness Index, the new Travel & Tourism Development Index benchmarks and measures “the set of factors and policies that enable the sustainable and resilient development of the Travel and Tourism (T&T) sector, which in turn contributes to the development of a country”. The 2021 edition of the index highlights the vital need to invest in T&T, the impact of COVID-19 and how sector stakeholders can draw on T&T development strategies to build back better. In particular, amid the current challenges, shifting demand dynamics and future opportunities and risks, a more inclusive, sustainable and resilient sector must be created.
- World Travel & Tourism Council (WTTC) Economic Impact Reports WTTC produces reports on the economic and employment impact of Travel & Tourism for 185 countries and 25 geographic or economic regions in the world.
- World Development Indicators An analysis and visualization tool that contains collections of time series data on a variety of topics. Create queries, generate tables, charts, and maps; and easily save, embed, and share them.
- OECD Tourism Statistics This database contains data on tourism indicators related to domestic travel, international travel, employment and economic data. Tourism can be regarded as a social, cultural and economic phenomenon related to the movement of people outside their usual place of residence.
- World Trade Organization - Statistics
- US Department of State - Travel
- World Tourism Organization - Statistics
- HVS Hotel Management Contract Survey - 2017 The HVS Guide to Hotel Management Contracts presents the results of an extensive review of hotel management agreements conducted across the Americas(USA, Canada and South America), Europe, the Middle East, Africa(EMEA),and the Asia Pacific(APAC) regions, in addition to offering an in-depth understanding of the key terms and clauses of such agreements.
The HVS Hotel Brokers Survey is published twice annually and provides an important look at cap rate trends, multipliers, and other key investment metrics for the US and Canadian hotel industry. HVS reaches out to over 80 active hotel brokers in the US and Canada to participate in the survey, and their insights provide you with the pulse of the market as it relates to these key topics:
Going-in Cap Rates by Hotel Product Type Exit Cap Rates by Hotel Product Type Current Rooms Revenue Multipliers Hotel Marketing Times by Hotel Product Type Selling Expenses by Hotel Product Type Effects of Liquidation Insights into Specific Markets, As Provided
- HVS Broker Survey - Spring 2023
- HVS Broker Survey - Fall 2018
- HVS Broker Survey - Fall 2017
- HVS Broker Survey - Spring 2017
- HVS Broker Survey - Fall 2016
The HVS U.S. Hotel Franchise Fee Guide provides a comparative review of various hotel franchises based on their applicable franchise fees.
- Hotel Franchise Fee Guide - 2020
- Hotel Franchise Fee Guide - 2018
- Hotel Franchise Fee Guide - 2015/16
- Hotel Franchise Fee Guide - 2014
Trends® in the Hotel Industry is an annual compilation of unit-level hotel financial statements. Since 1936, PKF has collected year-end operating statements from thousands of hotels across the nation. From these statements, our Firm extracts 200 specific revenue and expense items and then puts the data into a uniform format to ensure equitable benchmarking.
- Trends in the Hotel Industry - 2018
- Trends in the Hotel Industry - 2002 to 2012
- Proquest Statistical Insight Provides access to statistical information produced by U.S. Federal agencies, state governments, private organizations, and major international governmental organizations. Search between approximately 200,000 to 500,000 tables with advanced Search Tables functionality. Coverage includes over 50 years.
- Wine Institute: Statistics
- TTB - Wine Industry Statistics
- TTB Beer Statistics
- Brewers Association Insights & Analysis
- << Previous: Markets & Industries
- Next: Historical Document Collections >>
- Last Updated: Apr 12, 2024 2:09 PM
- URL: https://guides.lib.purdue.edu/htm
Qatar is welcoming 102 countries visa-free, check your visa status here .
Select your language

Sector Statistics
Tourism Dashboards
Qatar Tourism Intelligence dashboards provide dynamic monthly updates on key indicators for inbound tourists. Insights cover tourist arrivals by source markets and port of entry, and hospitality highlights.

Quick access
Attractions, itineraries.
- Media & Press
- Tour operator
- About Qatar Tourism
- Visitqatar.com
- Amiri Diwan
- Privacy & security policy
- Cookie policy
- Terms and conditions
- Qatar Tourism brand logos
- Cookie settings
© 2024 Qatar Tourism | All rights reserved

UN Tourism | Bringing the world closer
Share this content.
- Share this article on facebook
- Share this article on twitter
- Share this article on linkedin
International Tourism and Covid-19
A compilation of data on country, regional and global level on the impact of COVID-19 on tourism, alongside an impact assessment on the economic impact of COVID-19 crisis on tourism.
UNWTO and COVID-19
As the world is facing an unprecedented global health, social and economic emergency with the COVID-19 pandemic, travel and tourism is among the most affected sectors with airplanes on the ground, hotels closed and travel restrictions put in place in virtually all countries around the world.
Therefore, the World Tourism Organization (UNWTO) has launched a new dashboard on COVID-19 and tourism which shows data on the impact of COVID-19 on the tourism sector across the world, by regions and by destinations.
The dashboard includes data on:
- International tourist arrivals
- International tourism receipts
- Tourism as share of GDP
- Tourism as share in total exports
- International tourism as share of total tourism (including domestic)
- Impact assessment of COVID-crisis on tourism
- Impact assessment of previous crises on tourism
The UNWTO COVID-19 and Tourism dashboard is available for free and is updated monthly.
Surge in Adventure Tourism: Four Big Trends in 2024
Jesse Chase-Lubitz , Skift
April 17th, 2024 at 12:00 PM EDT
New data shows that experiences are the leading factor when choosing a destination.
Jesse Chase-Lubitz
The latest consumer spending data from GetYourGuide reveals a surge in demand for unique travel experiences and activities that align with personal passions.
The report analyzes booking data from millions of travelers and highlights a significant shift in travel priorities. Here are the key takeaways:
Experiences Rule
Travelers are prioritizing experiences over traditional sightseeing. Nearly all travelers (90%) plan to spend the same or more on activities in 2024, and experiences are now the leading factor when choosing a destination (reported by 98% of travelers).
Passion Drives Destinations
The hottest travel destinations are no longer just about iconic landmarks. Cities like Fajardo, Puerto Rico (up 419% in bookings by American travelers) and Hoi An, Vietnam (up 284% globally) are experiencing a boom, likely due to their unique cultural offerings and adventure opportunities.
Globally Inspired
Travelers are venturing beyond the usual suspects. This year’s top trending tours include the Sagrada Familia in Barcelona, kayaking through El Yunque Rainforest in Puerto Rico, and even a hot air balloon ride over Interlaken, Switzerland.
The Rise of the Explorer
GetYourGuide identifies a new breed of traveler – the “Explorer” – who spends more on experiences, takes longer trips, and travels more frequently. These high-value vacationers are fueling the experience economy.
Get Skift Research
Skift Research products provide deep analysis, data, and expert research on the companies and trends that are shaping the future of travel.
Have a confidential tip for Skift? Get in touch
Tags: getyourguide , tourism , Travel Experiences , Travel Trends
Photo credit: GetYourGuide Walking Tour in London. Source: GetYourGuide
COMMENTS
The UN Tourism Data Dashboard - provides statistics and insights on key indicators for inbound and outbound tourism at the global, regional and national levels. Data covers tourist arrivals, tourism share of exports and contribution to GDP, source markets, seasonality and accommodation (data on number of rooms, guest and nights) ...
UN Tourism systematically collects tourism statistics from countries and territories around the world in an extensive database that provides the most comprehensive repository of statistical information available on the tourism sector. This database consists mainly of more than 145 tourism indicators that are updated regularly. You can explore the data available through the UNWTO database below:
Tourism Statistics. Get the latest and most up-to-date tourism statistics for all the countries and regions around the world. Data on inbound, domestic and outbound tourism is available, as well as on tourism industries, employment and complementary indicators. All statistical tables available are displayed and can be accessed individually ...
Grow with Google. Explore free training, tools and resources to grow your skills. *All data is indexed. This tool uses search volume as a proxy for travel demand. Monitor travel trends. See the latest data and insights around destinations that travellers are searching out - and get tools, advice and tips for making your business stand out online.
The U.S. Travel Insights Dashboard, developed in collaboration with Tourism Economics, is supported by more than 20 data sources. The dashboard is the most comprehensive and centralized source for high-frequency intelligence on the U.S. travel industry, tracking industry performance, travel volumes and predictive indicators of recovery ...
2022-10-28. Below are excerpts from the September 2022 release of the UNWTO Tourism Barometer: The steady recovery reflects strong pent-up demand for international travel, especially in the months of June and July which are part of the Northern Hemisphere summer season. The easing or lifting of travel restrictions in an increasing number of ...
This data dashboard from the United Nations World Tourism Organization (UNWTO) provides data on inbound and outbound tourism at the global, regional, and national levels; and tourism contribution to GDP, accommodation capacity and demand, and employment.
The UNWTO Elibrary is an online service from the World Tourism Organization (UNWTO) with a broad coverage of tourism and related subject areas. The UNWTO Elibrary is an information source offering an unparalleled coverage of research and information in the area of tourism and available to our Member States, Affiliate Members, subscribers and general public.
The Tourism Insights Dashboard — all-new in 2024 — arms destination managers with two of the most important travel data sources: geolocation visitation data, and short-term rental data. Destinations can now effortlessly uncover high-value visitors, where they're traveling from, top-performing campaigns, and short-term rental intelligence ...
The UNWTO Tourism Data Dashboard - provides statistics and insights on key indicators for inbound and outbound tourism at the global, regional and national levels. Data covers tourist arrivals, tourism receipts, tourism share of exports and contribution to GDP, source markets, seasonality, domestic tourism and data on accommodation and employment.
Tourism Data Dashboard Enabling the Sector's Growth. Statistics and insights on global, regional, and national tourism indicators help policymakers and industry to monitor trends, make evidence-based decisions, and foster collaboration. ... child protection and gender-based violence professionals to manage case and incident data. It is a ...
The EU tourism dashboard is an online knowledge tool aimed at monitoring the green and digital transitions of the tourism ecosystem to make tourism more resilient and sustainable. The dashboard visualises tourism-relevant data and indicators collected from available, trusted sources covering the tourism ecosystem. It offers snapshot views of ...
The dashboard is an interactive web platform, visualising statistical data and newly developed tourism indicators, organised under four areas: environmental impacts, digitalisation, socio-economic vulnerability, and basic tourism descriptors. The data and indicators can be consulted in two ways: through destination, where information is ...
The Tourism Tracer team uses cutting edge GPS technology and world leading computer programming to understand the travel behaviour of tourists. We are committed to high impact, user friendly access to academic research via our data dashboards. This technology is being utilised by numerous tourist destinations worldwide, and allows the tourism industry to access information…
The Tourism Data Explorer is a compilation of interactive dashboards that provide users with access to a range of tourism data including International Visitor Survey (IVS), National Visitor Survey (NVS) time series data for visitation and expenditure within Australia, regional mobility data and international arrivals by visa type. Select a tile ...
The UN Tourism Data Dashboard - provides statistics and insights on key indicators for inbound and outbound tourism at the global, regional and national levels. Data covers tourist arrivals, tourism share of exports and contribution to GDP, source markets, seasonality, and accommodation (data on number of rooms, guest, and nights). ...
The UNWTO Tourism Data Dashboard - provides statistics and insights on key indicators for inbound and outbound tourism at the global, regional and national levels. Data covers tourist arrivals, tourism share of exports and contribution to GDP, source markets, seasonality and accommodation (data on number of rooms, guest and nights) ...
The most comprehensive tourism dashboard to date, the Tracker is the result of a partnership between international organizations and the private sector. Available for free, it covers key tourism performance indicators by month, regions and subregions allowing for a real time comparison of the sector recovery across the world and industries.
Unlock the pulse of Qatar's tourism landscape with us. Dive into data-driven insights, trends and analysis shaping the industry's future. ... Tourism Dashboards Qatar Tourism Intelligence dashboards provide dynamic monthly updates on key indicators for inbound tourists. Insights cover tourist arrivals by source markets and port of entry, and ...
The Queensland Visitation Tourism Data Explorer V2.5 is an interactive dashboard that provides users with access to International Visitor Survey (IVS) and National Visitor Survey (NVS) time series data for visitation and expenditure within Australia.
The UNWTO Statistics Department is committed to developing tourism measurement for furthering knowledge of the sector, monitoring progress, evaluating impact, promoting results-focused management, and highlighting strategic issues for policy objectives.. The department works towards advancing the methodological frameworks for measuring tourism and expanding its analytical potential, designs ...
The Regional Overnight Mobility Dashboard is an interactive dashboard that provides users with a regional overview of the profile of domestic overnight visitors by month. It shows where visitors to the selected Tourism Region came from, highlighting the size of the interstate vs. intrastate markets. It then breaks down visitation to regions ...
Therefore, the World Tourism Organization (UNWTO) has launched a new dashboard on COVID-19 and tourism which shows data on the impact of COVID-19 on the tourism sector across the world, by regions and by destinations. The dashboard includes data on: The UNWTO COVID-19 and Tourism dashboard is available for free and is updated monthly. A ...
New data shows that experiences are the leading factor when choosing a destination. The latest consumer spending data from GetYourGuide reveals a surge in demand for unique travel experiences and ...