View in English

Web development tools
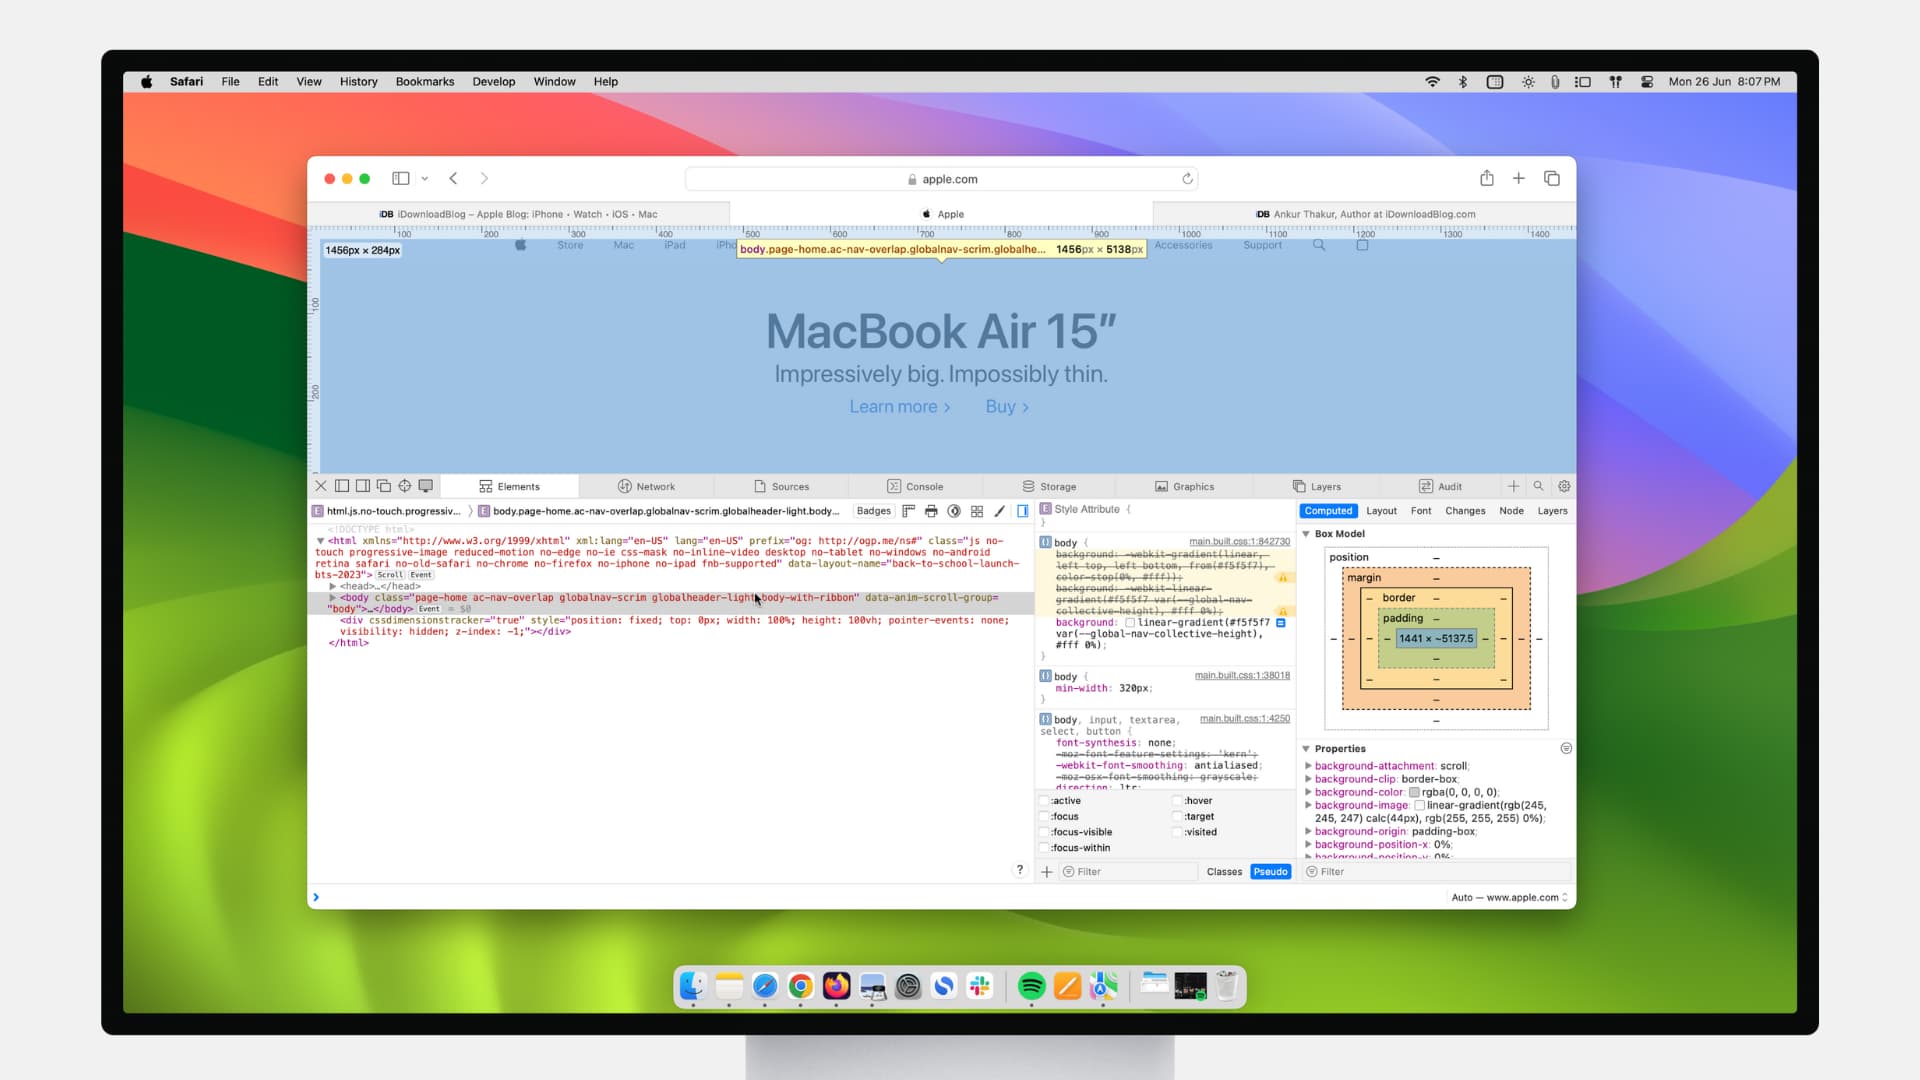
Apple has brought its expertise in development tools to the web. Safari includes Web Inspector, a powerful tool that makes it easy to modify, debug, and optimize websites for peak performance and compatibility on both platforms. And with Responsive Design Mode, you can preview your web pages in various screen sizes, orientations, and resolutions. Access these tools by enabling the Develop menu in Safari’s Advanced preferences.
Web Inspector
Web Inspector is your command center, giving you quick and easy access to the richest set of development tools ever included in a web browser. It helps you inspect all of the resources and activity on a web page, making development more efficient across Apple platforms. The clean, unified design puts each core function in a separate tab, which you can rearrange to fit your workflow. You can even debug memory using Timelines and tweak styles using widgets for over 150 of the most common CSS properties.

Elements. View and inspect the elements that make up the DOM of a web page. Clicking elements from the fully editable markup tree on the left reveals the node’s styles in the middle sidebar, with more details in the right sidebar.

Console. Type JavaScript commands in the console to interactively debug, modify, and get information about your webpage. View logs, errors, and warnings emitted from a webpage, so you can identify issues fast and resolve them right away.

Sources. Find every resource of a webpage, including documents, images, scripts, stylesheets, and more. Use the built-in debugger with data type and code highlights to troubleshoot and understand the script execution flow.

Network. See a detailed list of all network requests made to load every web page resource, so you can quickly evaluate the response, status, timing, and more.

Timelines. Understand all the activity that occurs on an open web page, such as network requests, layout and rendering, JavaScript events, memory, and CPU impact. Everything is neatly plotted on a timeline or recored by frame, helping you discover ways to optimize your site.

Storage. Find details about the data stored by a web page, such as application cache, cookies, databases, indexed databases, local storage, and session storage.

Graphics. Preview animation keyframes and their classes from HTML5 canvas, JavaScript animations, CSS animations, and CSS transitions. Dial in the motion and the visual design of web pages.

Layers. Visualize compositing layers in 3D to understand where layers are generated and in what order they'll render. Use layers to help find unexpected memory consumption or excessive repaints on a web page.

Audit. Preform audits against a web page to certify that common code and accessibility errors are addressed. Confirm that a web page follows design guidelines and specifications of modern web pages.
Responsive Design Mode
Safari has a powerful new interface for designing responsive web experiences. Responsive Design Mode provides a simple interface for quickly previewing your web page across various screen sizes, orientations, and resolutions, as well as custom viewports and user agents. You can drag the edges of any window to resize it. And you can click on a device to toggle its orientation, taking it from portrait to landscape — and even into Split View on iPad.
How-To Geek
How to turn on the develop menu in safari on mac.
The Develop menu lets you view page source in Safari on Mac.
Quick Links
How to enable the develop menu in safari on mac, how to view page source in safari on mac.
When you right-click on any web page in Safari on Mac, it doesn't reveal the Show Page Source and Inspect Element buttons. To see these, you need to enable the Develop menu---we'll show you how to do that.
Once you've enabled the Develop menu, right-clicking a blank space on any website will reveal the Inspect Element and Show Page Source buttons. These allow you to take a look at the source code of any website, which is useful for things like downloading images from websites and debugging code or finding out what it looks like behind any site (for website designers).
You can easily turn on the Develop menu in Safari by following a couple of steps. Open Safari on your Mac and click the "Safari" button in the menu bar.
Next, select "Preferences." Alternatively, you can use the keyboard shortcut Command+, (comma). This will also open up Safari preferences.
Go to the "Advanced" tab.
Check the box for "Show Develop Menu in Menu Bar."
Now the Develop menu will appear between Bookmarks and Window at the top.
Apart from being able to view the page source, this will allow you to access developer-focused features, such as disabling JavaScript on any website.
Once you've enabled the Develop menu, there are a couple of ways to view the page source in Safari.
Open any website in Safari and right-click the blank space on the page. Now, select "Show Page Source." You can also get to this menu by using the keyboard shortcut Option+Command+u.
If you're looking for images or other media elements from any web page, Safari makes it easy to find these. In the left-hand pane, you will see various folders such as Images, Fonts, etc. Click the "Images" folder to quickly find the photos that you need.
After selecting an image, you can view its details easily by opening up the details sidebar. The button to open this is located at the top-right of the console, just below the gear icon. You can also open this with the shortcut Option+Command+0.
Click "Resource" at the top of the details sidebar to view details, such as the size of the image and its full URL.
You can change the position of the page source console easily, too. There are two buttons at the top-left of this console, right next to the X button. Click the rectangle icon to move the console to a different side within the browser window.
If you'd like to open the page source console in a separate window, you can click the two-rectangles icon. This will detach the console and open it in a separate window.
To check out the code for any specific element on the page, you can right-click that element and select "Inspect Element." This will take you directly to the code for the element that you selected.
Whenever you're done looking at the code, click the X button to close the page source console and return to browsing on Safari. You can also check out how to view a website's page source in Google Chrome here.
Related: How to View the HTML Source in Google Chrome
How to use Safari Web Inspector on Mac, iPad, and iPhone
If you’re a web developer, then you likely already know about Safari’s Web Inspector. But if you’re just starting to use Safari for development or have just begun your Web Development career, this guide will show you the basics for getting started with the Safari Web Inspector on iOS and Mac.
What is the Safari Web Inspector?
For those not yet familiar with the tool, you can use the Safari Web Inspector for help with your web development. It allows you to review page elements, make changes, troubleshoot problems, and review page performance. Apple sums it up with:
Web Inspector is the primary web development tool in Safari. Web Inspector allows you to inspect, tweak, debug, and analyze the performance of your web content in a Safari tab.
Enable and open Safari Web Inspector
You can use the Safari Web Inspector for development on your iPhone, iPad, or Mac. Here’s how to enable and open it on iOS and macOS so you’re ready to use it when you need it.
If you’re going to use the Web Inspector frequently, whether for iOS or Mac, you might as well add the Develop tab to your menu bar so you can access it easily.
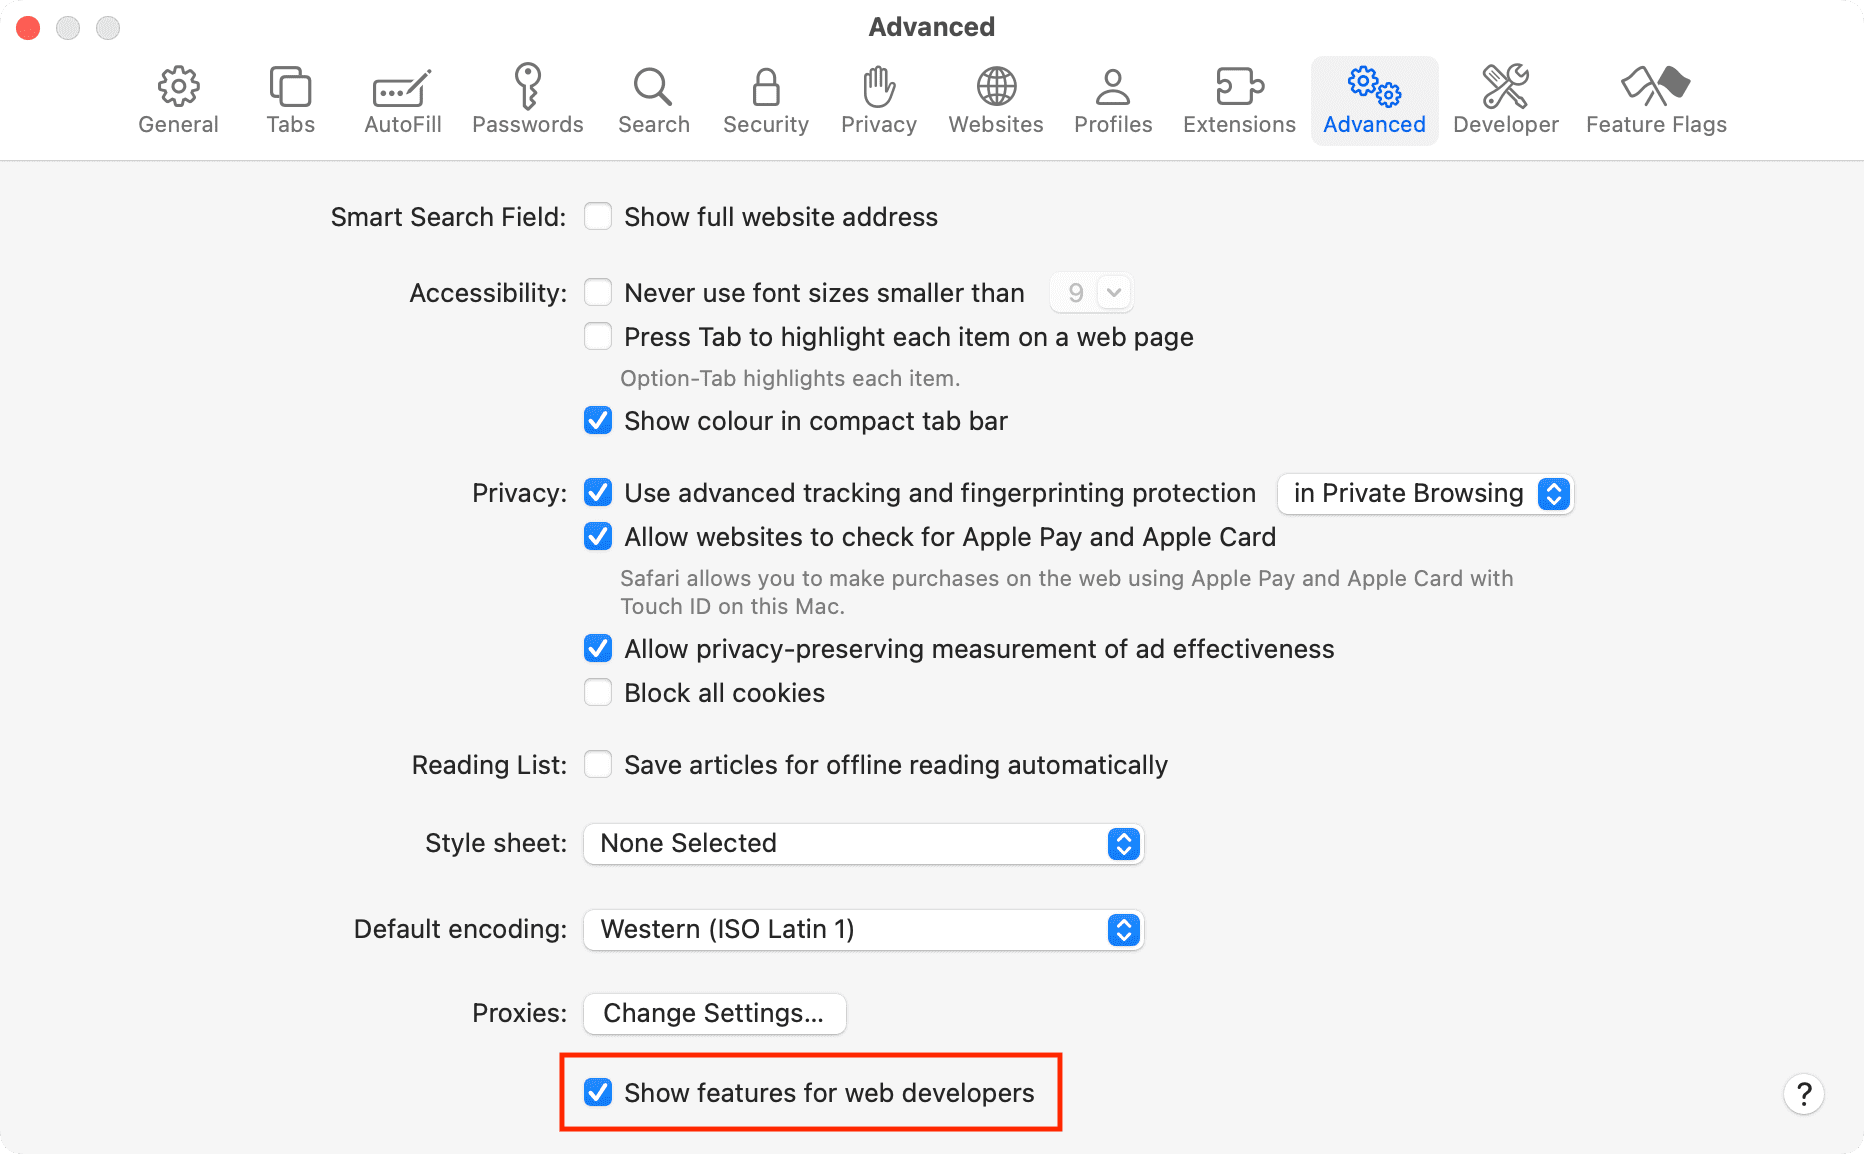
- Open Safari on your computer and click Safari > Settings or Preferences from the menu bar.
- Choose the Advanced tab.
- Check the box at the bottom for “ Show features for web developers ” or Show Develop menu in menu bar .
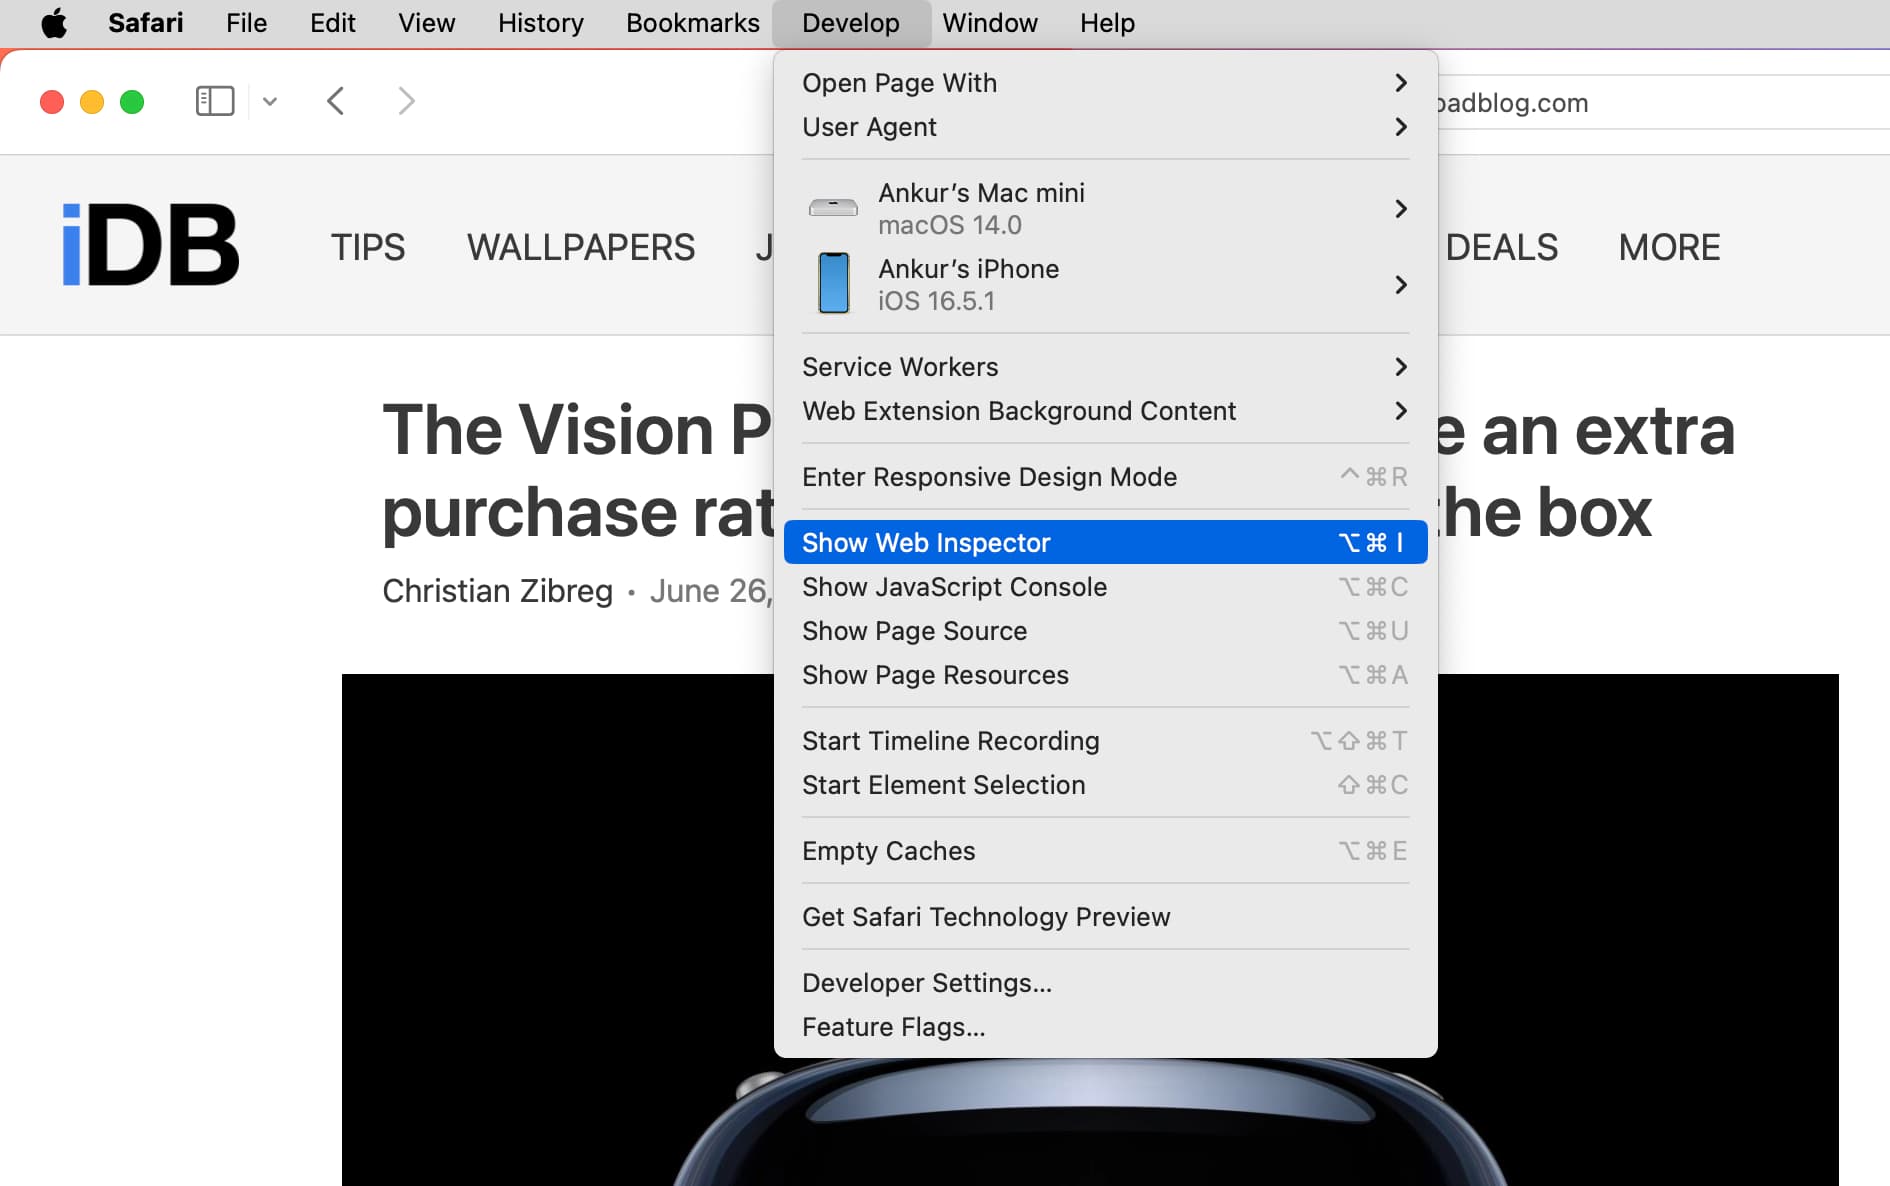
Now when you want to enable the Web Inspector, click Develop > Show Web Inspector from your menu bar.
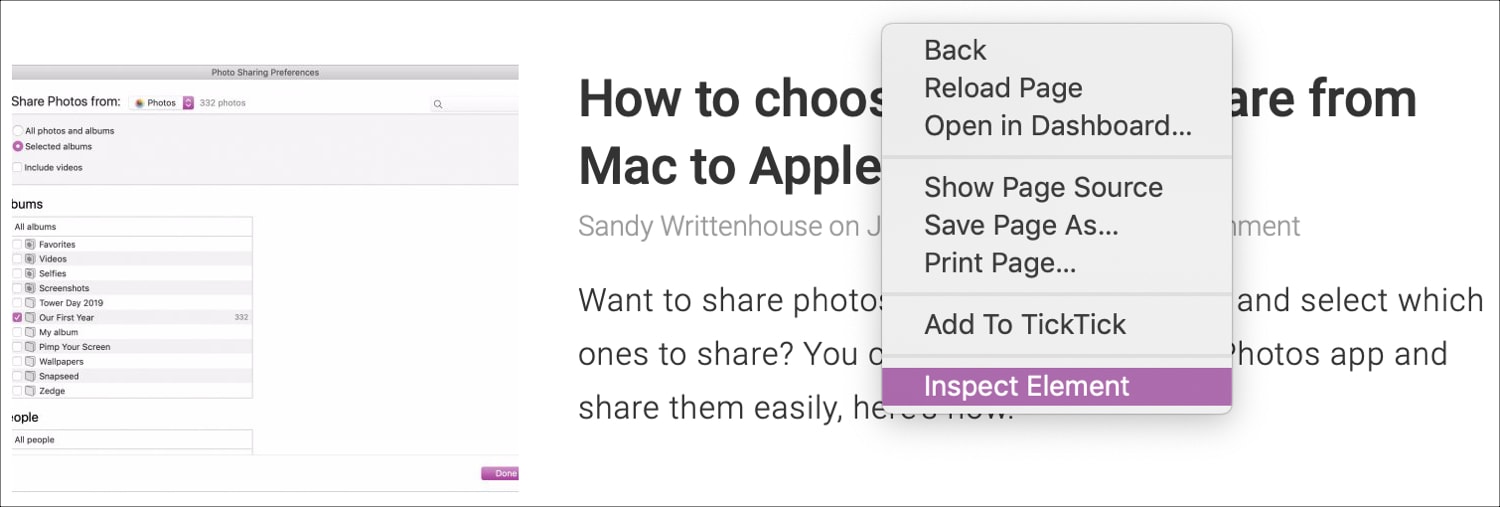
If you prefer to forgo adding the Develop button to your menu bar, you can access the Web Inspector on Mac with a shortcut. Navigate to the page you want to inspect, right-click on it, and pick Inspect Element from the context menu.
Just keep in mind that if you plan to use Web Inspector for Safari on your iOS device, you’ll need the Develop button in the menu bar on your Mac.
For iPhone and iPad
To use the Web Inspector for iOS on your Mac, grab your USB cable and connect your iPhone or iPad to your computer. Then, follow these steps to enable the tool:
- Open the Settings app on your iPhone or iPad and tap Safari .
- Scroll to the bottom and tap Advanced .
- Enable the toggle for Web Inspector .
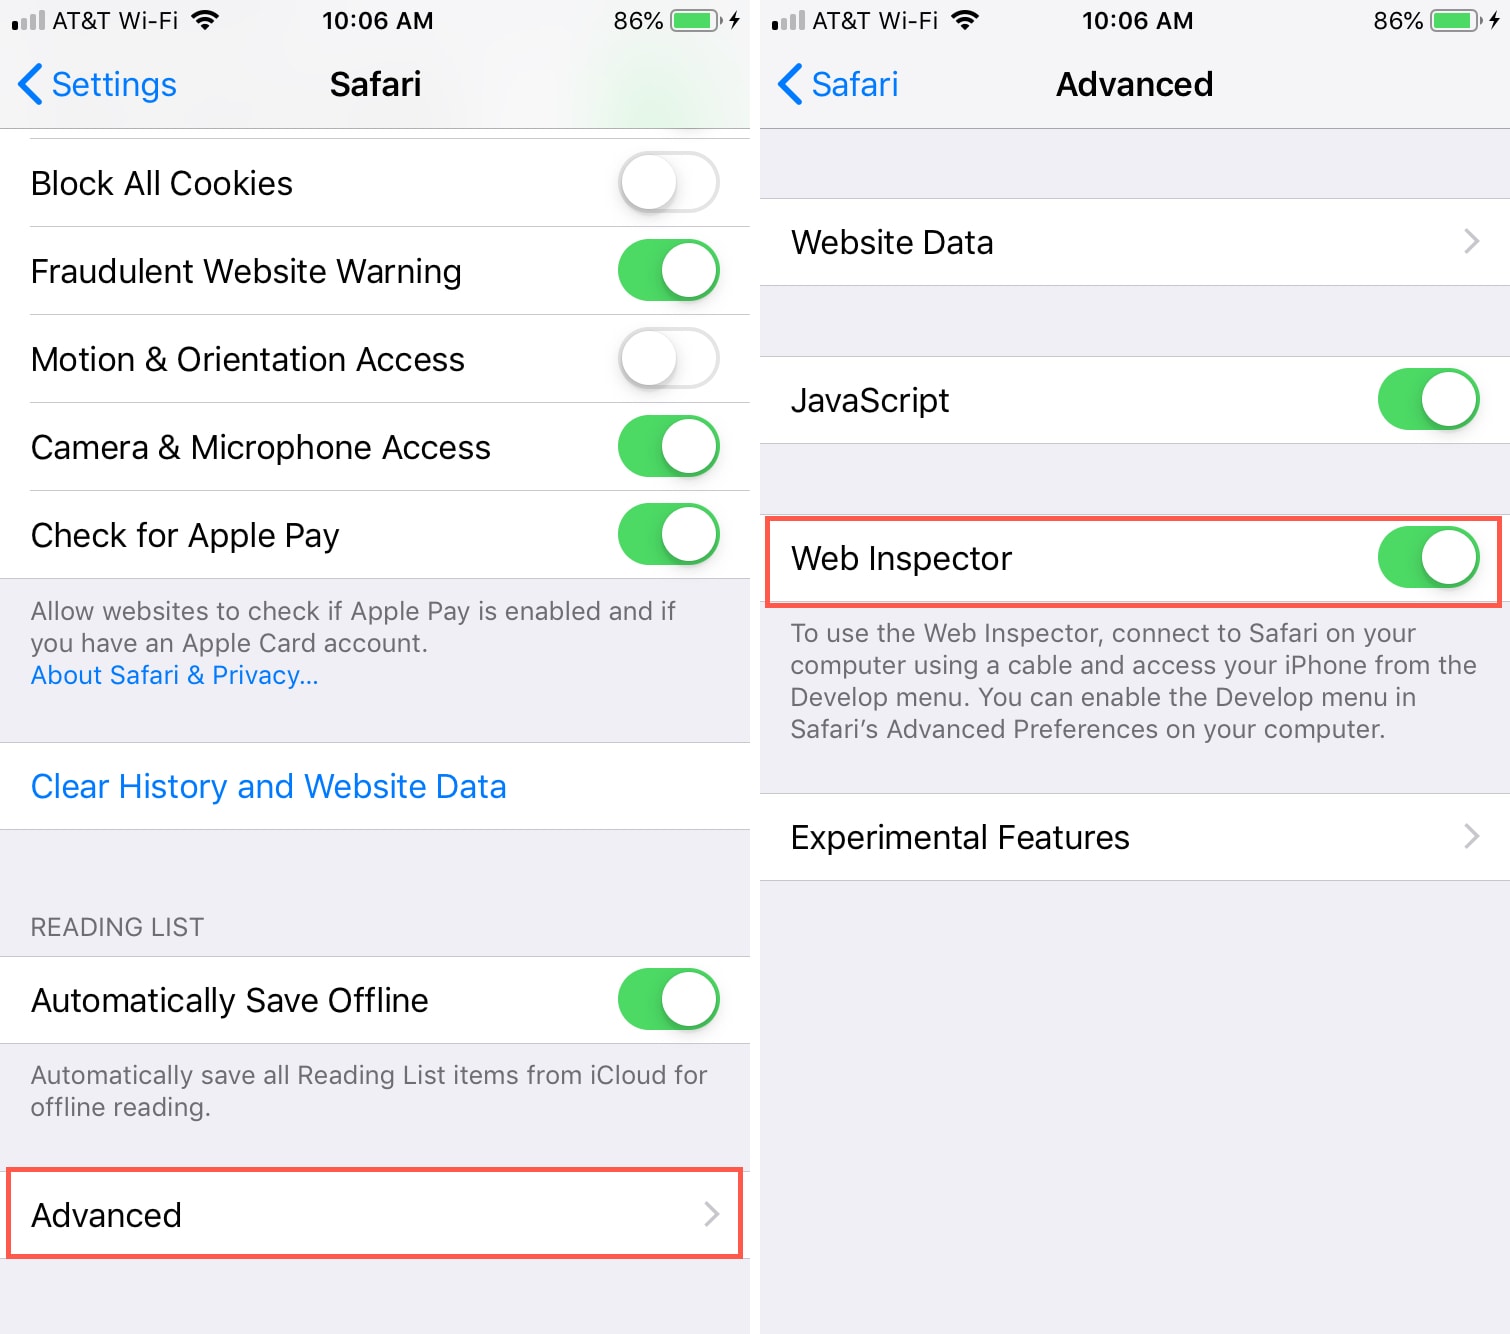
Next, make sure Safari is open on your iOS device and your Mac. After that, follow these steps:
1) Click Develop from the Safari menu bar on Mac, and you’ll see your iPhone or iPad listed here.
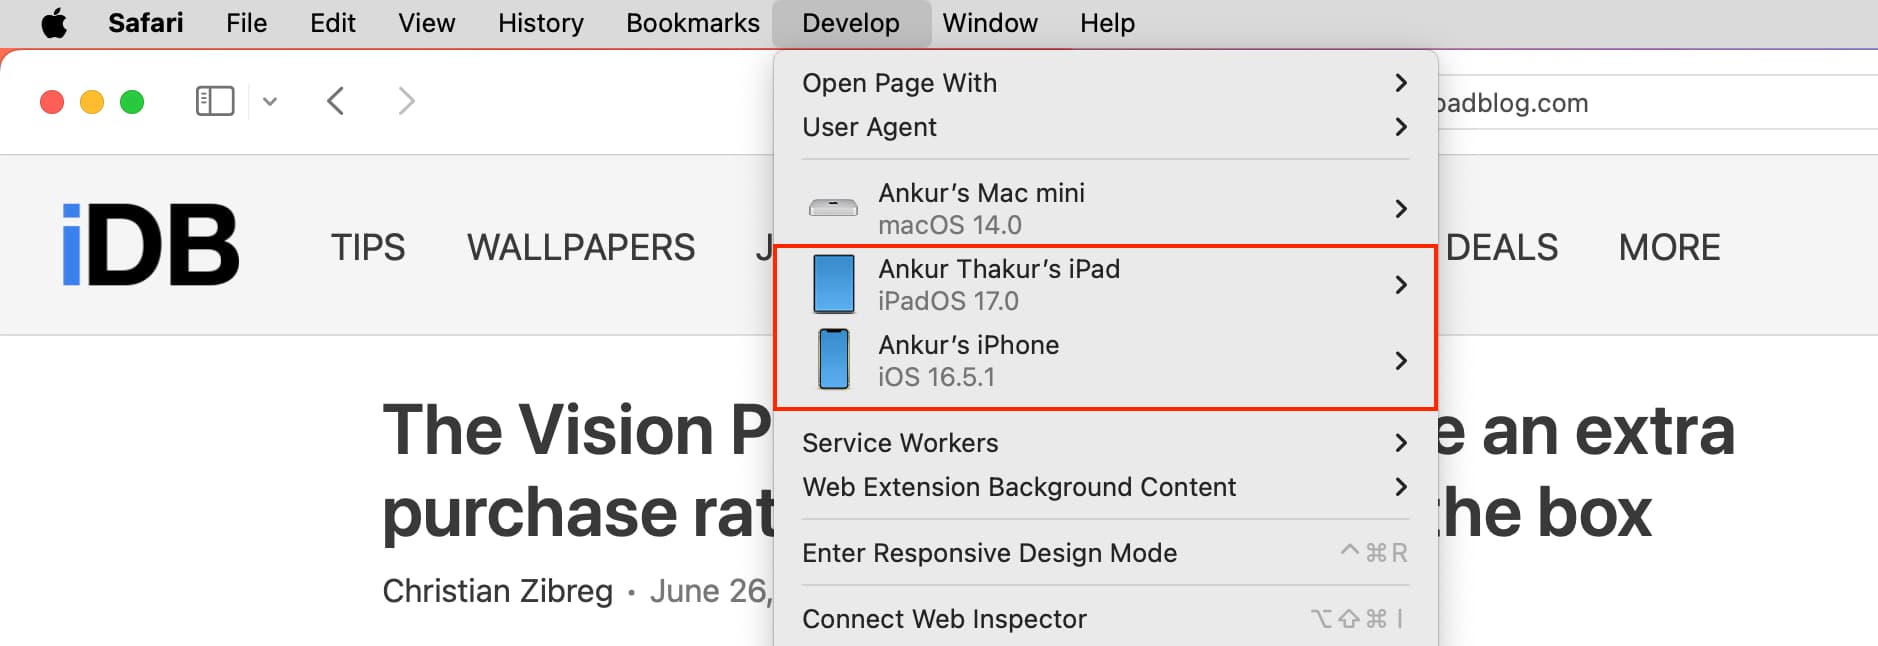
2) Mouse over the device, and you’ll then see the websites open in Safari on your mobile device.
3) Select the one you want, and the Web Inspector will pop open in a new window for you to use.

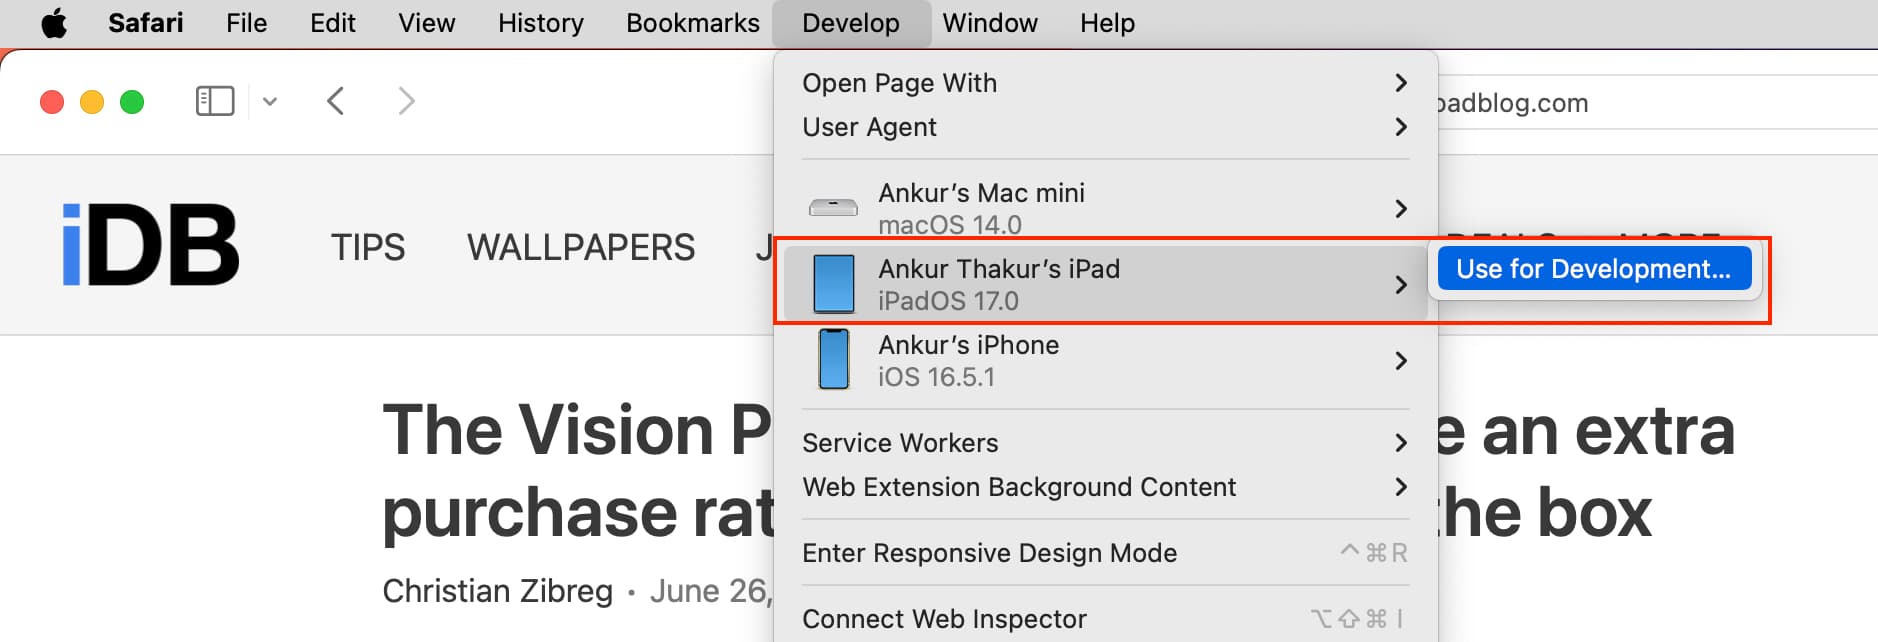
Note: If this is the first time you’re using your iPhone or iPad for this work, take your mouse cursor over that iPhone or iPad and click Use for Development . Next, tap Trust on your iPhone or iPad and enter the device passcode. Now, this iOS or iPadOS device is ready to be used for web inspection. If it still shows a correction error, simply unplug the USB cable and plug it in again.
Position the Safari Web Inspector
If you’re using the Web Inspector for iOS, it will remain in its own floating window.
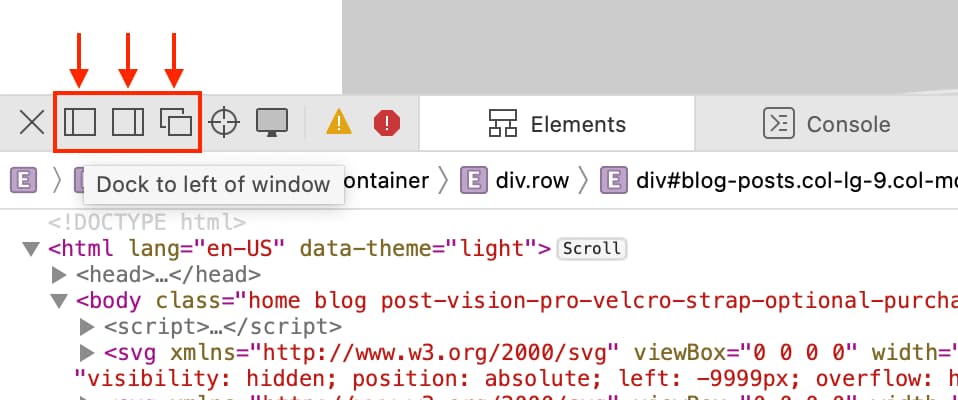
If you’re using it for Safari on your Mac, you can change its position. By default, Web Inspector displays at the bottom of your Safari window. To detach it and place it in a separate window or dock it to the left or right side of Safari, select one of the buttons from the top left of the Inspector window.
Get to know the Web Inspector
The Safari Web Inspector has a handy toolbar and tabs with some options that you can adjust to fit your needs.
Web Inspector toolbar
- “X” to close the Inspector
- Positioning buttons
- Reload button
- Download web archive button
- Activity viewer (resource count, resource size, load time, logs, errors, warnings)
- Element selector button
Web Inspector tabs
You can use all tabs or just a few. You can right-click or hold Control and click the tabs and then check and uncheck those you want to see. Rearrange the tabs by holding and dragging them to their new positions. And all the way to the right of the tabs bar, you’ll see a Settings button. This lets you adjust settings for tabs, indents, source maps, zoom, and more.

- Elements : Current state of the page’s Document Object Model
- Network : Resources loaded by the current page
- Debugger : View the JavaScript execution, variables, and control flow
- Resources : Resources being used by the current page’s content
- Timelines : A view of what the page’s content is doing
- Storage : State that is available to the page’s content
- Canvas : Contexts created from CSS
- Console : Shows logged messages and lets you evaluate JavaScript code
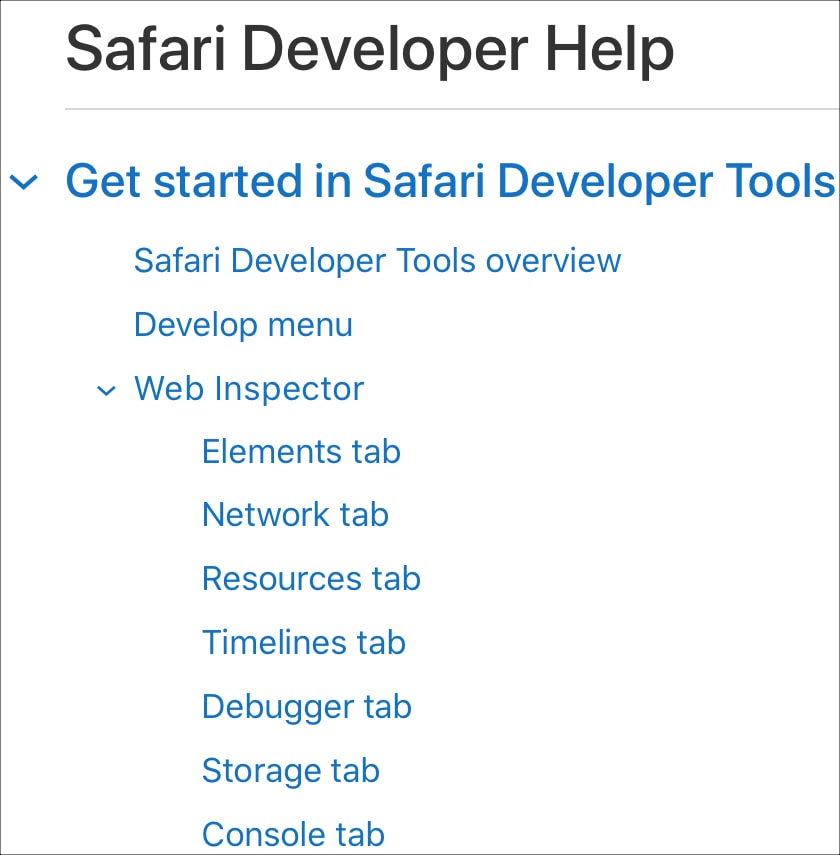
For in-depth help on a specific tab, you can head to the Apple Developer Support site . Select Table of Contents > Get started in Safari Developer Tools > Web Inspector .
Good luck with your inspection!
Hopefully, this guide will help you as you start working with the Safari Web Inspector for your iPhone, iPad, or Mac web development.
If you currently use the Web Inspector and have tips and tricks you’d like to share with others who are just starting, please feel free to comment below!
Check out next: How to view the source code of a webpage in Safari
- Get One: Tornado Alert Apps
- The Best Tech Gifts Under $100
How to Enable Safari's Debug Menu to Gain Added Capabilities
Find Safari's hidden menu
Tom Nelson is an engineer, programmer, network manager, and computer network and systems designer who has written for Other World Computing,and others. Tom is also president of Coyote Moon, Inc., a Macintosh and Windows consulting firm.
What to Know
- Enable debug menu by inputting defaults write com.apple.Safari IncludeInternalDebugMenu 1 into Terminal .
- Disable debug menu by inputting defaults write com.apple.Safari IncludeInternalDebugMenu 0 into Terminal .
- Relaunch Safari after turning the debug menu on or off.
Safari long had a hidden Debug menu that contained useful capabilities. Originally intended to assist developers in debugging web pages and the JavaScript code that runs on them, the debug menu was hidden away because the commands that were included in the menu could wreak havoc on web pages. Information in this article applies to Macs running OS X El Capitan (10.11) or earlier.
Safari Debug Menu in OS X El Capitan and Earlier
With the release of Safari 4 in the summer of 2008, many useful menu items in the Debug menu were moved to the new Develop menu . However, the hidden Debug menu remained and even picked up a command or two as Safari development continued. It was removed completely from OS X Sierra and later releases of the operating system.
Apple made accessing the hidden Develop menu an easy process, only requiring a trip to the Safari's preferences. Accessing the Debug menu, on the other hand, was a bit more complicated.
Enabling the Safari debug window requires the use of Terminal , a powerful tool for accessing hidden features of the Mac operating system and its many apps. Terminal is the secret to turning on Safari’s Debug menu.

Enable Safari's Debug Menu
Close Safari if you have it open and then:
Go to Applications > Utilities and launch Terminal .
Enter the following command line into Terminal by typing it or using copy and paste. Enter the command as a single line in Terminal, even though your browser may break it into multiple lines.
Press Enter or Return .
Relaunch Safari . The new Debug menu is available.
Disable Safari’s Debug Menu
If you want to disable the Debug menu, you can do so at any time, again using Terminal. Close Safari if it is open and then:
Launch Terminal .
Relaunch Safari . The Debug menu is gone.
Favorite Safari Debug Menu Items
With the Debug menu under your control, you can try out various menu items. Not all of the menu items are usable because many are designed to be used in a development environment where you have control over the web server. Nevertheless, useful items include:
- Force Repaint
- Show Frame Rate Meter, which displays CPU load, page frame rate speed, and updates being made to the page, all in the form of analog speedometers.
- Various flag options.
- Sync iCloud History.
- Depending on the version of Safari, the option to reset and recompute Top Sites.
Get the Latest Tech News Delivered Every Day
- Enable Disk Utility's Debug Menu
- Create Your Own Mac Recovery HD on Any Drive
- Make a Bootable USB Installer for OS X El Capitan
- How to Control the 2D or 3D Appearance of the Mac's Dock
- How to Make a Bootable Flash Installer of OS X or macOS
- Add Custom and Standard Dock Spacers to Your Mac
- How to Run Widgets on Your Mac Desktop
- Troubleshooting Slow Page Loads in Safari
- Add More Features by Turning on Safari's Develop Menu
- Use Terminal to Create and Manage a RAID 0 (Striped) Array in OS X
- How to Show Hidden Files and Folders on Mac
- Restore Autoplay to QuickTime X
- Create a Bootable macOS Sierra Installer on a USB Flash Drive
- AirDrop With or Without a Wi-Fi Connection
- How to Delete Apps on a Mac That Won't Delete
- View Hidden Files and Folders on Your Mac With Terminal
David Lozzi
- Debugging Safari/Chrome on your iPhone/iPad/iOS device

In the world of modern web development, Web 2.0 (or is it 3.0?), with HTML5, CSS3, ES6, and frameworks and libraries up the wazoo, our web apps and sites always work seamlessly and flawlessly across all the browsers and devices… hahaha, I know…
The reality is, web development, as great and modern as it is, can have little caveats and nuances across the different browsers: Chrome, Safari, FireFox, Edge, and the Mac/Windows/Linux/iOS/Android versions of each. Thankfully, the big contenders like Netscape (those were the days) and Internet Explorer have finally been deprecated and are no longer expected to be supported in the wild. Even with the great modern web, we still have issues once in a while.
In my recent efforts in troubleshooting one small “nuance” between Chrome on Mac and Chrome and Safari on iOS (yes, all three were acting differently), I needed to debug my browser on my iPad and/or iPhone. I won’t get into what the issue is here, instead, I’ll get into how we can debug the browsers on our iOS devices. I’ve searched for many options, some worked, some didn’t, so below is what worked for me.
All steps below are all running on my:
- MacBook Pro 16-inc, M1 Pro, running macOS Ventura 13.6
- iPad Air (4th) v15.3.1
- iPhone 14 Pro Max iOS v17.0.3
What are we debugging
Before we get started in debugging, we should cover what we’re debugging. In the following debugging methods, we can debug anything our browser can get to: netflix.com, google.com, or our public website. With CI/CD in place, I can make code changes and get them into my dev environment in under 5 minutes, and that suffices at times. I can then hit the site directly on my iPhone and debug as needed.
Sometimes, if I’m really diving into a granular issue and don’t want to wait, I like to use ngrok. Ngrok spins up a gateway from a public address to your local dev machine. This allows me to troubleshoot realtime on my mobile browser while writing the code on my laptop. It’s pretty slick and has saved me a lot of time. I can even share the ngrok address with my colleagues and they can access it on my local machine too! Another option would be to set up DNS for your iPhone to navigate to your laptop while on the same wifi network, and that’s not worth the effort in my book.
Debugging in Chrome on iOS
This is great quick way to check out your console messages without using your Mac.
- In Chrome on your iPad or iPhone, go to chrome://inspect and then press Start Logging .
- Now go do your thing in another tab, keeping this tab open.
- Come back anytime to see any and all console outputs!
See, no laptop/desktop needed, just do it on the mobile device.
This is as far as we can get with Chrome on iPhone/iPad. From my limited understanding, Chrome for iOS uses a WKWebView which gets difficult to actually attach to and debug. If the JavaScript console output isn’t enough, try Safari…
Debugging in Safari on iOS
This is a great method of debugging your iOS devices as it gives you the closest thing to actually debugging on your computer. With this method you can use the dev tools on your Mac to connect to your iOS Safari browser. It’s pretty sweet.
- On your Mac , open Safari, then go to Safari > Settings.
- Click Advanced and click Show Develop menu in menu bar at the bottom of the window. Close the window.
- On your iPad or iPhone , go to Settings > Safari > Advanced.
- Scroll to the bottom and enable Web Inspector .
For this next part, I recommend using a USB cable to attach your iOS device to your Mac. You might get away with doing this over Wifi, as I have in the past, but it’s not reliable .
- Connect your device to your Mac using a USB cable, or try the following over Wifi.
- On your Mac, in Safari, click the Develop menu.
- Near the top of the menu you should see your iPad or iPhone listed.
- Hover over your device in the menu and you’ll see Safari with each tab listed below. Click the one you want to debug.
- The Web Inspector should then appear, now debug it: Elements, Console, Sources, Network, all of it should work!
Good enough for now
Between these two techniques, I’ve been able to troubleshoot my issues quite successfully. Generally, iOS Safari and Chrome act relatively the same, so debugging in Safari helps me clear my Chrome issue. And if it doesn’t I can always throw in more console.log s and see what Chrome is actually doing. Ideally, we should be able to debug the code directly on Chrome, like we can do with Safari, but at this time it’s just not possible.
One other option, for a cost: inspect.dev
There’s a product called inspect.dev that boasts it can debug Safari, Webviews, and Chrome from macOS, Windows, and Linux. Learn more at https://inspect.dev/why . I have not tried them out, I don’t want to pay for something that should be free for developers (hence this blog post).
Let me know if you know other ways to debug your mobile browsers! Leave a comment below or let’s connect on Twitter .
‘Til next time, happy debugging!
Please share the love!
- Click to share on Twitter (Opens in new window)
- Click to share on Facebook (Opens in new window)
- Click to share on LinkedIn (Opens in new window)
- Click to email a link to a friend (Opens in new window)
- Click to print (Opens in new window)
- Click to share on Reddit (Opens in new window)
- Click to share on Pocket (Opens in new window)
- Click to share on WhatsApp (Opens in new window)
7 thoughts on “ Debugging Safari/Chrome on your iPhone/iPad/iOS device ”
You should also check out using x-code’s simulator. Safari Dev Tools can attach to the Safari session on the simulator and you’re off to the races!
Oh yea, i just found that and then forgot that… thanks I’ll check it out closer and share my findings!
Thanks for article. One small correction Chrome for iOS uses WKWebView.
Thanks for the fix! will update
- Pingback: [FIXED] The image is taking the original dimentions of it on the phone after deployment - Learn How to FIX your angular code
Thanks bro! I’ll follow yours steps, wish me luck.
Leave a Reply Cancel reply
- Collaboration
- Microsoft Forms
- Microsoft Planner
- Microsoft Power Apps
- Microsoft Power Automate (Flow)
- Microsoft Teams
- Microsoft To-Do
- Office 365 Hybrid
- Office 365 SharePoint Online
- Productivity
- SharePoint 2013 Administration
- SharePoint 2013 Apps
- SharePoint 2013 Development
- SP2010 Administration
- SP2010 Authentication
- SP2010 Customization
- SP2010 Infrastructure
- SP2010 User
- SP2010 Workaround
- Uncategorized
- Users Don't Like SharePoint
Top Posts & Pages
- Use Microsoft Forms to collect data right into your Excel file
- Sending a beautifully formatted email from Power Automate (Flow)
- Saving data from Microsoft Forms into Excel using Power Automate (Flow)
- Understanding Power Automate's Outlook Send Email Actions
- Style up your console.logs
- When Power Automate (Flow) can't find your Microsoft Form
- Showing users' profile pictures in a SharePoint list
- Use Microsoft Flow to remind the Team of due dates from Planner
- Squeezing a little more formatting out of Microsoft Forms
- Stack Overflow

- 2,081,493 hits
Discover more from David Lozzi
Subscribe now to keep reading and get access to the full archive.
Type your email…
Continue reading

by Jason Snell & Dan Moren
This Week's Sponsor
Magic Lasso Adblock : YouTube ad blocker for Safari
By Dan Moren
September 21, 2020 8:48 AM PT
Enabling the Debug menu in Safari 14 on Big Sur and Catalina
Note : This story has not been updated since 2020.
Update 9/22: After further testing, it seems the standard defaults write command does continue to work in macOS Catalina with Safari 14, though the Big Sur beta may require the method mentioned below.
Update 2 9/22: Oh, what a tangled web we weave… It turns out it’s a little more complicated than the post below makes it sound. Developer Jeff Johnson has written a great blog post explaining exactly what’s going on here: it involves a combination of macOS sandboxing and System Integrity Protection. In certain cases you can use defaults write in Big Sur—if you’ve granted Terminal access to your disk in the Security & Privacy pane in System Preferences.
With new Apple software updates come new questions, and reader Martin has one related to an old tip of mine:
Thanks for the great tip on fixing tab behavior . However, the directions on how to get the debug menu no longer seem to work with Safari 14. Any idea on how to enable nowadays?
Great question! The tip in question deals with making new Safari tabs open at the end of the window rather than next to the active tab, a behavior that many users prefer. Thus far you’ve been able to change that setting in Safari’s hidden Debug menu, but Martin’s right that Safari 14 adds some additional complications.
It seems that the trusty defaults write command does no longer allows users to enable Safari’s Debug menu. So I enlisted my pal, dicemaster, and developer extraordinaire James Thomson to help me figure out this puzzle.
First, just to note: it seems that, having already had the Debug menu enabled on my iMac running Catalina, it’s persisted with the update to Safari 14. But if you want to newly enable it in Safari 14 on Catalina (or on the Big Sur beta), you’ll need to use the following process.
So, with the Safari 14 update, the preferences file that you need to edit to enable the Debug menu no longer resides in the Preferences directory of your library 1 , and the defaults command thus can’t edit it. However, it’s still possible to make the Debug menu show up—it’s just a little more complicated.
You’ll want to navigate to ~/Library/Containers/com.apple.Safari/Data/Library/Preferences/ —note that if you’re trying this on the Big Sur beta and you’re using the Finder and not Terminal, the path is ~/Library/Containers/Safari/Data/Library/Preferences/ . 2
No matter how you get to that folder, open the com.apple.Safari.plist file in it using your favorite text editor—I’d, naturally, recommend BBEdit, but TextEdit should work too.
Scroll down or search the file to find the phrase IncludeDevelopMenu —this isn’t the key that you want to edit, but it’s handy to keep things organized. Above that entry (which should start with <key> ), paste the following two lines:
<key>IncludeInternalDebugMenu</key> <true/>
Save the file, reboot Safari, and voilà, the Debug menu should appear, allowing you to once again set your tab behavior to that which is undeniably correct. Happy tabbing!
- That clearly made too much sense. ↩
- It’s the same directory, but in Big Sur it displays differently in the command-line and the GUI for…reasons?) ↩
[ Dan Moren is the East Coast Bureau Chief of Six Colors. You can find him on Mastodon at @[email protected] or reach him by email at [email protected]. His latest novel, the supernatural detective story All Souls Lost, is out now . ]
If you appreciate articles like this one, support us by becoming a Six Colors subscriber . Subscribers get access to an exclusive podcast, members-only stories, and a special community.
Search Six Colors

IMAGES
VIDEO
COMMENTS
Web development tools. Apple has brought its expertise in development tools to the web. Safari includes Web Inspector, a powerful tool that makes it easy to modify, debug, and optimize websites for peak performance and compatibility on both platforms. And with Responsive Design Mode, you can preview your web pages in various screen sizes ...
Connect the iOS device to the machine. Enable the Web-Inspector option. To do so: Go to Settings > Safari > Scroll down to the bottom > Open Advanced Menu>. Turn on Web Inspector. Open the desired web page to debug or preview on your mobile Safari browser. Once done, enable the Develop menu on the Mac device.
Open Safari on your Mac and click the "Safari" button in the menu bar. Next, select "Preferences." Alternatively, you can use the keyboard shortcut Command+, (comma). This will also open up Safari preferences. Go to the "Advanced" tab. Check the box for "Show Develop Menu in Menu Bar." Now the Develop menu will appear between Bookmarks and ...
Here's how: Open the iPhone Settings menu. On an iPhone with an early version of iOS, access the Debug Console through Settings > Safari > Developer > Debug Console. When Safari on the iPhone detects CSS, HTML, and JavaScript errors, details of each display in the debugger. Scroll down and tap Safari to open the screen that contains everything ...
To debug your website using the Responsive Design mode on Safari, follow the steps mentioned below: Enable the Developer Menu. To do that, launch the Safari Browser on your Mac computer. Go to Preferences > Advanced and check the Show Develop menu in the menu bar. Navigate to the website you want to debug.
To open the Safari Developer Tools, right-click on Inspect and start debugging. You can leverage other built-in features offered by LambdaTest, like geolocation testing, uploading files, accessibility, and much more. Using Safari, you can use the Responsive Design Mode while debugging your websites on LambdaTest.
1) Click Develop from the Safari menu bar on Mac, and you'll see your iPhone or iPad listed here. 2) Mouse over the device, and you'll then see the websites open in Safari on your mobile device. 3) Select the one you want, and the Web Inspector will pop open in a new window for you to use. Note: If this is the first time you're using your ...
Enable Web Inspector on iOS : Open the Settings app on your iPhone or iPad. Scroll down and tap Safari. Scroll to the bottom of the page and tap Advanced. Tap the toggle next to Web Inspector to the On position. Enable Safari Developer Mode on Mac : Open Safari on your Mac. Click Safari in the top left corner of your Menu Bar.
Method 2: Using Web Inspector for Debugging on Safari. Furthermore, developers can leverage the Web Inspector to inspect any particular element and debug a specific issue for a specific screen size. One can find the web inspector in the Develop menu. Once the web inspector is active, inspect a particular element using the element selector.
Enable Safari's Debug Menu. Close Safari if you have it open and then: Go to Applications > Utilities and launch Terminal . Enter the following command line into Terminal by typing it or using copy and paste. Enter the command as a single line in Terminal, even though your browser may break it into multiple lines.
How to enable Safari ITP Debug mode. 3. Running Safari with debug version of Webkit. 3. Safari on macOS Catalina - "Debugger" tab missing from developer tools? Hot Network Questions I have an array inside of equation and aligned, not recognizing math mode
On your Mac, in Safari, click the Develop menu. Near the top of the menu you should see your iPad or iPhone listed. Hover over your device in the menu and you'll see Safari with each tab listed below. Click the one you want to debug. The Web Inspector should then appear, now debug it: Elements, Console, Sources, Network, all of it should work!
Mac OS Big Sur & MacOS Monterey CHANGED How to Enable the Hidden Safari Debug Menu - I think Apple's TCC (Transparency Control & Consent) Security is the iss...
Open Safari and verify Debug menu is visible. After typing the command and pressing enter to run it, the next thing to do is to open Safari. You could do this by launching the app from either Finder or Dock. Then click Safari straight from the menu bar, which you can clearly see on the top left corner of the screen.
Type in the following command exactly as it is given, better copy and paste it. defaults write com.apple.Safari IncludeInternalDebugMenu 1. Step #4. Now hit Enter to execute the command. Step #5. You can now launch Safari and you'll see a new menu " Debug " listed. Step #6. This is an optional step, in case you wish to disable Debug menu.
Above that entry (which should start with <key> ), paste the following two lines: <key>IncludeInternalDebugMenu</key>. <true/>. Save the file, reboot Safari, and voilà, the Debug menu should appear, allowing you to once again set your tab behavior to that which is undeniably correct. Happy tabbing!