Advertisement

Sustainable Tourism as a Driving force of the Tourism Industry in a Post-Covid-19 Scenario
- Original Research
- Published: 12 June 2021
- Volume 158 , pages 991–1011, ( 2021 )
Cite this article

- Beatriz Palacios-Florencio ORCID: orcid.org/0000-0003-2789-7914 1 ,
- Luna Santos-Roldán 2 ,
- Juan Manuel Berbel-Pineda 1 &
- Ana María Castillo-Canalejo 2
17k Accesses
39 Citations
1 Altmetric
Explore all metrics
The tourism industry is probably one of the most affected by the crisis caused by Covid-19. It is the responsibility of politicians, tourism professionals and researchers to look for solutions to revive this important industry. This article shows how the development of Sustainable Tourism can help in the sustenance of the tourism industry, since one of the premises on which Sustainable Tourism is based is the non-overcrowding of tourist destinations (essential factor in the current context). Considering this argument and the existing regulations on lockdown rules, social distancing and meet up, it is considered that the practices in Sustainable Tourism can become a potential solution to stimulate tourist movements and help the revival of the tourism industry. Therefore, more specifically, the main objective of this article is to know tourist´s perception among about Sustainable Tourism and to determine which factors help its development. In this sense, the use of structural equation models in a research of 308 tourists has determined how factors related to the tourists’ attitude, motivation and perceived benefits provided by the development of Sustainable Tourism increase the intention to consume this type of tourism.
Sustainable Tourism in Europe from Tourists’ Perspectives

Sustainable Tourism and Degrowth: Searching for a Path to Societal Well-Being

Sustainable Tourism; Vector of the Social and Solidarity Economy: Case of Region Souss Massa, South of Morocco
Avoid common mistakes on your manuscript.
1 Introduction
It is widely accepted that one of the aspects considered by Sustainable Tourism is the fight against overcrowding in certain tourist destinations and avoid damages associated (eg. Jurowski & Gursoy, 2004 ; Santana-Jiménez & Hernández, 2011 ). In fact, Sustainable Tourism has been trying (for years) to place itself as a solution to the negative aspects that involve tourism in its development and to the criticism it frequently receives (Sharpley, 2020 ). And it is now, in this context, that this perception makes more sense than ever before.
The massification of tourist destinations and the damage this causes (both in cities and to natural environments), is one of the fiercest criticisms levelled at tourism. In this sense, Sustainable Tourism is based, among other things, on promoting and developing less massified tourist destinations or Sustainable Mass Tourism as the desired impending outcome for most destinations. In relation to this, the research of Weaver ( 2012 ) highlights the concept of Sustainable Mass Tourism as an emerging tourism state—something that can be convenient reconsidered in the current situation-. According to this author, this type of tourism is perceived as a desired outcome for destinations with a focus on sustainability and indicates three convergent developmental trajectories: organic, incremental and induced.
On the other hand, we would like to point out that, among the measures being taken to combat Covid-19, restrictions on meetings and social distancing measures stand out (World Health Organization, 2020 ). And, why are these measures being referred to here? The explanation is simple, as this paper takes as the basis the fight against overcrowding in tourist destinations; relating it to the measures adopted (nearly worldwide), due to the social distancing caused by Covid-19. In fact, this measure, together with the tourist's perception of fear of travelling, are the ingredients for preventing overcrowded destinations, and therefore strenght Sutainable Tourism.
Therefore, it can be stated that tourism industry is highly sensitive to significant shocks like the Covid-19 pandemic (Chang et al., 2020 ). In other words, tourism is particularly susceptible to measures to counter pandemics due to restricted mobility and social distancing. This leads to global travel restrictions (which are unprecedented) that, together with confinement, are causing the most severe disruption to the global economy in recent decades (Gössling et al., 2020 ). According to the declarations made by the World Tourism Organization (UNWTO) on its website, on April, 96% of worldwide destinations have implemented travel restrictions. Around 40 destinations are experiencing a partial border closure, while 90 destinations have closed totally their borders. An unforeseen and, for the time being, unpredictable situation that urges survival measures for the sector.
Given this current scenario, Sustainable Tourism may find a great opportunity for its development (Higgins-Desbiolles, 2020 ; Petrizzo, 2020 ). Indeed, this article focuses primarily on determining factors focuses on the tourist's perception for promoting Sustainable Tourism.
The UNWTO defined in 2005 the concept of Sustainable Tourism as “ one whose practices and principles can be applicable to all forms of tourism in all types of destinations, including mass tourism and the various niche tourism segments ”. Sustainability principles refer to the environmental, economic, and socio-cultural aspects of tourism development, and a suitable balance must be established between these three dimensions to guarantee its long-term sustainability (UNWTO, 2005 ). In addition to international organizations, we also find many authors who have defined the concept of Sustainable Tourism (Higgins-Desbiolles et al., 2019 ; Hussain, et al., 2015 ; Mohaidin, et al., 2017 ). Conversely, despite the fact that Sustainable Tourism has been recognized in business practice in many destinations, the volume of academic research has not been as large as it deserves (Ruhanen et al., 2015 ). From the start, the development of Sustainable Tourism is based on the preservation of the environment (Ciacci et al., 2021 ), the cultural authenticity and the democratic profitability of the tourist activity in destination (Crosby, 1996 ). It is only this tourism that recognizes the priority place of social return, as an index of well-being reversed on the visited destination; and also the exclusively economic return, that is, whether the tourist activity generates sufficient income for the local population, in terms of employment, wealth and available resources (Fernández, 2018 ).
The purpose of this study is to identify the factors that help the development of Sustainable Tourism (from a tourist's perception point of view), since a greater use of this type of tourism could help the revival of the tourism industry. In this sense, and considering the guidelines of the World Health Organization (WHO), the different governments in all countries recommend avoiding large concentrations of people (which favors the development of this type of tourism).
However, in generic terms, tourism implies people concentration, and even more so in those destinations considered as “overcrowded”: large cities, charming cities, main beach locations, amusement parks, airports, etc. That is why, under the conditions exposed, it is necessary to combat the social, economic, financial and cultural consequences of a pandemic, which entails a challenge for the tourism sector, that requires a careful assessment of its impact dimensions, as well as a reconsideration of a new hitherto unknown approach. Thus, the development of tourism as it is currently known will change in the coming years, which will have serious repercussions on the profitability of tourism industry (Hancock, 2020 ).
Henceforth, this study gives an assessment of Sustainable Tourism and the variables that enable accelerated development (which becomes more necessary in this crisis context in tourism industry). The theoretical frame study analyzes the factors of perceived quality, motivation, attitude, and satisfaction as attributes with a potential influence on the intention of choosing this kind of tourism. Consequently, the study is based on literature focused on consumer behavior based on their perception. However, the main contribution of this study is not theoretical (since there is a lot of literature based on this approach). The main contribution lies in extracting all the positive aspects that sustainable tourism brings to tourism development and highlighting its value in these times of crisis that this industry is going through.
2 Theorical Background
2.1 the relation between positive impacts and the attitude towards the development of sustainable tourism, the perception of service quality and motivation.
Most research conclude that the three basic categories of benefits and costs that affect to a community which receives tourists are economic, environmental, and social (Chi-Ming et al., 2017 ; Gee et al., 1989 ; Gunn, 1988 ; Gursoy et al., 2000 ; Gursoy et al., 2002 ; Murphy, 1985 ; Nunkoo & So, 2015 ; Palacios-Florencio et al., 2018 ; Vargas, 2007 ).
The economic benefits of tourism development are usually translated into employment opportunities (Belisle & Hoy, 1980 ; Davis et al., 1988 ; Ritchie, 1988 ; Tyrrell and Spaulding, 1984 ; Tosum, 2002 ; Var et al., 1985 ), income derivatives of the tourism sector (Davies et al., 1988 ; Lankford, 1994 ; Jurowski et al., 1997 ; Murphy, 1983 ; Tyrrel and Spaulding, 1984 ) and investment and business opportunities (Davis et al., 1988 ; Sethna & Richmond, 1978 ).
Regarding the social impact of tourism, it can be conceived as changes in the people lives residing in the communities that are part of the destination and related to tourism activity (Mathieson & Wall, 1982 ). Likewise, the social and cultural benefits (Besculides et al., 2002 ) translate into an increase in leisure activities (Keogh, 1990 ; Liu et al., 1987 ; Murphy, 1983 ; Pizam, 1978 ; Rothman, 1978 ; Sheldom and Var, 1984 ), the improvement of public services and infrastructures (Pizam, 1978 ; Sethna & Richmond, 1978 ) and the instigating effect on social change (Harrison, 1992 ). Between its benefits, tourism increases cultural identity and pride, the cohesion and the exchange of ideas, improves knowledge of the area culture (Esman, 1984 ), creates opportunities for cultural exchange, revitalizes local traditions, increases the quality of life and improves the image of the community (Besculides et al., 2002 ).
Similarly, in the environmental field, tourism may be the reason to protect natural resources and conserve homogeneous urban designs (Díaz & Gutiérrez, 2010 ), so that it can be possible to promote an ordered tourist development based on a model integrated in the environment. Miller et al., ( 2014 ) refer to the concept of pro-environmental behaviour, understood as the actions for protecting the environment, while tourists´ pro-environmental behaviour were connected to nature-based tourism and ecotourism. Ciacci et al., ( 2021 ) adds to the environmental factor, logistical and infrastructural dimension. While it is true that environmental quality can be composed by objective and subjective components, it has been widely accepted that a good link between environmental protection, logistic and infrastructural development is seen as fundamental for a successful Sustainable Tourism development strategy.
The notion of sustainable development is a relatively recent concept, first defined in 1987 in the Brundtland report by the UN. This report, also called “Our Common Future”, declares that sustainable development tries to “meet the needs of the present generation without the ability of future generations to meet their own needs” (CMMAD, 1992 : 67).
Following the arrival of the concept of sustainable development in 1987 with the aforementioned Brundtland report, it was applied to the tourism field.
This type of tourism weights the importance of stakeholders and, although the key role of residents is recognized (Gursoy et al., 2018 ; Stylidis et al., 2014 ), it is also interesting to analyze the perspective of the tourists themselves. Indeed, knowing the attitudes of tourists towards the development of Sustainable Tourism and raising culture, environment and economy awareness of the communities visited are vital factors to protect tourist destinations and reduce negative impacts (Othman et al., 2010 ).
On the other hand, most studies report a positive relation between the attitude towards Sustainable Tourism development and the perception of its positive impacts (Andereck & Vogt, 2000 ; Byrd et al., 2009 ; Chi-Ming et al., 2017 ; Ekanayake & Long, 2012 ; Hussain, et al., 2015 ; Pavlić et al., 2017 ; Su & Chang, 2017 ). The provision of high quality and environmentally friendly services has been identified as an important factor for the success of a tourist destination (Miller et al., 2014 ).
Service quality is defined as the level of satisfaction an event or experience produces according to individual needs or expectations (Michael, 2013 ). Mukhles ( 2013 ) proposes five main components to analyze the quality of the tourist service: attractions and neighborhoods, facilities and services, accessibility, destination image, and pricing. The attractions and neighborhoods of the destination are elements that largely determine the choice of tourists and motivate the visit to this destination, include both natural and artificial attractions. The facilities and services include accommodation, restaurants, transportation, sports or other activities and tourist sale points. Accessibility includes elements related to transport and its infrastructure. The destination image is the subjective interpretation of reality by the tourist and, the fifth component, the price enables to measure the quality of the different services. On the other hand, Mohaidin et al. ( 2017 ) considers other attributes that should be taken into account: the environment safety and harmony and the ability to perform the promised service in a reliable and accurate way. Hence, the following model hypotheses are raised:
Tourism motivation is a driving force that motivates people to go on holiday or visit destinations. Beerli and Martin ( 2004 ) describe the motivation to travel as an internal need that drives an individual to act in a certain way to achieve his desired satisfaction. Yoon and Uysal ( 2005 ) found that motivation is the most important factor that increases satisfaction together with the services and the loyalty to a destination. In addition to being the most important factor in predicting tourism behavior, motivation to travel also significantly influences the understanding of the intentions of tourist visits (Li et al., 2010 ; Mohaidin, et al., 2017 ).
The motivation to travel to a destination will be higher whether the tourist is aware of the positive impacts that Sustainable Tourism can have on there (Crouch & Ritchie, 1999 ). From this information, the following hypothesis of this study is proposed:
2.2 The Relation Between the Attitude Towards the Development of Sustainable Tourism and the Intention to Choose a Sustainable Tourist Destination
Intention can be defined as a stated probability of engaging in a certain behavior (Oliver, 1997 ). Efforts to recognize and attract the right visitors are crucial in ensuring Sustainable Tourism. Behavioral intentions represent a vital issue in the field of tourism, since it is necessary to know and understand the tourist loyalty, i.e. the factors that influence positive intentions towards a destination (Mohaidin et al., 2017 ).
Ventakesh ( 2006 ) and Mohaidin, et al. ( 2017 ) point out that, among the psychological factors that affect tourists in their intention to select a sustainable tourist destination, a respectful attitude towards the environment has a positive effect. Luo and Deng ( 2008 ) verifies that people who show positive attitudes towards the environment during trips can transmit a greater desire for Sustainable Tourism experiences with nature.
Miller, et al. ( 2014 ) indicate that are several types of variables that are associated with pro-environmental behavior in the context of large mass tourism urban destinations, including individual background factors, habit, attitudes and external contextual factors. This study suggests that psychological factors such as attitudes may be more important than socio-demographic and contextual factors in determining pro-environmental behaviour in sustainable urban tourism destination.
From these statements, the following hypothesis is interpreted:
2.3 The Relation Between Motivation and Attitude Towards the Development of Sustainable Tourism
Along with satisfaction, knowing the motivations of tourists is the basis for understanding the following behavior trends (Jensen, 2015 ; Xu and Chan, 2016 ). For Wong et al. ( 2017 ), it is a two-phase process where internal and external factors converge. In this sense, the internal factors concern the desire to make the trip. Kim et al. ( 2007 ) incorporates psychological reasons such as disconnection and relaxation. For their part, external factors promote the destination choice, including cultural and unique features of the destination (Pesonen et al., 2011 ).
The tourist motivation has positive effects on their visit intention, as the commitment to the environment, nature care and conservation in the case of Sustainable Tourism development (Hunter, 2000 ). Huang and Liu ( 2017 ) apply these constructs to ecotourism to confirm that greater environment sensitivity of tourists is related to the motivation and the intention to repeat the visit. Similarly, Zhang and Lei ( 2012 ) argue that environmental knowledge and concern are directly related to the motivation and intention of a tourist visit.
2.4 The Relation Between the Perception of Service Quality and Satisfactory Experience
Understanding what factors influence tourist satisfaction is one of the most relevant research topics in the tourism sector, due to the impact it has on the success of any tourism product or service. The perceived quality is a measure that represents the quality obtained from product or service attributes and is related to the satisfaction of the customer’s needs and the product or service availability (ACSI, 2016 ).
It is widely recognized in the literature that the service quality perceived by the customer directly influences the tourist experience satisfaction (Castillo Canalejo & Jimber del Río, 2018 ; Hui et al., 2007; Mohaidin et al., 2017 ; Wu et al., 2016 ). Therefore, the following model hypothesis is formulated:
2.5 The Relation Between the Attitude Towards the Development of Sustainable Tourism and Satisfactory Experience
Experimental satisfaction goes beyond the concept of service satisfaction, taking into account it focuses on customers’ evaluations regarding their experiences once such service has been consumed (Wu et al., 2016 ). If this is applied to sustainable development in the aforementioned Brutland Report, the concept of satisfaction becomes vitally relevant. The development of Sustainable Tourism must satisfy the needs of tourists and residents at the same time that economic, socio-cultural and environmental need (UNWTO, 2005 ).
In the scientific literature, some authors (Chang & Fong, 2010 ; Kao et al., 2008 ; Wu et al., 2016 ) allude to green experiential satisfaction to refer to the clients’ general evaluations regarding their experience with respectful aspects of the environment and its expectations on the sustainable development of tourist destinations or services. From the study of these authors, the following hypothesis is based:
2.6 The Relation Between Satisfactory Experience and Intention to Choose a Sustainable Tourist Destination
Another widely recognized factor in the scientific literature that influences the intention to visit a place is satisfaction. According to Oliver ( 1980 ), it is considered as the balance of expectations and perceptions before and after the visit to a destination, whose importance lies in the ability to influence future behavior (Ohn & Supinit, 2016 ; Choo et al., 2016 ). In tourism studies, the satisfaction produced by the experience of tourist activities is especially important, as these are the most memorable and are conceived as a differentiating element from other visits (Walls et al., 2011 ).
There are numerous studies that prove the relation between tourist satisfaction and the intention of returning (Baker & Crompton, 2000 ; Beecho and Prentice 1997 ; Castillo Canalejo & Jimber del Río, 2018 ; Caneed, 2003 ; Dimitriades, 2006 ; Hallowell, 1996 ; Pizam, 1994 ; Sung, et al., 2016 ). Other authors, such as Jurdana and Frleta ( 2012 ) or Chin et al. ( 2018 ), focus on a specific type of tourism: rural tourism. From the reading of these authors, the following hypothesis is proposed:
2.7 The Relation Between Motivation and Intention to Choose a Sustainable Tourist Destination
Motivation is an individual internal factor that can affect the tourist behavior by influencing their trip valuation. This construct can be considered as a key factor in the process of selecting tourist destinations and the intention to visit (Chang et al., 2014 ; Hsu and Huang 2009 ).
In the bibliography, we find several examples of authors that demonstrate that motivation and satisfaction influence the tourist’s decision when choosing a destination (Chiu et al., 2016 ; Yoon & Uysal, 2005 ). In this sense, the study of Malaysia of Mohaidin et al. ( 2017 ) confirms that motivation positively influences the intention to choose a sustainable tourist destination, in line with the results offered by Beerli and Martin ( 2004 ), and Prebensen ( 2006 ). Based on this, the last hypothesis is proposed:
In summary, hereunder the conceptual model to be studied is shown in Fig. 1
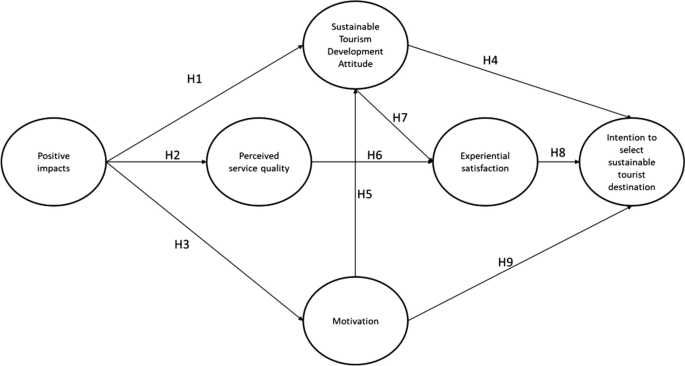
Conceptual mode. Source Own elaboration
3 Data and Methodology
The data was collected from tourists who visited the city of Córdoba (Spain) between the months of October and November 2019. Córdoba (a World Heritage city) is one of the main cities receiving tourism (both national and international). This means that one of the main challenges that it faces is massification and the problems associated (Weaver, 2012 ). The sample included a total of 308 tourists, who received the questionnaires personally and on-site in the monumental area of the city. The questionnaires were handed out randomly to people visiting the monumental area, after requesting their collaboration and verifying that they were tourists and not simple passers-by. Despite its possible limitations, we considered this procedure to be the most appropriate for the objectives of this research. So, we have used a non-probabilistic sampling.
In relation to the instruments used, the original versions of the scales were translated with special attention into the linguistic characteristics of the population. All variables were measured on a Likert scale from 1 to 5. Where 1 = totally disagree and 5 = totally agree. The items in the questionnaire were translated and adapted for the different constructs. The items of positive socio-cultural, economic and environmental impacts were extracted and adapted from Pavlić et al. ( 2017 ), the items related to experiential satisfaction were obtained from the research carried out by Wu & Li ( 2015 ), the items of Sustainable Tourism Development Attitude were adapted from the study of Wei-San Su et al. ( 2017 ), and the constructs of “perceived service quality, intention to select sustainable tourist destination and motivation” were extracted and adapted from Mohaidin et al. ( 2017 ).
Table 1 shows the main aspects related to the respondents’ profile. It has to be emphasized that a relative equality is observed regarding the origin of the tourists surveyed. In general, these are tourists who come on holiday, own financing and, in a high percentage of cases, basing on their own decision. More than 60% of the travelers are 35 years old or more, have a stable partner (married and living as a couple), live in households based on 2 or more people and earn a monthly income of between 1000 and 2000 euros. Although the majority of the respondents stated that they were visiting this city for the first time (62.7%), a high percentage (close to 40%) repeated their destination. On average, the tourists who participated in the study stayed in the city for 2–3 days.
For the analysis of relations between the variables of the proposed model, structural equation modeling has been used, more specifically the Partial Least Squares (PLS) technique, based on variance (Roldán and Sánchez-Franco, 2012 ). We have specifically chosen this technique for the following reasons (Cepeda-Carrion and Roldan, 2004 ): (a) the better suitability of the technique for research in the social sciences (economics, business organization, marketing, etc.); (b) the absence of strict requirements on the distribution of the data; and (c) the possibility of using composite variables. The measurement model used in this study is composite and reflective (Mode A). This makes the use of traditional PLS viable (Sarstedt et al., 2016 ). We have used PLS SmartPLS 3.2.8 software (Ringle et al., 2015 ).
The use of a single questionnaire in a self-report format to obtain the data of the latent variables made it necessary to verify the existence of common variance between them. All the experts’ suggestions (Huber and Power, 1985 ; Podsakoff et al., 2003 ) on the procedural steps regarding the design of questionnaires have been followed. The different measures used were separated and, on the other hand, the anonymity of the respondents was guaranteed. The Harman test (1967) has been used to detect the existence of common influence in the responses. The results of the exploratory factor analysis show that the 40 elements of the questionnaire are grouped into a total of 12 factors, where the largest of them explains 17% of the variance. This allows us to confirm the absence of a common factor of influence between these items (Podsakoff and Organ, 1986).
The latent model perspective (MacKenzie & Royle, 2005 ; Real et al., 2006 ) was used when analyzing the relations between the different constructs of the model and its factors. And, as in any model of structural equations, both the measurement model and the structural model were validated (See table A in the appendix that includes the correlation matrix between the items of the model).
4 Results and Discussion
4.1 measurement model.
Table 2 collects both the mean and standard deviation of each element and the data necessary to begin with the validation of the measurement model: determine the reliability of the individual items. We have measured all latent variables (constructs) in mode A (reflective). It is observed that the factor loads of most of the items exceed the minimum criterion of 0.707 (Carmines and Zeller, 1979), only two elements with lower values have been maintained, although very close (0.68). These items have been taking into account after checking their level of significance via bootstrapping (5000 subsamples) and according to the suggestions made by Hair et al. ( 2017 ). 25 items of a total of 40 were removed from the original questionnaire.
The reliability of the constructs was evaluated using the composite reliability index (ρ c ) (Werts et al., 1974 ). In all cases, we observe the fulfillment of the minimum requirement: a composite reliability greater than 0.7 (Nunnally, 1978 ). Regarding convergent validity, as Table 1 illustrates, all latent variables exceed the minimum level of 0.5 (Fornell and Larcker, 1981 ) in the AVE.
The analysis of the discriminant validity of the various constructs (latent variables) has been performed based on the Fornell-Larcker criterion. The data is collected in Table 3 . The Fornell-Larcker criterion is strictly followed in all cases. This allows us to affirm the discriminant validity between the latent variables and their way of measuring them.
After validating the measurement model, the structural model can be validated.
4.2 Structural Model
Following the indications of Roldán and Cepeda ( 2018 ), the study of the structural model must begin with the analysis of the sign, size and significance of the path coefficients, the R 2 values and the Q 2 test. According to Hair et al. ( 2017 ), we have used the bootstrapping technique with 5000 samples, to determine the t statistics and the confidence intervals and, in this way, obtain the significance of the relations. Table 4 offers the direct effects (path coefficients), the value of the t statistic, the corresponding confidence intervals and the verification of proposed hypotheses validity, along with the values of R 2 and Q 2 .
Not all direct effects are significant and positive and, therefore, the data do not indicate a widespread validity for the hypotheses proposed. 2 relations of a total of 3 are significant, but with an opposite sign to proposed one: the effect of the attitude towards the development of Sustainable Tourism on the intention to choose is negative, the same as the positive impact on the tourist motivation. Another invalid hypothesis regarding the effect of the attitude towards Sustainable Tourism on the tourist motivation is also contrary to the proposed one; although, in this case, it has no statistical significance.
The R 2 values only offer an appropriate predictive level for the variable attitude towards Sustainable Tourism development and a moderate level for the perceived service quality. The final variable intention to choose a sustainable tourist destination does not reach significant predictive levels. Besides, the Q 2 values indicate a certain level of predictive relevance of the model, since they all are greater than 0, although some of them are quite low.
In our model, we have also intended to verify whether there are mediation relations concerning the various endogenous variables included in the model. The results on mediation appear in Table 5 , where the values of all the indirect effects presented in the model are collected. The results indicate the presence of significant and positive indirect effects in total only in the case of the following relations: between the effect of the attitude towards the development of Sustainable Tourism and the intention to select a sustainable tourist destination, and between global positive impacts and the attitude towards the development of Sustainable Tourism. The model and its results are presented graphically in Fig. 2 .
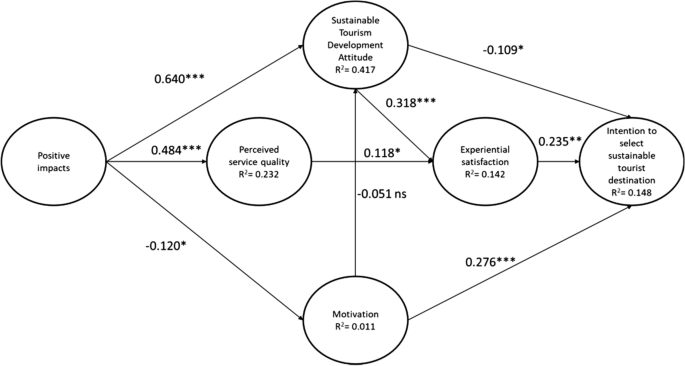
Structural model: results and relations. Source Own elaboration
Once the reliability of the different items and the validity of the proposed models have been verified, we observe an absence of unanimity in the confirmation of the hypotheses proposed. Thus, in this case, the results do not match with the statements provided by some authors such as Crouch and Ritchie ( 1999 ), Lit et al. (2010) or Mohaidin et al. ( 2017 ), who confirm that the positive impacts provided by Sustainable Tourism could be a motivation for the destination. Similarly, nor does the study confirm that favorable attitudes towards the development of Sustainable Tourism positively influence on the intention to select sustainable tourist destinations, as authors such as Ventakesh ( 2006 ) or Mohaidin et al. ( 2017 ) concluded in their studys. On the other hand, although numerous studies consider the tourist motivation as a driver of their future behavior and as a positive effect trigger on the intention of visiting certain destinations, in addition to as a favorable attitude related to development of Sustainable Tourism (e.g. Huang & Liu, 2017 ), these theories are not also confirmed in this case.
The rest of the hypotheses raised in this study, related to perceived service quality, satisfaction or intention to choose sustainable tourist destinations, provide results that confirm previous studies on this topic and the relations proposed in this study.
5 Conclusions, Limitations and Future Research
5.1 conclusions.
Sustainable Tourism can become a solution to the crisis caused by COVID-19. This type of tourism promotes “greener” destinations, conceiving this term not only as ecological, but also as healthy. Therefore, the current mass many of the main tourist destinations face up today seems to stop happening soon or have to evolute to a sustainable mass tourism that combines the emergence of sustainability as a societal norm with the entrenched norm of support for growth (Weaver, 2012 ).
The different governments on spaces for coexistence not because of a greater environmental awareness instilled in tourists, but because of the obligations impose this fact and, on the other hand, because of the new requirements in terms of security tourists will impose on themselves when traveling and choosing a destination. Curiously, this crisis is going to force a change in Sustainable Tourism this summer 2020 in Spain. Once the confinement is finished, only internal tourism will be able to be developed. This adaptation will help overcome old problems: the exclusivity of “sun and sand” tourism will be faced to the fear of crowds, so that the occupation of inland destinations will increase, revitalizing unpopulated areas.
Therefore, the COVID-19 crisis should indirectly boost the long-awaited Sustainable Tourism, so necessary for environmental conservation and recovery. This type of tourism will finally have the long-expected opportunity (Petrizzo, 2020 ). This is the perfect time of the positioning of a sustainable Spanish tourism brand focused on its pre-existing competitive advantages. Furthermore, although the intention of many previous studies was demonstrating the importance of Sustainable Tourism (e. g. Chi-Ming et al., 2017 ; Ekanayake & Long, 2012 ; Fernández, 2018 ; Hussain, et al., 2015 ; Mohaidin et al., 2017 ; Vargas, 2007 ; Pavlić et al., 2017 ; Su & Chang, 2017 ), it does not succeed in establishing firmly in the tourist motivation, as this study reflects. However, the study confirms that tourists consider the Sustainable Tourism positive factors as important and manifest a favorable attitude towards its develop, particularly in the intention of selecting this destination type.
Based on the structural model proposed in this article and the results provided by its analysis, we see how the intention to select sustainable touristic destinations is supported by motivation (H9) and by the tourists’ satisfaction of developing favorable attitudes towards Sustainable Tourism (H8). Likewise, a positive and significant relationship of the tourist’s attitude towards the development of Sustainable Tourism is observed, fostered by the generic positive impact that it entails (H1). Respect to the tourist’ satisfaction experienced when consuming Sustainable Tourism, this is generated by the tourist’ attitude to develop Sustainable Tourism (H7) and by the service quality perceived on it (H6). This perceived service quality is caused by the generic positive impacts resulting from the development of Sustainable Tourism (H2). The rest of the relations established in the model (H3, H4 and H5) do not find statistical support in the results obtained.
Delving into the current approach of the Spanish tourism industry, the prospects noticed are dramatic, since this industry has a vital importance in the country, becoming the main axis of the national economic strength. Therefore, tourism experts and academics have the duty of find solutions to the crisis caused by the coronavirus. For this reason, we consider that promoting less crowded destinations and, ultimately, fostering Sustainable Tourism may be one of the solutions to this unprecedented crisis.
In summary, Sustainable Tourism can build on the momentum provided by this context of health crisis to increase a favorable attitude towards Sustainable Tourism development. Achieving this attitude will allow an increase in the tourist´s awareness, translated as the tourist´s perception of the positive impact and the satisfaction experienced with the consumption of this tourism type. The contributions that this work provides are several. In general, it highlights the convenience for Sustainable Tourism at present. It summarizes the constructs involved in the tourist's perception of Sustainable Tourism, contrary to other research focused on certain types of Sustainable Tourism. Specifically, our research model covers a total of 9 hypothesis with a new combination of constructs, in comparison to other publications with the same topic.
Public Institutions, in addition to managing the restrictions in the different territories, should also have the responsibility of developing policies for saving the tourism sector from the current crisis. Since Sustainable Tourism (as analyzed here) can help to promote tourist movements, it is the responsibility of Public Institutions to promote them. Therefore, it is important to determine the factors motivating tourists to engage in Sustainable Tourism, so that Public Institutions can also encourage its development, carrying out policies focused on the promotion and encouragement of this type of tourism.
The main contribution of this study is not theoretical (since there is a lot of literature based on this approach). The main contribution lies in extracting all the positive aspects that sustainable tourism brings to tourism development and highlighting its value in these times of crisis that this industry is going through.
5.2 Limitations
However, the main limitation we find in the present study is that the study was carried out prior to the crisis caused by COVID-19, therefore, aspects such as changes in attitudes, motivations and perceptions related to and caused by this new situation were not considered at any time. However, the study focused on analyzing the importance of Sustainable Tourism from a tourist perception approach. Without doubt, this relevance will be driven by this new situation. The second limitation derives from the non-probabilistic character of the sample, as the results obtained cannot be generalized; they do not guarantee a representation of the whole population, so that, it can be accepted a level of subjectivity.
In short, it is necessary to find formulas that boost the tourism industry. The development of Sustainable Tourism can help to mitigate the tourists’ perceived fear of visiting destinations with a large concentration of people. Therefore, can this crisis be the last great opportunity for the development of Sustainable Tourism?
5.3 Future Research
It would be very convenient to replicate this study in the future, when total mobility within the national territory begins to be allowed and the circulation of tourists is allowed internationally. Thus, for example, an aspect that was not supported in the present study is the importance of positive impacts a destination could have did not suppose a motivation for its choice. Thanks to the different government campaigns that are being recently launched with the aim of achieving positive impacts from visiting certain destinations, we think that this aspect could change due to the increased sensitivity perceived by the tourist.
ACSI (2016). www.theacsi.org/about-acsi/the-science-of-customer-satisfaction , last accessed (23/02/2017).
Andereck, K. L., & Vogt, C. A. (2000). The relationship between residents´attitudes toward tourism and tourism development options. Journal of Travel Research., 39 (1), 27–36.
Google Scholar
Baker, D. A., & Crompton, J. L. (2000). Quality satisfaction and behaviour intention. Annals of Tourism Research., 27 (3), 785–804.
Beeho, A. J., & Prentice, R. (1997). Conceptualizing the experiences of heritage tourists: a case study of new Lanark world heritage village. Tourism Management., 18 (2), 75–87.
Beerli, A., & Martin, J. D. (2004). Factors influencing destination image. Annals of Tourism Research., 31 (5), 657–681.
Belisle, F. J., & Hoy, D. R. (1980). The perceived impact of tourism by residents: a case study in Santa Marta. Columbia. Annals of Tourism Research., 7 , 83–101.
Besculides, A., Lee, M., & McCormick, P. (2002). Residents’ perceptions of the cultural benefits of tourism. Annals of Tourism Research, 29 , 303–319.
Byrd, E., Cardenan, D., & Dregallas, S. (2009). Differences in stakeholder attitudes of tourism development and the natural environment. E-Review of Tourism Research., 7 (2), 72–81.
Caneen, J. M. (2003). Cultural determinants of tourism intention to return. Tourism Analysis., 8 , 237–242.
Castillo Canalejo, A.M., & Jimber del Río, J.A., (2018). Quality, satisfaction and loyalty índices. Journal of Place Management and Development .
Chang, C. L., McAleer, M., & Ramos, V. (2020). A charter for sustainable tourism after COVID-19. Sustainability, 12 , 3671.
Chang, N. J., & Fong, C. M. (2010). Green product quality, green corporate image, green customer satisfaction and green customer loyalty. African Journal of Business Management., 4 (13), 2836–2844.
Chang, K.-C., Kuo, N. T., Hsu, C. L., & Cheng, Y.-S. (2014). The impact of website quality and perceived trust on customer purchase intention in the hotel sector: Website brand and perceived value as moderators. International Journal of Innovation, Management and Technology , 5 , 255–260.
Chien, C., Law, F., Lo, M., & Ramayah, T. (2018). The impact of accessibility quality and accommodation quality on tourists’ satisfaction and revisit intention to rural tourism destination in sarawak: the moderating role of local communities’ attitude. Global Business and Management Research., 10 (2), 115–127.
Chiu, W., Zeng, S., & Cheng, P. (2016). The influence of destination image, tourist satisfaction and destination loyalty: a case study of Chinese tourists in Korea. International Journal of Culture, Tourism and Hospitality Research., 10 (2), 223–234.
Chi-Ming, H., Chang, H., & Sung Hee, P. A. (2017). study of two stakeholders’ attitudes toward sustainable tourism development: A comparison model of Penghu Island in Taiwan. Pacific Journal Business Research , 8 , 2–28.
Ciacci, A., Ivaldi, E., Mangano, S., & Ugolini, G. (2021). Environment, logistics and infrastructure: the three spheres of influence of Italian coastal tourism. Journal of Sustainable Tourism . https://doi.org/10.1080/09669582.2021.1876715
Article Google Scholar
ComiSión Mundial Del Medio Ambiente Y Del Desarrollo (CMMAD) (1992): Nuestro futuro común, Madrid, Alianza Editorial.
Cotrell, S., Duim, R., Ankersmid, P., & Kelder, L. (2004). Measuring the sustainability of tourism in manuel antonio and texel: a tourist perspective. Journal of Sustainable Tourism., 12 (5), 409–431.
Crosby, A. (1996). Elementos básicos para un Turismo Sostenible en las áreas naturales . Centro Europeo de Formación Ambiental y Turística.
Crouch, G. I., & Ritchie, J. R. B. (1999). Tourism competitiveness, and societal prosperity. Journal of Business Research., 44 , 137–152.
Davis, D., Allen, J., & Cosenza, R. M. (1988). Segmenting local residents by their attitudes, interests, and opinions toward tourism. Journal of Travel Research., 27 , 2–8.
Díaz, R., & Gutiérrez, D. (2010). La actitud del residente en el destino turístico de Tenerife: Evaluación y tendencia. PASOS, Revista De Turismo y Patrimonio Cultural, 8 (4), 431–444.
Dimitriades, Z. S. (2006). Customer satisfaction loyalty and commitment in service organizations. Management Research News., 29 (12), 782–800.
Ekanayake, E., & Long, A. E. (2012). Tourism development and economic growth in developing countries. The International Journal of Business and Finance Research., 6 (1), 61–63.
Esman, M. (1984). Tourism as ethnic preservation: The Cajuns of Louisiana. Annals of Tourism Research., 11 , 451–467.
Fernández Poncela, A. M. (2018). Turismo, negocio o desarrollo: El caso de Huasca. México. PASOS, 16 (1), 233–251.
Fornell, C., & Larcker, D. F. (1981). Evaluating structural equation models with unobservable variables and measurement error. Journal of Marketing Research , 18 (1), 39–50.
Gee, C. Y., Mackens, J. C., & Choy, D. J. (1989). The Travel Industry . Van Nostrand Reinhold.
Gössling, S., Scott, D., & Hall, M. (2020). Pandemics, tourism and global change: A rapid assessment of COVID-19. Journal of Sustainable Tourism . https://doi.org/10.1080/09669582.2020.1758708
Gunn, C. A. (1988). Tourism Planning . Taylor and Francis.
Gursoy, D., & Jurowski, C., (2000). Resident attitudes in relation to distance from tourist attractions. Travel and Tourism Research Association, http://www.ttra.com
Gursoy, D., Jurowski, C., & Uysal, M. (2002). Resident attitudes: A structural modeling approach. Annals of Tourism Research., 29 (1), 79–105.
Gursoy, D., Ouyang, Z., Nunkoo, R., & Wei, W. (2018). Residents’ impact perceptions of and attitudes towards tourism development: a metaanalysis. Journal of Hospitality Marketing & Management , 28 , 1–28.
Hair, J. F., Hollingsworth, C. L., Randolph, A. B., & Chong, A. Y. L. (2017). An updated and expanded assessment of PLS-SEM in information systems research. Industrial Management & Data Systems , 117 (3), 442–458.
Hallowell, R. (1996). The relationship of customer satisfaction, customer loyalty, profitability: An empirical study. International Journal of Service Industry Management., 7 (4), 27–42.
Hancock, A. (2020). Grounded flights force Tui to cut staff hours and wages. Financial Times. Online. https://www.ft.com/content/85a8d648-6a07-11ea-800d-da70cff6e4d3 .
Harrison, D. (1992). Tourism to less developed countries: The social consequences in tourism and less developed countries . Bellhaven.
Higgins-Desbiolles, F. (2020). Socialising tourism for social and ecological justice after COVID-19. Tourism Geographies . https://doi.org/10.1080/14616688.2020.1757748
Higgins-Desbiolles, F., Carnicelli, S., Krolikowski, C., Wijesinghe, G., & Boluk, K. (2019). Degrowing tourism: Rethinking tourism. Journal of Sustainable Tourism., 27 (12), 1926–1944. https://doi.org/10.1080/09669582.2019.1601732
Hsu, C., & Huang, S. (2009). Effects of travel motivation, past experience, perceived constraint, and attitude on revisit intention. Journal of Travel Research , 48 , 29–44.
Huang, Y., & Liu, C. S. (2017). Moderating and mediating roles of environmental concern and ecotourism experience for revisit intention. International Journal of Contemporary Hospitality Management., 29 (7), 1854–1872.
Hunter, L. M. (2000). A comparison of the environmental attitudes, concern, and behaviors of native-born and foreign-born US residents. Population and Environment., 21 (6), 565–580.
Hussain, K., Ali, F., Ari Ragavan, N., & Singh Manhas, P. (2015). Sustainable Tourism and resident satisfaction at Jammu and Kashmir India. Worldwide Hospitality and Tourism Themes., 7 (5), 486–499.
INE (2019): https://www.ine.es/
Jensen, J. M. (2015). The relationships between socio-demographic variables, travel motivations and subsequent choice of vacation. Advances in Economics and Business., 3 (8), 322–328.
Jurdana, D.S., & Frleta, D.S. (2012). Sustainable rural tourism development – tourists´satisfaction with Istria as a rural holiday destination. Faculty of Tourism and Hospitality Management in Opatija.Biennial International Congress. Tourism and Hospitality Industry, pp. 51–59.
Jurowski, C., Uysal, M., & Williamd, R. D. (1997). A theoretical analysis of host community resident reactions to tourism. Journal of Travel Research, 36 (2), 3–11.
Jurowski, C., & Gursoy, D. (2004). Distance effects on residents’ attitudes toward tourism. Annals of Tourism Research, 31 (2), 296–312.
Kao, Y. F., Huang, L. S., & Wu, C. H. (2008). Effects of theatrical elements on experiential quality and loyalty intentions for theme parks. Asia Pacific Journal of Tourism Research., 13 (2), 163–174.
Keogh, B. (1990). Resident and recreationists’ perceptions and attitudes with respect to tourism development. Journal of Applied Recreation Research., 15 (2), 71–83.
Kim, K., Oh, I., & Jogaratnam, G. (2007). College student travel: A revised model of push motives. Journal of Vacation Marketing , 13 (1), 73–85.
Lankford, S. V., & Howard, D. R. (1994). Developing a tourism attitude impact scale. Annals of Tourism Research, 21 , 121–139.
Li, M., Cai, L. A., Lehto, X. Y., & Huang, J. (2010). A missing link in understanding revisit intention-the role of motivation and image. Journal of Travel and Tourism Marketing., 27 (4), 335–348.
Liu, J. C., Sheldon, P. J., & Var, T. (1987). Residents perceptions of the environmental impacts of tourism. Annals of Tourism Research, 14 , 17–37.
Luo, Y., & Deng, J. (2008). The new environmental paradigm and nature-based tourism motivation. Journal of Travel Research., 46 (4), 392–402.
MacKenzie, D., & Royle, A. (2005). Designing occupancy studies: general advice and allocating survey effort. Methodological Insights , 42 (6), 1105–1114.
Mathieson, A., & Wall, G. (1982). Tourism: Economic, Physical, and Social Impacts . Longman House.
Michael, J.M., (2013). Power Hand Tool customers´ Determination of Service Quality and Satisfaction in Repair/return Process. Dissertation at Campella University; Ann Arbor: PreQuest LLC.
Miller, D., Merrilees, B., & Coughlan, A. (2014). Sustainable urban tourism: Understanding and developing pro-environmental behaviours. Journal of Sustainable Tourism., 23 (1), 26–46.
Mohaidin, Z., Tze Wei, K., & Ali Murshi, M. (2017). Factors influencing the tourists´ intention to select Sustainable Tourism destination: A case study of Penang Malaysia. International Journal of Tourism Cities, 3 (4), 442–465.
Murphy, P. E. (1983). Community attitudes to tourism. Tourism Management, 2 , 189–195.
Murphy, P. E. (1985). Tourism: A Community Approach . Routledge.
Nunnally, J. C. (1978). Psychometric theory (2nd ed.). New York: McGraw-Hill.
Nunkoo, R., & So, K.K.F., (2015). Residents’ support for tourism: Testing alternative structural models. Journal of Travel Research .
Ohn, P., & Supinit, V. (2016). Factors influencing tourist loyalty of international graduate students: A study on tourist destination in Pattaya Thailand. International Journal of Thesis Projects and Dissertations, 4 (1), 45–55.
Oliver, R. L. (1980). A cognitive model of the antecedents and consequences of satisfaction decisions. Journal of Marketing Research., 17 (4), 460–469.
Oliver, R. L. (1997). Satisfaction: A behavioral perspective on the consumer . New York: The McGraw-Hill Companies Inc.
OMT. (2005). Indicadores de Desarrollo Sostenible para los destinos turísticos - Guía práctica . Organización Mundial del Turismo.
Othman, N., Anwar, N. A. M., & Kian, L. L. (2010). Sustainability analysis: Visitors impact on taman negara. Journal of Tourism, Hospitality and Culinary Arts, 2 (1), 67–79.
Palacios-Florencio, B., García del Junco, J., Castellanos-Verdugo, M., & Rosa-Díaz, I. M. (2018). Trust as mediator of corporate social responsibility, image and loyalty in the hotel sector. Journal of Sustainable Tourism, 26 (7), 1273–1289. https://doi.org/10.1080/09669582.2018.1447944
Pavlić, I., Portolan, A., & Puh, B. (2017). Supported current tourism development in UNESCO protected site: The case of old city of dubrovnik. Economies , 5 , 9.
Pesonen, J., Raija, K., Kronenberg, C., & Peters, M. (2011). Understanding the relationship between push and pull motivations in rural torurism. Tourism Review, 66 (3), 32–49.
Pizam, A. (1978). Tourism’s impacts: The social costs to the destination community as perceived by its residents. Journal of Travel Research, 16 (4), 8–12.
Pizam, A. (1994). Monitoring customer satisfaction. Food and Beverage Management: A selection of Readings, Bertrand, D. and Andrew L. (Eds). Butterworth-Heineman. Oxford, 231–247.
Podsakoff, P., MacKenzie, S., Lee, J. Y., & Podsakoff, N. (2003). Common method biases in behavioral research: A critical review of the literature and recommended remedies. Journal of Applied Psychology , 88 , 879–903.
Prebensen, N. K. (2006). Segmenting the group tourist heading for warmer weather—a Norwegian example. Journal of Travel and Tourism Marketing, 19 (4), 27–40.
Pretizzo Páez, M. A. (2020). El impacto de la COVID-19 en el sector turismo, academia.edu, 1–10-
Real, J. C., Leal, A., & Roldán, J. L. (2006). Information technology as a determinant of organizational learning and technological distinctive competencias. Industrial Marketing Management , 35 (4), 505–521.
Ringle, C. M., Wende, S., & Becker, J.-M. (2015). SmartPLS 3 . Boenningstedt: SmartPLS GmbH.
Ritchie, J. R. B. (1988). Consensus policy formulation in tourism. Tourism Management, 9 , 199–216.
Roldán, J. L., & Cepeda, G. (2018). Curso sobre PLS-SEM, 6ª edición . Universidad de Sevilla.
Roldán, J. L., & Sanchez-Franco, M. J., (2012). Variance-based structural equation modeling. In M. Mora, et al. (Eds.), Research methodologies, innovations and philosophies in software systems engineering and information systems (pp. 193–221). USA: IGI Global.
Rothman, R. A. (1978). Residents and transients: community reaction to seasonal visitors. Journal of Travel Research, 16 (3), 8–13.
Ruhanen, L., Weiler, B., Moyle, B., & Moyle, C. (2015). Trends and patterns in sustainable tourism research: A 25-year bibliometric analysis. Journal of Sustainable Tourism , 23 , 517–535.
Santana-Jiménez, Y., & Hernández, J. M. (2011). Estimating the effect of overcrowding on tourist attraction: The case of Canary Islands. Tourism Management, 32 (2), 415–425.
Sarstedt, M., Hair, J. F., Ringle, C. M., Thiele, K. O., & Gudergan, S. P. (2016). Estimation issues with PLS and CBSEM: Where the bias lies. Journal of Business Research , 69 (10), 3998–4010.
Sethna, R., & Richmond, B. (1978). US Virgin islanders’ perceptions of tourism. Journal of Travel Research, 17 (1), 30–37.
Sharpley, R. (2020). Tourism, sustainable development and the theoretical divide: 20 years on. Journal of Sustainable Tourism, 28 (11), 1932–1946.
Sheldon, P. J., & Var, T. (1984). Resident attitudes to tourism in north wales. Tourism Management, 5 , 40–47.
Stylidis, D., Biran, A., Sit, J., & Szivas, E. (2014). Residents' support for tourism development: The role of residents' place image and perceived tourism impacts. Tourism Management , 45 , 260–274.
Su, W.-S., & Chang, L.-F. (2017). Developing sustainable tourism attitude in Taiwanese residents. The International Journal of Organizational Innovation, 10 (1), 275–289.
Sung, Y.-H., Su, C.-S., & Chang, W.-C. (2016). The quality and value of Hualien´s harvest festival. Annals of Tourism Research, 56 , 128–163.
Tosun, C. (2002). Host perceptions of impacts: A comparative tourism study. Annals of Tourism Research, 29 , 231–245.
Tyrell, T. J., & Spaulding, I. A. (1984). A survey of attitudes toward tourism growth in Rhode Island. Hospitality Education and Research Journal, 8 (2), 22–33.
Var, T., Kendall, K. W., & Tarakcoglu, E. (1985). Residents attitudes toward tourists in a Turkish Resort Town. Annals of Tourism Research, 12 , 652–658.
Vargas, A. et. al., (2007). Desarrollo del turismo y percepción de la comunidad local: factores determinantes de su actitud hacia un mayor desarrollo turístico. XXI Congreso Anual AEDEM, Universidad Rey Juan Carlos, Madrid, 6,7, y 8 de junio de 2007/Vol.1, pág. 24, coord. por Carmelo Mercado Idoeta.
Venkatesh, U. (2006). Leisure meaning and impact on leisure travel behaviour. Journal of Service Research, 6 (1), 87–108.
Walls, A., Okumus, F., Wang, Y., & Kwun, D. J. (2011). Understanding the consumer experience: An exploratory study of luxury hotels. Journal of Hospitality Marketing and Management, 20 (2), 166–197.
Weaver, D. B. (2012). Organic, incremental and induced paths to sustainable mass tourism convergence. Tourism Management., 33 (5), 1030–1037.
Werts, C., Linn, R., & Joreskog, K. (1974). Intraclass reliability estimates: Testing structural assumptions. Educational and Psychological Measurement , 34 , 25–33.
Wong, B. K., Ghazali, M., & Azni, Z. T. (2017). Malaysia my second home: The influence of push and pull motivations on satisfaction. Tourism Management, 61 , 394–410.
World Travel and Tourism Council, (2019). https://wttc.org/en-gb/
World Health Organization (2020): https://www.who.int/emergencies/diseases/novel-coronavirus-2019/advice-for-public
Wu, H.-C., & Li, T. (2015). An empirical study of the effects of service quality, visitor satisfaction, and emotions on behavioral intentions of visitors to the museums of macau. Journal of Quality Assurance in Hospitality & Tourism , 16 (1), 80–102.
Wu, H.-C., Ai, C.-H., & Cheng, C.-C. (2016). Synthesizing the effects of green experiential quality, green equity, green image and green experiential satisfaction on green switching intention. International Journal of Contemporary Hospitality Management, 28 (9), 2080–2107.
Xu, J., & Shukman, C. (2016). A new nature-based tourism motivation model: Testing the moderating effects of the push motivation. Tourism Management Perspectives, 18 , 107–110.
Yoon, Y., & Uysal, M. (2005). An examination of the effects of motivation and satisfaction on destination loyalty: A strucutural model. Tourism Management, 26 (1), 45–56.
Zhang, H., & Lei, S. L. (2012). A structural model of residents’ intention to participate in ecotourism: The case of a wetland community. Tourism Management, 33 (4), 916–925.
Download references
Author information
Authors and affiliations.
Department of Business Organization and Marketing, Faculty of Business Studies, University of Pablo de Olavide, Carretera Utrera, Km.1, 41013, Seville, Spain
Beatriz Palacios-Florencio & Juan Manuel Berbel-Pineda
Department of Business Organization, Faculty of Law and Business, University of Córdoba, Puerta Nueva s.n., 14071, Córdoba, Spain
Luna Santos-Roldán & Ana María Castillo-Canalejo
You can also search for this author in PubMed Google Scholar
Corresponding author
Correspondence to Beatriz Palacios-Florencio .
Additional information
Publisher's note.
Springer Nature remains neutral with regard to jurisdictional claims in published maps and institutional affiliations.
Supplementary Information
Below is the link to the electronic supplementary material.
Supplementary file1 (DOCX 18 KB)
Rights and permissions.
Reprints and permissions
About this article
Palacios-Florencio, B., Santos-Roldán, L., Berbel-Pineda, J.M. et al. Sustainable Tourism as a Driving force of the Tourism Industry in a Post-Covid-19 Scenario. Soc Indic Res 158 , 991–1011 (2021). https://doi.org/10.1007/s11205-021-02735-2
Download citation
Accepted : 04 June 2021
Published : 12 June 2021
Issue Date : December 2021
DOI : https://doi.org/10.1007/s11205-021-02735-2
Share this article
Anyone you share the following link with will be able to read this content:
Sorry, a shareable link is not currently available for this article.
Provided by the Springer Nature SharedIt content-sharing initiative
- Sustainable tourism
- Mass tourism
- Overcrowded destinations
- Tourism crisis
- Sustainable Tourism development
- Find a journal
- Publish with us
- Track your research
UN Tourism | Bringing the world closer
Share this content.
- Share this article on facebook
- Share this article on twitter
- Share this article on linkedin
Tourism in the 2030 Agenda
The year 2015 has been a milestone for global development as governments have adopted the 2030 Agenda for Sustainable Development, along with the Sustainable Development Goals (SDGs). The bold agenda sets out a global framework to end extreme poverty, fight inequality and injustice, and fix climate change until 2030. Building on the historic Millennium Development Goals (MDGs), the ambitious set of 17 Sustainable Development Goals and 169 associated targets is people-centred, transformative, universal and integrated.

Harnessing tourism's benefits will be critical to achieving the sustainable development goals and implementing the post-2015 development agenda
Tourism has the potential to contribute, directly or indirectly, to all of the goals. In particular, it has been included as targets in Goals 8, 12 and 14 on inclusive and sustainable economic growth, sustainable consumption and production (SCP) and the sustainable use of oceans and marine resources, respectively.
Sustainable tourism is firmly positioned in the 2030 Agenda. Achieving this agenda, however, requires a clear implementation framework, adequate financing and investment in technology, infrastructure and human resources.

GOAL 1: NO POVERTY

GOAL 2: ZERO HUNGER

GOAL 3: GOOD HEALTH AND WELL-BEING

GOAL 4: QUALITY EDUCATION

GOAL 5: GENDER EQUALITY

GOAL 6: CLEAN WATER AND SANITATION

GOAL 7: AFFORDABLE AND CLEAN ENERGY

GOAL 8: DECENT WORK AND ECONOMIC GROWTH

GOAL 9: INDUSTRY, INNOVATION AND INFRASTRUCTURE

GOAL 10: REDUCED INEQUALITIES

GOAL 11: SUSTAINABLE CITIES AND COMMUNITIES

GOAL 12: RESPONSIBLE CONSUMPTION AND PRODUCTION

GOAL 13: CLIMATE ACTION

GOAL 14: LIFE BELOW WATER

GOAL 15: LIFE ON LAND

GOAL 16: PEACE AND JUSTICE

GOAL 17: PARTNERSHIPS FOR THE GOALS

The future of tourism: Bridging the labor gap, enhancing customer experience
As travel resumes and builds momentum, it’s becoming clear that tourism is resilient—there is an enduring desire to travel. Against all odds, international tourism rebounded in 2022: visitor numbers to Europe and the Middle East climbed to around 80 percent of 2019 levels, and the Americas recovered about 65 percent of prepandemic visitors 1 “Tourism set to return to pre-pandemic levels in some regions in 2023,” United Nations World Tourism Organization (UNWTO), January 17, 2023. —a number made more significant because it was reached without travelers from China, which had the world’s largest outbound travel market before the pandemic. 2 “ Outlook for China tourism 2023: Light at the end of the tunnel ,” McKinsey, May 9, 2023.
Recovery and growth are likely to continue. According to estimates from the World Tourism Organization (UNWTO) for 2023, international tourist arrivals could reach 80 to 95 percent of prepandemic levels depending on the extent of the economic slowdown, travel recovery in Asia–Pacific, and geopolitical tensions, among other factors. 3 “Tourism set to return to pre-pandemic levels in some regions in 2023,” United Nations World Tourism Organization (UNWTO), January 17, 2023. Similarly, the World Travel & Tourism Council (WTTC) forecasts that by the end of 2023, nearly half of the 185 countries in which the organization conducts research will have either recovered to prepandemic levels or be within 95 percent of full recovery. 4 “Global travel and tourism catapults into 2023 says WTTC,” World Travel & Tourism Council (WTTC), April 26, 2023.
Longer-term forecasts also point to optimism for the decade ahead. Travel and tourism GDP is predicted to grow, on average, at 5.8 percent a year between 2022 and 2032, outpacing the growth of the overall economy at an expected 2.7 percent a year. 5 Travel & Tourism economic impact 2022 , WTTC, August 2022.
So, is it all systems go for travel and tourism? Not really. The industry continues to face a prolonged and widespread labor shortage. After losing 62 million travel and tourism jobs in 2020, labor supply and demand remain out of balance. 6 “WTTC research reveals Travel & Tourism’s slow recovery is hitting jobs and growth worldwide,” World Travel & Tourism Council, October 6, 2021. Today, in the European Union, 11 percent of tourism jobs are likely to go unfilled; in the United States, that figure is 7 percent. 7 Travel & Tourism economic impact 2022 : Staff shortages, WTTC, August 2022.
There has been an exodus of tourism staff, particularly from customer-facing roles, to other sectors, and there is no sign that the industry will be able to bring all these people back. 8 Travel & Tourism economic impact 2022 : Staff shortages, WTTC, August 2022. Hotels, restaurants, cruises, airports, and airlines face staff shortages that can translate into operational, reputational, and financial difficulties. If unaddressed, these shortages may constrain the industry’s growth trajectory.
The current labor shortage may have its roots in factors related to the nature of work in the industry. Chronic workplace challenges, coupled with the effects of COVID-19, have culminated in an industry struggling to rebuild its workforce. Generally, tourism-related jobs are largely informal, partly due to high seasonality and weak regulation. And conditions such as excessively long working hours, low wages, a high turnover rate, and a lack of social protection tend to be most pronounced in an informal economy. Additionally, shift work, night work, and temporary or part-time employment are common in tourism.
The industry may need to revisit some fundamentals to build a far more sustainable future: either make the industry more attractive to talent (and put conditions in place to retain staff for longer periods) or improve products, services, and processes so that they complement existing staffing needs or solve existing pain points.
One solution could be to build a workforce with the mix of digital and interpersonal skills needed to keep up with travelers’ fast-changing requirements. The industry could make the most of available technology to provide customers with a digitally enhanced experience, resolve staff shortages, and improve working conditions.
Would you like to learn more about our Travel, Logistics & Infrastructure Practice ?
Complementing concierges with chatbots.
The pace of technological change has redefined customer expectations. Technology-driven services are often at customers’ fingertips, with no queues or waiting times. By contrast, the airport and airline disruption widely reported in the press over the summer of 2022 points to customers not receiving this same level of digital innovation when traveling.
Imagine the following travel experience: it’s 2035 and you start your long-awaited honeymoon to a tropical island. A virtual tour operator and a destination travel specialist booked your trip for you; you connected via videoconference to make your plans. Your itinerary was chosen with the support of generative AI , which analyzed your preferences, recommended personalized travel packages, and made real-time adjustments based on your feedback.
Before leaving home, you check in online and QR code your luggage. You travel to the airport by self-driving cab. After dropping off your luggage at the self-service counter, you pass through security and the biometric check. You access the premier lounge with the QR code on the airline’s loyalty card and help yourself to a glass of wine and a sandwich. After your flight, a prebooked, self-driving cab takes you to the resort. No need to check in—that was completed online ahead of time (including picking your room and making sure that the hotel’s virtual concierge arranged for red roses and a bottle of champagne to be delivered).
While your luggage is brought to the room by a baggage robot, your personal digital concierge presents the honeymoon itinerary with all the requested bookings. For the romantic dinner on the first night, you order your food via the restaurant app on the table and settle the bill likewise. So far, you’ve had very little human interaction. But at dinner, the sommelier chats with you in person about the wine. The next day, your sightseeing is made easier by the hotel app and digital guide—and you don’t get lost! With the aid of holographic technology, the virtual tour guide brings historical figures to life and takes your sightseeing experience to a whole new level. Then, as arranged, a local citizen meets you and takes you to their home to enjoy a local family dinner. The trip is seamless, there are no holdups or snags.
This scenario features less human interaction than a traditional trip—but it flows smoothly due to the underlying technology. The human interactions that do take place are authentic, meaningful, and add a special touch to the experience. This may be a far-fetched example, but the essence of the scenario is clear: use technology to ease typical travel pain points such as queues, misunderstandings, or misinformation, and elevate the quality of human interaction.
Travel with less human interaction may be considered a disruptive idea, as many travelers rely on and enjoy the human connection, the “service with a smile.” This will always be the case, but perhaps the time is right to think about bringing a digital experience into the mix. The industry may not need to depend exclusively on human beings to serve its customers. Perhaps the future of travel is physical, but digitally enhanced (and with a smile!).
Digital solutions are on the rise and can help bridge the labor gap
Digital innovation is improving customer experience across multiple industries. Car-sharing apps have overcome service-counter waiting times and endless paperwork that travelers traditionally had to cope with when renting a car. The same applies to time-consuming hotel check-in, check-out, and payment processes that can annoy weary customers. These pain points can be removed. For instance, in China, the Huazhu Hotels Group installed self-check-in kiosks that enable guests to check in or out in under 30 seconds. 9 “Huazhu Group targets lifestyle market opportunities,” ChinaTravelNews, May 27, 2021.
Technology meets hospitality
In 2019, Alibaba opened its FlyZoo Hotel in Huangzhou, described as a “290-room ultra-modern boutique, where technology meets hospitality.” 1 “Chinese e-commerce giant Alibaba has a hotel run almost entirely by robots that can serve food and fetch toiletries—take a look inside,” Business Insider, October 21, 2019; “FlyZoo Hotel: The hotel of the future or just more technology hype?,” Hotel Technology News, March 2019. The hotel was the first of its kind that instead of relying on traditional check-in and key card processes, allowed guests to manage reservations and make payments entirely from a mobile app, to check-in using self-service kiosks, and enter their rooms using facial-recognition technology.
The hotel is run almost entirely by robots that serve food and fetch toiletries and other sundries as needed. Each guest room has a voice-activated smart assistant to help guests with a variety of tasks, from adjusting the temperature, lights, curtains, and the TV to playing music and answering simple questions about the hotel and surroundings.
The hotel was developed by the company’s online travel platform, Fliggy, in tandem with Alibaba’s AI Labs and Alibaba Cloud technology with the goal of “leveraging cutting-edge tech to help transform the hospitality industry, one that keeps the sector current with the digital era we’re living in,” according to the company.
Adoption of some digitally enhanced services was accelerated during the pandemic in the quest for safer, contactless solutions. During the Winter Olympics in Beijing, a restaurant designed to keep physical contact to a minimum used a track system on the ceiling to deliver meals directly from the kitchen to the table. 10 “This Beijing Winter Games restaurant uses ceiling-based tracks,” Trendhunter, January 26, 2022. Customers around the world have become familiar with restaurants using apps to display menus, take orders, and accept payment, as well as hotels using robots to deliver luggage and room service (see sidebar “Technology meets hospitality”). Similarly, theme parks, cinemas, stadiums, and concert halls are deploying digital solutions such as facial recognition to optimize entrance control. Shanghai Disneyland, for example, offers annual pass holders the option to choose facial recognition to facilitate park entry. 11 “Facial recognition park entry,” Shanghai Disney Resort website.
Automation and digitization can also free up staff from attending to repetitive functions that could be handled more efficiently via an app and instead reserve the human touch for roles where staff can add the most value. For instance, technology can help customer-facing staff to provide a more personalized service. By accessing data analytics, frontline staff can have guests’ details and preferences at their fingertips. A trainee can become an experienced concierge in a short time, with the help of technology.
Apps and in-room tech: Unused market potential
According to Skift Research calculations, total revenue generated by guest apps and in-room technology in 2019 was approximately $293 million, including proprietary apps by hotel brands as well as third-party vendors. 1 “Hotel tech benchmark: Guest-facing technology 2022,” Skift Research, November 2022. The relatively low market penetration rate of this kind of tech points to around $2.4 billion in untapped revenue potential (exhibit).
Even though guest-facing technology is available—the kind that can facilitate contactless interactions and offer travelers convenience and personalized service—the industry is only beginning to explore its potential. A report by Skift Research shows that the hotel industry, in particular, has not tapped into tech’s potential. Only 11 percent of hotels and 25 percent of hotel rooms worldwide are supported by a hotel app or use in-room technology, and only 3 percent of hotels offer keyless entry. 12 “Hotel tech benchmark: Guest-facing technology 2022,” Skift Research, November 2022. Of the five types of technology examined (guest apps and in-room tech; virtual concierge; guest messaging and chatbots; digital check-in and kiosks; and keyless entry), all have relatively low market-penetration rates (see sidebar “Apps and in-room tech: Unused market potential”).
While apps, digitization, and new technology may be the answer to offering better customer experience, there is also the possibility that tourism may face competition from technological advances, particularly virtual experiences. Museums, attractions, and historical sites can be made interactive and, in some cases, more lifelike, through AR/VR technology that can enhance the physical travel experience by reconstructing historical places or events.
Up until now, tourism, arguably, was one of a few sectors that could not easily be replaced by tech. It was not possible to replicate the physical experience of traveling to another place. With the emerging metaverse , this might change. Travelers could potentially enjoy an event or experience from their sofa without any logistical snags, and without the commitment to traveling to another country for any length of time. For example, Google offers virtual tours of the Pyramids of Meroë in Sudan via an immersive online experience available in a range of languages. 13 Mariam Khaled Dabboussi, “Step into the Meroë pyramids with Google,” Google, May 17, 2022. And a crypto banking group, The BCB Group, has created a metaverse city that includes representations of some of the most visited destinations in the world, such as the Great Wall of China and the Statue of Liberty. According to BCB, the total cost of flights, transfers, and entry for all these landmarks would come to $7,600—while a virtual trip would cost just over $2. 14 “What impact can the Metaverse have on the travel industry?,” Middle East Economy, July 29, 2022.
The metaverse holds potential for business travel, too—the meeting, incentives, conferences, and exhibitions (MICE) sector in particular. Participants could take part in activities in the same immersive space while connecting from anywhere, dramatically reducing travel, venue, catering, and other costs. 15 “ Tourism in the metaverse: Can travel go virtual? ,” McKinsey, May 4, 2023.
The allure and convenience of such digital experiences make offering seamless, customer-centric travel and tourism in the real world all the more pressing.

Three innovations to solve hotel staffing shortages
Is the future contactless.
Given the advances in technology, and the many digital innovations and applications that already exist, there is potential for businesses across the travel and tourism spectrum to cope with labor shortages while improving customer experience. Process automation and digitization can also add to process efficiency. Taken together, a combination of outsourcing, remote work, and digital solutions can help to retain existing staff and reduce dependency on roles that employers are struggling to fill (exhibit).
Depending on the customer service approach and direct contact need, we estimate that the travel and tourism industry would be able to cope with a structural labor shortage of around 10 to 15 percent in the long run by operating more flexibly and increasing digital and automated efficiency—while offering the remaining staff an improved total work package.
Outsourcing and remote work could also help resolve the labor shortage
While COVID-19 pushed organizations in a wide variety of sectors to embrace remote work, there are many hospitality roles that rely on direct physical services that cannot be performed remotely, such as laundry, cleaning, maintenance, and facility management. If faced with staff shortages, these roles could be outsourced to third-party professional service providers, and existing staff could be reskilled to take up new positions.
In McKinsey’s experience, the total service cost of this type of work in a typical hotel can make up 10 percent of total operating costs. Most often, these roles are not guest facing. A professional and digital-based solution might become an integrated part of a third-party service for hotels looking to outsource this type of work.
One of the lessons learned in the aftermath of COVID-19 is that many tourism employees moved to similar positions in other sectors because they were disillusioned by working conditions in the industry . Specialist multisector companies have been able to shuffle their staff away from tourism to other sectors that offer steady employment or more regular working hours compared with the long hours and seasonal nature of work in tourism.
The remaining travel and tourism staff may be looking for more flexibility or the option to work from home. This can be an effective solution for retaining employees. For example, a travel agent with specific destination expertise could work from home or be consulted on an needs basis.
In instances where remote work or outsourcing is not viable, there are other solutions that the hospitality industry can explore to improve operational effectiveness as well as employee satisfaction. A more agile staffing model can better match available labor with peaks and troughs in daily, or even hourly, demand. This could involve combining similar roles or cross-training staff so that they can switch roles. Redesigned roles could potentially improve employee satisfaction by empowering staff to explore new career paths within the hotel’s operations. Combined roles build skills across disciplines—for example, supporting a housekeeper to train and become proficient in other maintenance areas, or a front-desk associate to build managerial skills.
Where management or ownership is shared across properties, roles could be staffed to cover a network of sites, rather than individual hotels. By applying a combination of these approaches, hotels could reduce the number of staff hours needed to keep operations running at the same standard. 16 “ Three innovations to solve hotel staffing shortages ,” McKinsey, April 3, 2023.
Taken together, operational adjustments combined with greater use of technology could provide the tourism industry with a way of overcoming staffing challenges and giving customers the seamless digitally enhanced experiences they expect in other aspects of daily life.
In an industry facing a labor shortage, there are opportunities for tech innovations that can help travel and tourism businesses do more with less, while ensuring that remaining staff are engaged and motivated to stay in the industry. For travelers, this could mean fewer friendly faces, but more meaningful experiences and interactions.
Urs Binggeli is a senior expert in McKinsey’s Zurich office, Zi Chen is a capabilities and insights specialist in the Shanghai office, Steffen Köpke is a capabilities and insights expert in the Düsseldorf office, and Jackey Yu is a partner in the Hong Kong office.
Explore a career with us
Advancing social justice, promoting decent work ILO is a specialized agency of the United Nations
Migrated Content
On the eve of the T20 Ministers’ meeting in China, ILO Tourism Specialist Lucie Servoz explains how sustainable tourism can be a driving force for decent work, economic growth and sustainable development.
17 May 2016
Contributing to poverty reduction
Four key steps.
- Strengthening the sector’s linkages with related sectors in its supply chain (e.g. agriculture, handicrafts, transports, infrastructure, construction,) while supporting and promoting an integrated approach and local sourcing.
- Reinforcing initiatives to promote employment creation at local level, including in rural areas, contributing to social and economic development and poverty reduction though social inclusion, regional integration and expansion of local incomes.
- Investing into skills development and vocational education and training, and improving working conditions to enhance the sector’s image and service quality, bearing in mind that the skills level, professionalism, commitment, loyalty and soft skills of workers are key for competitiveness.
- Strengthening social dialogue mechanisms and collective bargaining. These can enhance working conditions, career prospects and job security to the benefit of the workers, and make it easier for companies to better respond to the needs and demands of the labour market.
Related content

Guide for Social Dialogue in the Tourism Industry

Toolkit on Poverty Reduction through Tourism
Thank you for visiting nature.com. You are using a browser version with limited support for CSS. To obtain the best experience, we recommend you use a more up to date browser (or turn off compatibility mode in Internet Explorer). In the meantime, to ensure continued support, we are displaying the site without styles and JavaScript.
- View all journals
- My Account Login
- Explore content
- About the journal
- Publish with us
- Sign up for alerts
- Open access
- Published: 10 February 2022
Analysis of spatial patterns and driving factors of provincial tourism demand in China
- Xuankai Ma 1 , 2 , 3 ,
- Zhaoping Yang 2 &
- Jianghua Zheng 1
Scientific Reports volume 12 , Article number: 2260 ( 2022 ) Cite this article
5238 Accesses
20 Citations
1 Altmetric
Metrics details
- Environmental economics
- Socioeconomic scenarios
- Sustainability
Modeling and forecasting tourism demand across destinations has become a priority in tourism research. Most tourism demand studies rely on annual statistics with small sample sizes and lack research on spatial heterogeneity and drivers of tourism demand. This study proposes a new framework for measuring inter-provincial tourism demand's spatiotemporal distribution using search engine indices based on a geographic perspective. A combination of spatial autocorrelation and Geodetector is utilized to recognize the spatiotemporal distribution patterns of tourism demand in 2011 and 2018 in 31 provinces of mainland China and detect its driving mechanisms. The results reveal that the spatial distribution of tourism demand manifests a vital stratification phenomenon with significant spatial aggregation in the southwest and northeast of China. Traffic conditions, social-economic development level, and physical conditions compose a constant and robust interaction network, which dominates the spatial distribution of tourism demand in different development stages through different interactions.
Spatial and temporal evolution and influencing factors of tourism eco-efficiency in Fujian province under the target of carbon peak
Investigating the spatial effect of operational performance in China’s regional tourism system
Structural characteristics and influencing factors of a spatial correlation network for tourism environmental efficiency in China
Introduction.
Tourism is an essential driver of world economic development. The world was affected by the COVID-19 outbreak in 2019, and according to a report by the World Tourism Organization 1 , the world's top ten consumer countries showed continued growth in tourism consumption against the backdrop of a global economic slowdown. According to the Ministry of Culture and Tourism of the People’s Republic of China ( https://www.mct.gov.cn/ ), China's 2020 annual domestic tourism numbered 2.879 billion trips, down 52.1% from a year earlier. The first quarter of 2021 saw 11.872700 billion domestic trips organized by national travel agencies, increasing 138.50% year-on-year. As the contribution of tourism to the regional economy is improving more and more significantly, the study of tourism demand has become a popular research topic 2 . Many scholars have carried out tourism demand forecasting through qualitative analysis, time series models, econometric models with artificial intelligence, and the accuracy of forecasting has gradually improved. However, tourism and tourists are closely correlated in terms of spatial mobility, and if spatial effects are ignored, a model estimation can be biased and produce misleading coefficient estimates 3 , 4 , 5 . Deng and Athanasopoulos were the first to incorporate spatiotemporal dynamics into an Australian domestic tourism demand model study 6 , and Yang and Zhang showed that spatiotemporal models have a significantly enhanced effect on the performance of tourism demand forecasting between domestic provinces in China 7 . Liu et al. noted that demographic factors, climate, key transportation modes, economic level, and other aspects of tourism demand were not investigated 8 . Therefore, it is imperative to understand the spatiotemporal patterns and driving mechanisms of tourism demand.
From the tourism supply side, the geographical and spatial clustering of tourism-related services produces spatial dependence and scale effects at the macro level, thus providing tourists with more acceptable prices and convenient services to achieve regional tourism growth. From the tourism demand side, tourists from the same region have more similar social psychology and tourism demand 9 , their tourism demand patterns are similar in terms of spatial preferences, and travel patterns show a more consistent cyclicality in time. Domestic tourism is an undisputed driver of economic development and poverty alleviation in less developed regions than international tourism 10 . Pompili et al. argued that choosing the provincial level as the geographic unit to study tourism flows yields more valuable results 11 . The results of the detection of spatial effects within a region can provide a scientific and empirical reference to local governments, tourism planners and administrative units regarding resource allocation and infrastructure development.
Several studies have explored the factors affecting tourism demand. For example, Priego et al. explored the impact of climate change on domestic tourism flows in Spain 12 . Massidda and Etzo studied the contribution of road infrastructure to tourism demand in domestic tourism in Italy 9 . Priego et al. emphasize the importance of meteorological factors on domestic travel destinations in Spain 12 . Technological innovation 13 and knowledge spillovers 14 cannot be ignored in driving tourism productivity and making tourism demand grow. Alvarez‐Diaz et al. 15 , Marrocu and Paci 16 , Massidda and Etzo 9 confirmed that the size of the population is also one of the drivers of tourism demand. Despite the large number of studies exploring the factors affecting tourism demand, most researchers have focused more on the impact of single aspects of socio-economic or natural factors on tourism demand, and there are no studies based on a geographic perspective that integrate the various dominant factors into a comprehensive mechanism of impact on tourism demand.
We found from the early literature that the number of tourists and tourism income served as the main proxies for tourism demand modeling. With the development of the Internet, some researchers 8 , 17 found that tourists' search engines for tourism information retrieval are the starting point and an essential part of tourism decision and travel. Li et al. summarized relevant 2012–2019 in their latest review 18 . We know about search engine data primarily based on empirical studies investigating the eximious contribution to tourism demand observation and forecasting. With Google Trends being widely used for tourism demand forecasting at multiple spatial scales worldwide 19 , Baidu Index performs even better in the Greater China region 20 . Song et al. demonstrated that Internet data has a significant driving effect on tourism demand research, with search engine data being the most common Internet data source used by researchers 19 . It is now well established from various literature that analytical methods have been implemented to address the single driving mechanisms of tourism demand. In their paper, Marrocu and Paci indicated that the application of spatial autoregressive models gave the spatial dependence patterns of tourism flows access to be effectively presented 16 . Yang and Fik investigated tourism growth change in 342 cities in China using spatial growth regression models 21 . Deng et al. used a spatial econometric analysis framework to analyze the impact of air pollution on inbound tourism in China 22 . In general, tourism demand is not affected by any individual factor, and the interactions among the factors affect the distribution of tourism demand. Therefore, it is crucial to detect the interrelated effects of tourism demand drivers. However, most existing studies ignore the interaction among the drivers of tourism demand. In addition, most existing models used in the literature make assumptions about the data and fail to reveal the interaction among the factors.
To fill these gaps, this study aims to address the spatial heterogeneity and drivers of tourism demand by using 678,900 Origin–Destination flows (OD flows) of tourism demand data from 31 Chinese provinces at the years 2011 and 2018, which helps gain insight into the spatial heterogeneity of tourism demand exhibited in the period of rapid economic development. Second, to our knowledge, this might be the first attempt to present a theoretical framework for a multi-factor driving mechanism of tourism demand, which incorporates social-economic development, population size, urban ecological conditions, tourism resources, physical conditions, traffic conditions, and technological innovation. Third, from the perspective of spatially stratified heterogeneity, this study taps the influence of the main driving factors and the interaction between different potential factors on the spatial heterogeneity of tourism demand. In addition, the study of tourism demand should not only focus on the influence of local economic activities and the natural environment but also the influence of inter-regional spatial correlation. Therefore, this study uses spatial autocorrelation and geographic detector models to analyze the spatial variation of tourism demand and its drivers at the provincial level.
The rest of the study is organized as follows: “ Materials and methodology ” section provides an overview of the proxies affecting tourism demand and the data and methods used in this paper. “ Results ” section analyzes the drivers and spatial characteristics of tourism demand. Finally, “ Discussion ” and “ Conclusions ” sections are the discussion and conclusion of the findings, respectively.
Materials and methodology
Study areas.
After the world economic crisis in 2008, China started its economic recovery in 2011, followed by an average annual growth of 9.48% in GDP and 14.99% in total domestic tourism consumption until 2018 (Fig. 1 b,c). This paper investigates the factors driving the changes in the spatial distribution of tourism demand at a provincial level in China in 2011 and 2018 to provide a basis for planning decision-makers in developing countries and regions. This study regarded the provinces as the primary geographical unit, and 31 administrative provinces in mainland China were selected as the study area. Due to the unavailability of data, Hong Kong, Macao, and Taiwan are not included in the study area (Fig. 1 ).
An overview map of the study area: ( a ) 31 provinces in mainland China; ( b ) economic conditions in the study area from 2011–2018; ( c ) tourism in the study area from 2011 to 2018. Data on China's economy are from the National Bureau of Statistics of China ( http://www.stats.gov.cn/ ) and the Chinese Academy of Social Sciences ( http://english.cssn.cn/ ). Standard map services are provided by the Ministry of Natural Resources of China ( http://bzdt.ch.mnr.gov.cn/ ), GS (2020)4619.
Dominant factors and proxy variables of tourism demand
From a systemic perspective, the underlying driving mechanism of tourism demand is constituted by the tourist travel intention of the source and the destination's attractiveness. It is influenced by the resistance of temporal distance, spatial distance, and social distance 23 , 24 , 25 . Natural conditions and human factors determine tourism demand (Fig. 2 ). In this study, social-economic development (Z1), population (Z2), urban ecology (Z3), tourism resources (Z4), physical conditions (Z5), traffic conditions (Z6), and technology innovation (Z7) are used as factors that directly affect tourism demand. Considering the availability of data, GDP per capita, value-added of tertiary industry, and the average wage of employees is used to characterize the level of socio-economic development. The total population and nighttime light index measure the population scale. Urban ecological condition is indicated by Urban park green area. Museums and A-class scenic spot index represent the richness of tourism resources. The physical environmental conditions consist of altitude, average daily hours of sunshine, average daily temperature, green space coverage index. Transportation conditions are reflected by the urban road area, highway mileage, and railroad mileage. The number of enterprises in the high-tech industry represents the region's scientific and technological innovation capability. The search intensity of the Baidu index was employed to quantify tourism demand.
Determinants and their geographical proxy variables concerning the spatial distribution of tourism demand.
Tourism demand of inter-province
Search engine big data are one of the data sources that can accurately quantify tourism demand. Search engines collect records of Internet users retrieving information on the Internet to form search engine indices with high timeliness. Baidu index ( https://index.baidu.com/ ) has better accuracy in the Greater China region for measuring tourism demand, and keywords query it. The keyword database consisted of the combinations of destination provinces name + "tourism". The Baidu index of each keyword could be decomposed according to the region and time, to obtain the daily search intensity of internet users in province A for tourism information in province B. We constructed an origin–destination (OD) spatiotemporal matrix in 2011 and 2018, which contains the intensity of travel information retrieved by residents of one province on the Internet for another province for each day. The correlation matrix of tourism demand among provinces visualized in Fig. 3 was obtained by summing up the daily tourism demand flows by year and accumulated in terms of destination provinces to obtain the tourism retrieval index of each province for a year. It characterized the total tourism demand of that province. Additionally, the annual Baidu Index of province-A Internet users query for tourism information about province-B is defined as a tourism demand flow for this OD.
Correlation matrix of tourism demand between provinces: Based on the daily Baidu indexes accumulated throughout the year in ( a ) 2011; ( b ) 2018. The Y-axis is the origin, and the X-axis is the abbreviation that replaces the destination, the name of each province. The color of each grid represents the total annual amount of tourism demand from the source province to the destination province. The grid color From lighter to darker represents the strength of tourism demand flow.
Indicators for influencing factors
We collected statistical panel data released in 2012 and 2019 from the China City Statistical Yearbook ( http://www.stats.gov.cn/tjsj/tjcbw/ ), including official statistics on the economic development level, population, urban ecological conditions, transportation conditions, and science and technology innovation. A-class tourism resources lists were extracted from the summary of government documents published on each local government website, and the tourism resources were numerically mapped according to A-1, AA-2, AAA-3, AAAA-4, and AAAA-5 remapping. The tourism resource addresses were geocoded into spatial point data, and kriging interpolation was implemented for spatial interpolation to generate the A-class tourism resources index raster. In addition, we used remote sensing data as a geographic proxy variable for physical conditions and population distribution. The NPP-VIIRS-like NTL Data from Harvard Dataverse ( https://library.harvard.edu/services-tools/harvard-dataverse/ ), which represents the intensity of human activity at night, the elevation data is from the Resource and Environmental Science Data Center of the Chinese Academy of Sciences ( https://www.resdc.cn/ ), the climate data is from the National Meteorological Science Data Center of China ( http://data.cma.cn/ ), and the green space coverage index is from the USGS ( https://www.usgs.gov/ ). All proxy variables were free of being counted according to provincial administrative boundaries, and the raw data were in a GeoDetector model where sampling points would capture the values of different variables.
Methodology
Exploratory spatial data analysis.
Exploratory spatial data analysis is a series of spatial data statistical analyses applied to describe and visualize the spatial and temporal distribution patterns of tourism demand. Global spatial autocorrelation 26 is adopted to determine whether the spatial distribution pattern of tourism demand is clustered, dispersed, or random 27 . The local spatial autocorrelation 28 is practiced in identifying areas where spatial clustering and outliers occur to explore their spatial effects 29 . Considering the spatial data of provinces are polygons and checked by topology, Queen contiguity is utilized to indicate the spatial weight matrix between provinces 30 .
Spatial stratification heterogeneity analysis
GeoDetector is an advanced spatial statistical analysis model used to study factors' impact on diseases at a specific geographical area early 31 . Furthermore, it gradually developed into various research fields with spatial characteristics, such as ecological security, food production, urban land use, carbon emissions. It is a hypothesis that if the independent variable directly influences the dependent variable in space, then the spatial distribution of the dependent variable should converge with the spatial distribution of the independent variable 32 . The model detects the similarity of two variables in spatial distribution patterns from the perspective of spatially stratified heterogeneity 33 .
In this paper, GeoDetector was adopted to analyze the factors affecting the spatial distribution of tourism demand in 31 provinces of China (Fig. 4 ). Factor detection, ecological detection, and interactive detection submodules were applied to quantify their spatial heterogeneity and interactions between factors on the spatial distribution of tourism demand. The Q statistic measured and explained the influence of the independent variable X on the dependent variable Y on spatial heterogeneity. The expressions are as follows.
where: \(Q\) -statistic is a measure of the explanatory power of the influence of factor X on tourism demand Y; M represents the number of strata (subdivisions); \(N\) represents the number of provincial geographical units in the study area; \({N}_{j}\) represents the number of provinces in subdivision \(j\) ; \({\sigma }^{2}\) and \({\sigma }_{j}^{2}\) indicate the variance of tourism demand in the whole study area and the variance of tourism demand in each subdivision, respectively. The greater the value of Q, the stronger the influence of factor X on tourism demand Y.
Principle of geodetector.
Stratification of geographic proxy variables has a significant impact on the accuracy of factor detection. The optimization algorithm for stratifying geographic proxy variables parameters proposed by Song et al. offered optimizing spatial discretization 34 . The optimization algorithm assumes that each variable is stratified using different unsupervised discretization methods to form different stratification schemes. If one alternative scheme obtains an enormous Q-statistic based on factor detection calculations, this stratification scheme captures the most significant driving force between that variable and the observed variables.
The study area was spaced at 50 km intervals, and 3795 sampling points were generated to sample 16 continuous-type variables. Quantile method, natural break method, geometric break method, standard deviation break method, and equivalence breakpoint method were used as statistical stratification methods with intervals of 3–6, and the Q-statistic of proxy variables and observations under different stratification schemes were probed. Finally, the scheme with the enormous Q-statistic was selected as the stratification and interval parameters for this proxy variable.
Spatial patterns of tourism demand in provinces
Spatial distribution.
Figure 5 illustrates the spatial distribution of tourism demand and flows between provinces in 2011 and 2018. In 2011, tourism demand was mainly distributed in China's first-tier cities with Beijing and Shanghai and the border provinces from southwest to northwest, with Hainan, Yunnan, Tibet, and Xinjiang being the main tourism demand destinations 35.33% of tourism demand in the study area. In 2018, tourism demand showed a trend of migration to first-tier cities, with Yunnan, Tibet, Shanghai, Chongqing, and Guizhou accounting for 36.46% of the total tourism demand.
Spatial distribution of tourism demand and tourism demand flow: ( a ) tourism demand in 2011, and ( e ) is in 2018; ( b – d ) are the inter-provincial directional tourism demand flows in 2011, which are high-intensity flow, medium intensity flow, and low-intensity flow respectively, and ( f – h ) is in 2018.
From the spatial perspective of tourism flow, there are 930 tourism flows between provinces with a minimum Euclidean distance of 115 km, a maximum of 3600 km, and a median of 1286 km. Long-distance travel 35 is a characteristic of tourism between domestic provinces. In 2011 the tourists' origins were concentrated in eastern China, and there were two clusters of high-intensity tourism flows distributed from Beijing and the ring-Beijing area to Yunnan and Hainan; this phenomenon altered significantly in 2018, with high-intensity tourism flows concentrated on one cluster of tourism flows from eastern China to Yunnan Province. Medium-intensity tourism flows presented a complex network with a stochastic pattern in 2011; in 2018, the complexity of the tourism network decreased, with steady clusters of tourism flows originating from the eastern provinces to Xinjiang and Tibet, while the northeastern region became a complete exporter of tourists. Comparing the low-intensity tourism flows in 2011 and 2018, it can be attended that the overall origin and destination were practically completely connected, i.e., there were tourism flows from both border provinces and the central region. The central provinces also energetically export tourists to the peripheral provinces, diverting the overall tourism flow network to a more luxuriant state. In summary, we can catch that the domestic tourism network in China during the period of rapid economic development showed a remarkable complex pattern, with the origins of tourists consolidated in the densely populated and economically developed areas in the east and the destinations distributed in the first-tier cities, and remote areas in the central and western regions.
From 2011 to 2018, the northeastern provinces, Beijing-Tianjin-Hebei region (Beijing, Tianjin, Hebei), Yangtze River Delta region (Shanghai, Jiangsu, Zhejiang, Anhui), and Pearl River Delta region (Guangzhou) are stable tourist sources; the average value of tourism demand in each province rose from 642,515 to 1,529,387, an increase of 2.38 times (Fig. 6 ). Yunnan and Guizhou in the southwest and Gansu in the west grew at a much higher rate than the national average; Heilongjiang, Jilin, and Liaoning in the northeast grew at a much lower rate than the average; and Hainan in the south became the only province in the country where tourism demand decreased.
Spatial distribution of the ratio of tourism demand in 2018 to 2011.
Spatial dependency
The spatial distribution pattern of tourism demand shifted from medium to high clustering in 2011 and 2018, and the positive Moran’s I revealed the existence of high-value to high-value clustering or low-value to low-value clustering of tourism demand in the study area, and the spatial pattern and spatial dependence of tourism demand with evident clustering. The z-score increased by 177.58% during this period, and the p-value decreased by 88.96%. The probability of rejecting the null hypothesis increased from 90 to 95%. Thus, the spatial clustering trend of tourism demand strengthened.
The global Moran’s I identified the overall spatial dependence of tourism demand in each province within the study area, and Local spatial autocorrelation analysis was applied to uncover the local spatial association patterns. As can be seen from Fig. 7 , significant stratification of tourism demand in 2011 and 2018 on a local spatial basis in China (absolute value of Z-score > 2.56, p-value < 0.01), consisting mainly of high-high value clusters (H–H) and low-low value clusters (L-L). In 2011, the H-H cluster was in Yunnan Province in southwestern China, the high values surrounded by low values cluster (H-L) appeared in Beijing, and the L-L cluster was in Heilongjiang Province in northeastern China. In 2018, the H-H cluster was still in Yunnan province, and the L-L clusters were distributed in Heilongjiang, Jilin, and Liaoning province, covering the whole northeastern region. From the perspective of spatial and temporal distribution, tourism demand formed a growth pole in southwestern China centered on Yunnan from 2011 to 2018, and tourism demand in Guizhou, adjacent to Yunnan, grew significantly and showed a spatial diffusion effect the region (Fig. 7 ). While in northeast China, the number of L-L clusters increased, and the provincial growth rate of tourism demand in low-value agglomeration was much lower than the national average during the study period. The existence of the H-L cluster in Beijing in 2011 and the disappearance of this cluster in 2018 indicated that Beijing had strong competitiveness in the region in the early stage, and the weakening polarization effect and the increasing diffusion effect diminished in the later stage when tourism demand was gradually distributed in a balanced manner in the Beijing-ring region. It suggested that tourism demand was more stable in China spatially in high-value clustering, and low-value clustering had increased, forming an increasingly stable high-value area in the southwest and low-value area in the northeast. Therefore, tourism demand in one province largely influences tourism demand in the adjacent provinces.
Local indicators of spatial association (LISA) for tourism demand in ( a ) 2011 and ( b ) 2018. The numerical marks on the maps represent P values, ** 5% level of significance (P < 0.05); *** 1% level of significance (P < 0.01).
Driving forces of tourism demand
Influencing factors of tourism demand.
Figure 8 showed the explanatory power of the driving factors for tourism demand in 2011 vs. 2018. In 2011, The number of enterprises in the high-tech industry (0.5622) had the highest explanatory power, implying that GDP had a remarkably noticeable impact on tourism demand. Average daily hours of sunshine (0.4934), Urban park green space area (0.4928), Urban road area (0.4763), GDP per capita (0.4473), Railroad mileage (0.4229) had the same level of high explanatory power, which meant that these three drivers had the most noticeable impact on tourism demand. The number of museums (0.3932), value-added of tertiary industry (0.3892), Average wage of employees (0.3479), Total population (0.3429), Highway mileage (0.3024) were also significant drivers of tourism demand. Average daily temperature (0.2757) and altitude (0.2028) also influenced tourism demand. Green space coverage index (0.0616), A-class scenic spot index (0.0321). The nighttime light index (0.0062) had minimal explanatory power on tourism demand.
Power of determinant Q-statistic value for each driving factor in 2011 and 2018.
In 2018, the average daily hours of sunshine (0.5848) significantly affected tourism demand, expressing the strongest association with tourism demand: urban park green space area (0.4084), Average daily temperature (0.407). GDP per capita (0.4058) had a significant explanatory power on the spatial distribution of tourism demand. Urban road area (0.3924), Railroad mileage (0.3863), Average wage of employees (0.3753), The number of museums (0.37), Total population (0.3347), Highway mileage (0.3299), The number of enterprises in the high-tech industry (0.3191) were also significant factors influencing tourism demand. Tourism demand was limitedly influenced by the value-added of tertiary industry (0.2148), Altitude (0.1443). Green space coverage index (0.0198), A-class scenic spot index (0.0062). The nighttime light index (0.0054) had minimal effects on tourism demand.
Interaction of driving factors
One hundred twenty couple of interactions were generated yearly between the 16 factors in 2011 and 2018, the bulk of which had an enhancing effect on tourism demand, with the primary interaction type being nonlinear enhancement (55.83% in 2011 and 75.83% in 2018), followed by bi-variable enhancement (43.33% in 2011 and 23.33% in 2018). The explanatory power of the interaction on tourism demand was greater than that of the single factor with the maximum explanatory power.
As shown in Fig. 9 a,c, in 2011, Average wage of employees-Average daily hours of sunshine (0.9935), Average wage of employees-Urban road area, GDP per capita-Railroad mileage, were two-factor non-linearly enhanced interactions with Q-statistic for the interactions greater than 0.99, showing a tourism demand with extreme explanatory power. Urban park green space area-Highway mileage, Average daily hours of sunshine-Highway mileage, Average daily hours of sunshine-Railroad mileage, Average wage of employees-Highway mileage, The number of museums-Average daily hours of sunshine, Average wage of employees-Urban park green space area, Urban park green space area-The number of museums were two-factor none-linearly enhanced interactions with interaction Q-statistic values greater than 0.98, a significant increase in the influence of synergy on tourism demand.
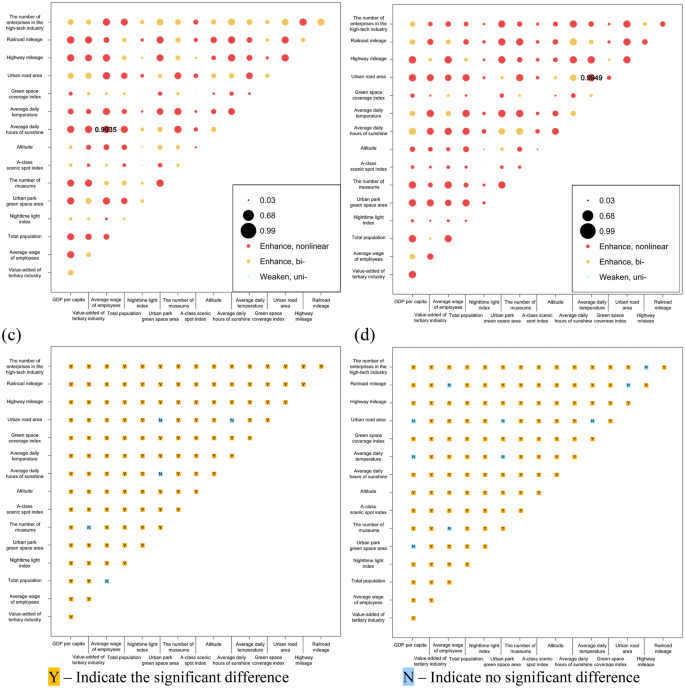
GeoDetector results: Power of determinants in interaction in ( a ) 2011 and ( b ) 2018; the difference of the impacts between two explanatory variables in ( c ) 2011 and ( d ) 2018.
In 2018 (Fig. 9 b,d), Average daily temperature-Urban road area (0.9949), Urban park green space area-Average daily temperature, Average daily temperature-Highway mileage, Total population-Average daily temperature, GDP per capita-Highway mileage, Average wage of employees-Highway mileage, GDP per capita-Total population, The number of museums-Average daily temperature, were two-factor non-linearly augmented interaction patterns with interaction Q-statistic greater than 0.99, which almost wholly control the spatial distribution of tourism demand. Value-added of tertiary industry-Average daily temperature, GDP per capita-Average daily hours of sunshine, GDP per capita-Value added of tertiary industry, GDP per capita-Urban road area, GDP per capita-The number of museums, GDP per capita-Urban park green space area, were two-factor none-linearly enhanced and GDP per capita-Average daily hours of sunshine was two-factor enhanced with interaction Q-statistic values greater than 0.98.
The regional economic development and construction were the main drivers, followed by the size of the population and the base of tourism services, and again by the traffic conditions, with the influence of natural factors and tourism resources being minimal in 2011. Moreover, by 2018, the influence of tourism comfort factors began to rise, such as average daily hours of sunshine and average daily temperature, representing a significant increase. The level of social and personal economic development and transportation conditions also increased influence to 2011. It indicated that in the aftermath of the world economic crisis and during the economic recovery, the driving force affecting tourism demand is the city's economy and level of development. However, after high economic growth, tourists have more requirements for the comfort of the experience during tourism, and the economy is no longer the main driving force directly affecting the spatial distribution of tourism demand.

Interaction mechanism
We filtered the five combinations with the maximum Q-statistic values from each of the 120 interaction combinations for 2011 and 2018, respectively, with an average explanatory power greater than 0.99 and two-factor nonlinear enhancement. It indicates that these combinations play a decisive role in the spatial distribution of tourism demand. The dominant factors to which each proxy variable belongs are also shown in Table 1 . The ten combinations generated the interaction networks with the most explanatory power. The proxy variables and the determinants are mapped as nodes; the cumulative value of the Q statistics for the interactions between the node and other nodes determines the node's size. The interactions between the factors are edges, and the Q-statistic values for interaction measured the weight of the edges. Different hierarchical interaction networks are visualized in Fig. 10 revealed the interactive mechanism.
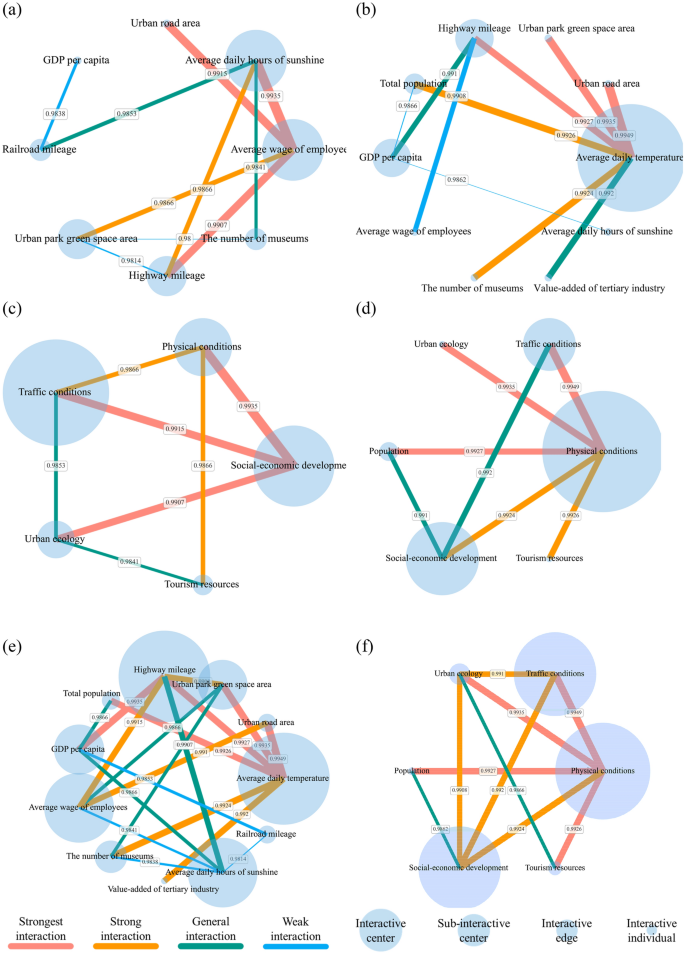
Diagram of Interactive Network: the interactive network of proxy variables in 2011 ( a ) and 2018 ( b ); interactive network of dominants in ( c ) 2011 and ( d ) 2018; ( e ) global interactive network based on proxy variables; ( f ) global interactive network based on dominants.
From the perspective of the interaction of proxy variables, a strong triangular network community was formed in 2011 by average wages of employees—average daily hours of sunshine-highway mileage. In 2018, the interaction network shaped a significant polarization with the average daily temperature at the center, and average daily temperature and highway mileage formed a chain community. From the perspective of the interaction of dominants, Fig. 10 c,d illustrate a substantial triangular network community formed by traffic conditions dominated by socio-economic development conditions and complemented by physical conditions in 2011. This community continued to persist in 2018, with the difference that the roles of physical and traffic conditions were switched.
Notably, the most significant interaction results in 2011 and 2018 were integrated to reveal the driving mechanisms impacting the distribution of tourism demand. Physical conditions existed at the core of the interaction network, mainly in the form of average daily temperature, which interacted extensively with other factors and was the central driver influencing the distribution of tourism demand, indicating that tourism comfort is the basis of the natural scenery tourism attraction. Socio-economic development followed closely behind in physical conditions, with the average wage of employees representing the general level of economic development in the region and the prosperity of the tertiary sector, characterizing the level of tourism services, as well as being the foundation for driving the city to be a tourist attraction. The importance of traffic conditions was uncovered in tourism accessibility and the compression of the time distance. The three formed a concrete network of interactions that influenced the spatial distribution of tourism demand.
Tourism is one of the critical engines of local economic development and serves as a regulatory tool for coordinated development within and between countries and regions. Tourism is extraordinarily vital and dynamic, and according to the latest report of the World Tourism Organization, tourism worldwide has shown a rapid recovery after the impact of COVID-19. This paper suggested a theoretical framework to explore the spatial distribution of driving tourism demand based on a spatially stratified heterogeneity perspective, obtained the dominant drivers to shape the spatial distribution of tourism demand, and discussed the interaction mechanisms among the drivers.
Internet Big data have derived a tremendous amount of Internet operation records of individual Internet users, which provide us with new means of observation. Early observations of tourism demand relied on management statistics of scenic spots and cities. After 2008 Internet search engines, big data were widely used as indicators to quantify tourism demand, and they proved to have good reliability at different geographic scales to accurately reflect the amount of tourism demand. For example, Yang et al. and Xin et al. predicted tourism demand in Hainan Province 36 , China, and Beijing Forbidden City 37 , Beijing, China. The results proved that the Baidu index could more accurately reflect tourism demand's spatial and temporal characteristics. This paper uncovered the spatial distribution of tourism demand and flow network patterns reflected by the Baidu index on a national scale (Figs. 3 , 6 ). It demonstrated that the Baidu index could characterize tourism demand dynamically and build tourism flow networks.
Notably, there were regional differences in the distribution of inter-provincial tourism demand in China. The study results showed that tourism demand increased significantly from 2011 to 2018, the spatial clustering pattern of tourism demand was not randomly distributed (Fig. 5 ); there were two types of spatial effects in regional tourism growth, namely spatial spillover and spatial heterogeneity 21 . The high tourism demand cluster was shaped in the southwest, and the low tourism demand cluster was rendered in the northeast (Fig. 7 ). The spatial competitive effect of high and low imbalance in the capital ring gradually vanishes, and the tourism demand in the central region tends to be homogeneous.
By investigating the spatial distribution pattern of domestic inter-provincial tourism demand in China, we recognized heterogeneity in the sensitivity of long-distance tourism flows to the distance in different intensities (Fig. 11 ). There was an explicit reversal at 1900 km for high-intensity tourism flows, i.e., the distance between origin and destination was shorter than 1900 km, and tourism demand positively corresponded with distance; conversely, whereas the was over 1900 km, tourism demand declined with increasing distance. Medium-intensity tourism flows were not sharp with distance. Low-intensity tourism flows obeyed the distance decay law.
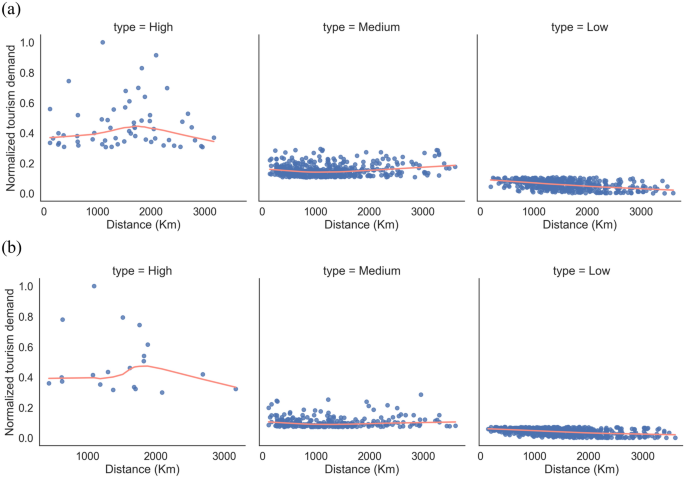
Results of locally weighted regressions of distance and travel demand: ( a ) 2011 ( b ) 2018. 2011 and 2018 tourism demand flow intensities were normalized separately. Locally weighted regression 38 of distance and normalized tourism demand intensity was performed according to the stratification of tourism demand flows in Fig. 5 , where the Euclidean distances of flows were calculated in the Beijing_1954_3_Degree_GK_Zone_35 coordinate system.
The dominants that have a decisive influence on tourism demand were physical conditions, socio-economic development, and traffic conditions; the proxy variables are the average daily temperature, the average wage of employees, and highway mileage.
Physical conditions had high explanatory power for the spatial distribution of tourism demand, proving that natural scenery tourism was more prevalent in China than urban humanistic tourism. Tourist attraction and comfort of the natural scenery type were determined physical conditions; for instance, world natural heritage sites have a stronger role in promoting tourism 39 . Murphy et al. analyzed daily time-scale park visitation and weather data for Pinery Provincial Park, Canada, from 2000 to 2009, demonstrating the high sensitivity of tourism demand to average daily temperatures 40 .
While socio-economic development furnishes the foundation for breeding urban humanistic tourism, the average wage of employees is an efficient indicator of the region's economic development 41 , where high-quality tourist reception, available public information, travel safety, and diversified recreational convenience services are important factors attracting tourists. Meanwhile, efficient administrative supervision services in economically developed regions directly impact public information, recreational convenience, safety protection, and recreational convenience 42 .
Traffic conditions make it possible to connect tourists to tourist attractions. Wang et al. (2020) uncovered a well-coupled relationship between tourism efficiency and traffic accessibility in Hubei Province 43 , China, from 2011 to 2017. Highway mileage enhanced the coverage of inter-regional connections and compressed tourists' time costs to their destinations; on the other hand, it also increased the polarization of intra-regional connections, thus benefiting the central regions rather than the peripheral ones from the traffic 44 . This finding was consistent with the results that Southwest China forms a high tourism demand cluster, while Northeast China is a low tourism demand cluster in “ Spatial dependency ” section and Fig. 7 . Another recent study 45 has observed that less-developed central and western regions attract more visitors than developed eastern regions by improving transportation conditions in China.
Several aspects need to be considered in related follow-up studies. First, this study analyzed the drivers of tourism demand at the provincial level in China, with prominent medium- and long-distance tourism characteristics. In contrast, complete tourism demand occurs between prefecture-level cities, which should be considered the primary research unit in the future. However, writing a crawler program to request raw data from the Baidu index to obtain the daily tourism demand O-D flow has limitations. Therefore, moderately reducing the scope of the study may be helpful. Secondly, direct dominants in this study's theoretical framework of the driving mechanism are economic development level, population size, urban ecological conditions, tourism resources, natural environment, transportation conditions, and science and technology innovation. The results showed that the geographical variables represented by the tourism resources index, night lighting index, and green space coverage index have little impact on tourism demand, it might be caused by the difference between the scale of rasters and spatial panel data, these rasters may have more efficiently representation on the scale of urban. Therefore, more representative ones should be selected in future research as proxy variables. Finally, the COVID-19 global pandemic significant public safety event on tourism demand is also very impacting. The effects of severe public contingencies and the government's immediate response policies on tourism demand should be added to the tourism demand driving mechanism in the future.
Conclusions
This study adopted Baidu index data spatialized into flow space, and multi-source data to investigate domestic tourism demand's spatial pattern and drivers during China's rapid economic development (2011–2018). The results show that (1) China's domestic tourism demand has significantly increased, shaping a spatial pattern in which first-tier cities and western regions where the core tourism destinations and the tourism attractiveness of northeastern regions gradually disappeared. The tourism demand network is increasingly prosperous and gradually develops from disorderly to orderly, with eastern regions as the main source of tourists. (2) From the single driving factor, the factor with the strongest and increasing control over the spatial distribution of tourism demand is sunshine hours > the average wage of employees > highway mileage. (3) In terms of the composite factor interaction results, the interaction network formed by physical conditions-economic development level-transportation conditions steadily and strongly determines the spatial distribution pattern of tourism demand.
The novelty of this study is the flow-based spatialization of the search engine index (Baidu index), which efficiently mapped the spatial mode of tourism demand and unearthed the network formed by domestic tourism flows, domestic long-distance travel in China is positively correlated with distance in terms of travel demand between the source and destination within 1900 km and vice versa. Additionally, the factors affecting the spatial distribution of tourism demand were interpreted from spatial heterogeneity, and the significant impact of the interaction between factors on tourism demand was resolved and captured the complex network. The findings of this paper can provide a reference for regional tourism planning decision-makers. Simultaneously, it can also provide a systematic tourism demand driving mechanism for tourism demand forecasting researchers and promote modeling accuracy.
International Tourism Highlights, 2020 Edition (World Tourism Organization (UNWTO), 2021). https://doi.org/10.18111/9789284422456 .
Song, H., Qiu, R. T. R. & Park, J. A review of research on tourism demand forecasting: Launching the Annals of Tourism Research Curated Collection on tourism demand forecasting. Ann. Tour. Res. 75 , 338–362 (2019).
Article Google Scholar
Song, H. & Li, G. Tourism demand modelling and forecasting—A review of recent research. Tour. Manag. Anal. Behav. Strateg https://doi.org/10.1016/j.tourman.2007.07.016 (2008).
Goh, C. & Law, R. The methodological progress of tourism demand forecasting: A review of related literature. J. Travel Tour. Market. 28 , 296–317 (2011).
Wu, D. C., Song, H. & Shen, S. New developments in tourism and hotel demand modeling and forecasting. Int. J. Contemp. Hosp. Manag. https://doi.org/10.1108/IJCHM-05-2015-0249 (2017).
Deng, M. & Athanasopoulos, G. Modelling Australian domestic and international inbound travel: A spatial–temporal approach. Tour. Manag. 32 , 1075–1084 (2011).
Yang, Y. & Zhang, H. Spatial-temporal forecasting of tourism demand. Ann. Tour. Res. 75 , 106–119 (2019).
Liu, P., Zhang, H., Zhang, J., Sun, Y. & Qiu, M. Spatial-temporal response patterns of tourist flow under impulse pre-trip information search: From online to arrival. Tour. Manag. 73 , 105–114 (2019).
Article CAS Google Scholar
Massidda, C. & Etzo, I. The determinants of Italian domestic tourism: A panel data analysis. Tour. Manag. 33 , 603–610 (2012).
Giambona, F. & Grassini, L. Tourism attractiveness in Italy: Regional empirical evidence using a pairwise comparisons modelling approach. Int J Tour. Res 22 , 26–41 (2020).
Pompili, T., Pisati, M. & Lorenzini, E. Determinants of international tourist choices in Italian provinces: A joint demand–supply approach with spatial effects. Pap. Reg. Sci. 98 , 2251–2273 (2019).
Priego, F. J., Rossello, J. & Santana-Gallego, M. The impact of climate change on domestic tourism: A gravity model for Spain. Reg. Environ. Change 15 , 291–300 (2015).
Cabrer-Borras, B. & Serrano-Domingo, G. Innovation and R&D spillover effects in Spanish regions: A spatial approach. Res. Policy 36 , 1357–1371 (2007).
Joppe, M. & Li, X. P. productivity measurement in tourism the need for better tools. J. Travel Res. 55 , 139–149 (2016).
Article ADS Google Scholar
Alvarez-Diaz, M., D’Hombres, B., Ghisetti, C. & Pontarollo, N. Analysing domestic tourism flows at the provincial level in Spain by using spatial gravity models. Int. J. Tour. Res. 22 , 403–415 (2020).
Marrocu, E. & Paci, R. Different tourists to different destinations. Evidence from spatial interaction models. Tour. Manag. 39 , 71–83 (2013).
Bing, P. & Fesenmaier, D. R. Online information search: Vacation planning process. Ann. Tour. Res. 33 , 809–832 (2006).
Li, X., Law, R., Xie, G. & Wang, S. Review of tourism forecasting research with internet data. Tour. Manag. 83 , 104245 (2021).
Song, H., Qiu, R. & Park, J. A review of research on tourism demand forecasting. Ann. Tour. Res. 75 , 338–362 (2019).
Wen, L., Liu, C., Song, H. & Liu, H. Forecasting tourism demand with an improved mixed data sampling model. J. Travel Res. 60 , 336–353 (2021).
Yang, Y. & Fik, T. Spatial effects in regional tourism growth. Ann. Tour. Res. 46 , 144–162 (2014).
Deng, T., Li, X. & Ma, M. Evaluating impact of air pollution on China’s inbound tourism industry: A spatial econometric approach. Asia Pac. J. Tour. Res. 22 , 1–10 (2017).
Bar-Anan, Y., Liberman, N. & Trope, Y. The association between psychological distance and construal level: Evidence from an implicit association test. J. Exp. Psychol. Gen. 135 , 609–622 (2006).
Park, R. E. Race and Culture (The Free Press, 1950).
Google Scholar
Trope, Y. & Liberman, N. Construal-level theory of psychological distance. Psychol. Rev. 117 , 440–463 (2010).
Moran, P. A. Notes on continuous stochastic phenomena. Biometrika 37 , 17–23 (1950).
Article MathSciNet CAS Google Scholar
Cliff, A. & Ord, V. J. Spatial Processes: Model and Application (1981).
Anselin, L. Local indicators of spatial association—LISA. Geogr. Anal. 27 , 93–115 (1995).
Zhang, C., Lin, L., Xu, W. & Ledwith, V. Use of local Moran’s I and GIS to identify pollution hotspots of Pb in urban soils of Galway, Ireland. Sci. Total Environ. 398 , 212–221 (2008).
Article ADS CAS Google Scholar
Drukker, D. M., Hua, P., Prucha, I. R. & Raciborski, R. Creating and managing spatial-weighting matrices with the spmat command. Stata J. 12 , 242–286 (2013).
Wang, J. F., Zhang, T. L. & Fu, B. J. A measure of spatial stratified heterogeneity. Ecol. Ind. 67 , 250–256 (2016).
Wang, J. et al. Geographical detectors-based health risk assessment and its application in the neural tube defects study of the Heshun region, China. Int. J. Geogr. Inf. Sci. 24 , 107–127 (2010).
Wang, J. & Xu, C. Geodetector: Principle and prospective. Acta Geogr. Sin. https://doi.org/10.11821/dlxb201701010 (2017).
Song, Y., Wang, J., Ge, Y. & Xu, C. An optimal parameters-based geographical detector model enhances geographic characteristics of explanatory variables for spatial heterogeneity analysis: Cases with different types of spatial data. GISci. Remote Sens. 57 , 593–610 (2020).
Bacon, B. & LaMondia, J. J. Typology of travelers based on their annual intercity travel patterns developed from 2013 longitudinal survey of overnight travel. Transp. Res. Rec. J. Transp. Res. Board 2600 , 12–19 (2016).
Yang, X., Bing, P., Evans, J. A. & Lv, B. Forecasting Chinese tourist volume with search engine data. Tour. Manag. 46 , 386–397 (2015).
Xin, L. A., Bing, P., Rl, D. & Xh, E. Forecasting tourism demand with composite search index. Tour. Manag. 59 , 57–66 (2017).
Cleveland, W. Robust locally weighted regression and smoothing scatterplots. J. Am. Stat. Assoc. 74 , 829–836 (1979).
Article MathSciNet Google Scholar
Yang, C.-H. et al. Analysis of international tourist arrivals in China: The role of World Heritage Sites. Tour. Manag. https://doi.org/10.1016/j.tourman.2009.08.008 (2010).
Article PubMed Google Scholar
Murphy, P., Pritchard, M. P. & Smith, B. The destination product and its impact on traveller perceptions. Tour. Manag. https://doi.org/10.1016/S0261-5177(99)00080-1 (2000).
Faggian, A., Modrego, F. & McCann, P. Human capital and regional development. Handbook of Regional Growth and Development Theories (2019).
Liu, C. & Wang, D. Satisfaction of foreign visitors with public service system of Chinese urban tourism in Suzhou ( in Chinese ). Urban Dev. Stud. 22 , 101–110 (2015).
Wang, Z., Liu, Q., Xu, J. & Fujiki, Y. Evolution characteristics of the spatial network structure of tourism efficiency in China: A province-level analysis. J. Destination Market. Manag. 18 , 100509 (2020).
Faber, B. Trade integration, market size, and industrialization: evidence from China’s National Trunk Highway System. Rev. Econ. Stud. 81 , 1046–1070 (2014).
Gao, Y., Su, W. & Wang, K. Does high-speed rail boost tourism growth? New evidence from China. Tour. Manag. https://doi.org/10.1016/j.tourman.2018.12.003 (2019).
Download references
Acknowledgements
The authors acknowledge the help of Dr.Yongze Song and reviewers on improving and commenting on the manuscript. This work was supported by The Second Tibetan Plateau Scientific Expedition and Research Program (STEP) [Grant No. 2019QZKK1004].
Author information
Authors and affiliations.
College of Resource and Environment Sciences, Xinjiang University, Ürümqi, 830046, China
Xuankai Ma & Jianghua Zheng
Xinjiang Institute of Ecology and Geography, Chinese Academy of Sciences, No.818, Beijing South Road, Ürümqi, 830011, Xinjiang, China
Xuankai Ma & Zhaoping Yang
University of Chinese Academy of Sciences, Beijing, 100049, China
You can also search for this author in PubMed Google Scholar
Contributions
X.M. conceived and designed the study, conducted the data analysis and visualization, and wrote the manuscript. Z.Y. provided project administration, supervision, validation. J.Z. gave guidance to improve the results in revision. All authors reviewed and commented on the manuscript.
Corresponding author
Correspondence to Zhaoping Yang .
Ethics declarations
Competing interests.
The authors declare no competing interests.
Additional information
Publisher's note.
Springer Nature remains neutral with regard to jurisdictional claims in published maps and institutional affiliations.
Rights and permissions
Open Access This article is licensed under a Creative Commons Attribution 4.0 International License, which permits use, sharing, adaptation, distribution and reproduction in any medium or format, as long as you give appropriate credit to the original author(s) and the source, provide a link to the Creative Commons licence, and indicate if changes were made. The images or other third party material in this article are included in the article's Creative Commons licence, unless indicated otherwise in a credit line to the material. If material is not included in the article's Creative Commons licence and your intended use is not permitted by statutory regulation or exceeds the permitted use, you will need to obtain permission directly from the copyright holder. To view a copy of this licence, visit http://creativecommons.org/licenses/by/4.0/ .
Reprints and permissions
About this article
Cite this article.
Ma, X., Yang, Z. & Zheng, J. Analysis of spatial patterns and driving factors of provincial tourism demand in China. Sci Rep 12 , 2260 (2022). https://doi.org/10.1038/s41598-022-04895-8
Download citation
Received : 13 November 2021
Accepted : 04 January 2022
Published : 10 February 2022
DOI : https://doi.org/10.1038/s41598-022-04895-8
Share this article
Anyone you share the following link with will be able to read this content:
Sorry, a shareable link is not currently available for this article.
Provided by the Springer Nature SharedIt content-sharing initiative
This article is cited by
Study on the geographic distribution and influencing factors of dai settlements in yunnan based on geodetector.
- Hongfei Tao
- Jingfan Zhou
Scientific Reports (2024)
Spatial–temporal analysis and spatial drivers of hepatitis-related deaths in 183 countries, 2000–2019
Scientific Reports (2023)
Analysis of spatial patterns and driving factors of domestic medical tourism demand in North East India
- Tanmoy Biswas
GeoJournal (2022)
By submitting a comment you agree to abide by our Terms and Community Guidelines . If you find something abusive or that does not comply with our terms or guidelines please flag it as inappropriate.
Quick links
- Explore articles by subject
- Guide to authors
- Editorial policies
Sign up for the Nature Briefing newsletter — what matters in science, free to your inbox daily.
To read this content please select one of the options below:
Please note you do not have access to teaching notes, conceptualizing and contextualizing overtourism: the dynamics of accelerating urban tourism.
International Journal of Tourism Cities
ISSN : 2056-5607
Article publication date: 27 March 2020
Issue publication date: 28 November 2020
From the background of the dramatic increase of urban tourism, framed by the concept of overtourism, the purpose of this paper is to analyze and discuss current dynamic processes of urban tourism growth, as presented in the scientific literature. With the help of a literature review, this paper aims to discuss current definitions and conceptualizations of overtourism and discuss the driving forces for the growth of urban tourism, thereby situating overtourism in relational to general structural change.
Design/methodology/approach
This paper builds on a non-exhaustive review of the scientific literature about overtourism and related topics, supplemented by a review of a few central policy documents.
Conceptually, overtourism relates to two different, but related, perspectives. The first one concern (negative) experiences of resident population and visitors, whereas the second relates to thresholds for the carrying capacity of destinations. Most of the reviewed literature focuses on three aspects of overtourism: localized problems in inner cities, the supply of unregulated accommodation through Airbnb and Airbnbs as a driving force of gentrification. Important perspectives are missing from the literature, mainly related to the development of driving forces of urban tourism growth in time and space. This observation is the starting point for a discussion on driving forces in an evolutionary perspective with the ambition of relating the growth of urban tourism to long waves of structural development.
Research limitations/implications
The paper focuses on overtourism in urban contexts, rural tourism is not discussed.
Practical implications
In identifying the importance of driving forces for understanding the dynamics of urban tourism growth, a holistic view on managing mitigation might be possible.
Originality/value
The paper adds an evolutionary perspective to the discussion about overtourism and its causes. Thereby, it answers to a need to take tourism seriously in social science, as a major economic, social and ecologic force. In emphasizing the relationship between driving forces on different geographic scales and levels, power relations are highlighted. The paper discusses the role of driving forces for mitigating overtourism. An understanding of the dynamics of driving forces is essential for the development of urban sustainable tourism.
- Urban tourism
- Overtourism
- Driving forces of urban tourism growth
- Tourism geography
- Tourism innovation
Acknowledgements
Funding : The research behind this publication was funded by Formas, the Swedish research council for sustainable development, project 2018-02238.
Nilsson, J.H. (2020), "Conceptualizing and contextualizing overtourism: the dynamics of accelerating urban tourism", International Journal of Tourism Cities , Vol. 6 No. 4, pp. 657-671. https://doi.org/10.1108/IJTC-08-2019-0117
Emerald Publishing Limited
Copyright © 2020, International Tourism Studies Association
Related articles
We’re listening — tell us what you think, something didn’t work….
Report bugs here
All feedback is valuable
Please share your general feedback
Join us on our journey
Platform update page.
Visit emeraldpublishing.com/platformupdate to discover the latest news and updates
Questions & More Information
Answers to the most commonly asked questions here
- Newsletters
Tourism: a driving force for growth

This month the Dossier in our Monthly Report looks at one of the most important sectors for Spain’s economy: tourism. A sector that provides more than 11% of the country’s gross domestic product and 13% of its jobs, which has been one of the pillars of its economic recovery over the past few years and will continue be a driving force for growth in the medium and long term... if we look after it properly.
The latest figures posted by Spain’s tourism industry highlight its dynamism. The country received 20 million international tourists in the first four months of 2017, a record figure and up 10.3% compared to the same period last year. At this rate, more than 83 million tourists will come to Spain this year, almost taking over France as the world’s foremost tourist destination. The number of tourists will have increased by over 40% since 2007. And domestic tourism is also starting to show signs of picking up.
In the past few years, Spain’s tourism industry has undoubtedly seen its demand increase as a consequence of security problems in North Africa and the Middle East. But the keys to its success go far beyond safety issues, as shown by the World Economic Forum ranking which places Spain’s travel and tourism sector (T&T) as the most competitive in the world, ahead of France and Germany. The main reasons: a unique combination of natural and cultural environment and good transport and T&T service infrastructures. Spain has repeated its top ranking although, just a few years ago, it was not even among the first five. Someone has been working hard.
Aware of the advantages brought by differentiation, the sector has made a particular effort to increase the quality of its supply. More than 50% of Spain’s hotel accommodation is currently four or five stars, its accomodation firms are more productive than their European peers and the country has more restaurants than ever on the most famous lists of top eateries. But there is still plenty of room for the sector to improve, in hotels, restaurants and also other T&T services. The larger companies in the T&T sector (and in general in any other sector) can take better advantage of economies of scale, tend to be more professional, enjoy better financing conditions, can invest more to spread their business across all seasons and offer higher quality jobs.
There are clear opportunities for the sector to grow in the long term. By its very nature, tourism is a sector of the future since the proportion of expenditure allocated by households to tourism tends to increase with their income level. Consequently, it is very likely that emerging countries will represent a growing source of tourists, as we are starting to see with China. On the other hand, the ageing population in Europe and other advanced economies is creating a very attractive demand since older people have relatively high incomes and tend to travel outside the peak tourist seasons. Finally, new technologies also offer a world of opportunities, for instance to improve client experience by providing personalised local experiences.
In fact, new technologies and their associated new types of business represent one of the biggest challenges for the sector in the short term. The sharing economy can help to improve competitiveness and complement the traditional T&T supply. But a legislative framework is urgently needed that offers legal certainty and fair rules for all T&T players, at the same time as promoting sustainable growth for the sector and promoting good coexistence between locals and tourists.
Enric Fernández
Chief Economist
31 May 2017
To read below

The central banks make moves

Investment is of capital importance

A good 2023. But what about 2024?
Sustainable Tourism as a Driving force of the Tourism Industry in a Post-Covid-19 Scenario
Affiliations.
- 1 Department of Business Organization and Marketing, Faculty of Business Studies, University of Pablo de Olavide, Carretera Utrera, Km.1, 41013 Seville, Spain.
- 2 Department of Business Organization, Faculty of Law and Business, University of Córdoba, Puerta Nueva s.n., 14071 Córdoba, Spain.
- PMID: 34149146
- PMCID: PMC8197604
- DOI: 10.1007/s11205-021-02735-2
The tourism industry is probably one of the most affected by the crisis caused by Covid-19. It is the responsibility of politicians, tourism professionals and researchers to look for solutions to revive this important industry. This article shows how the development of Sustainable Tourism can help in the sustenance of the tourism industry, since one of the premises on which Sustainable Tourism is based is the non-overcrowding of tourist destinations (essential factor in the current context). Considering this argument and the existing regulations on lockdown rules, social distancing and meet up, it is considered that the practices in Sustainable Tourism can become a potential solution to stimulate tourist movements and help the revival of the tourism industry. Therefore, more specifically, the main objective of this article is to know tourist´s perception among about Sustainable Tourism and to determine which factors help its development. In this sense, the use of structural equation models in a research of 308 tourists has determined how factors related to the tourists' attitude, motivation and perceived benefits provided by the development of Sustainable Tourism increase the intention to consume this type of tourism.
Supplementary information: The online version contains supplementary material available at 10.1007/s11205-021-02735-2.
Keywords: Factors; Mass tourism; Overcrowded destinations; Sustainable Tourism development; Sustainable tourism; Tourism crisis.
© The Author(s), under exclusive licence to Springer Nature B.V. 2021.
Browse Econ Literature
- Working papers
- Software components
- Book chapters
- JEL classification
More features
- Subscribe to new research
RePEc Biblio
Author registration.
- Economics Virtual Seminar Calendar NEW!

Sport Tourism as Driving Force for Destinations’ Sustainability
- Author & abstract
- 8 References
- Most related
- Related works & more
Corrections
(Centre for Research and Technology Hella, Hellenic Institute of Transport, 57001 Thessaloniki, Greece)
(Department of PE and Sport Science, Aristotle University of Thessaloniki, 57001 Thessaloniki, Greece)
Suggested Citation
Download full text from publisher, references listed on ideas.
Follow serials, authors, keywords & more
Public profiles for Economics researchers
Various research rankings in Economics
RePEc Genealogy
Who was a student of whom, using RePEc
Curated articles & papers on economics topics
Upload your paper to be listed on RePEc and IDEAS
New papers by email
Subscribe to new additions to RePEc
EconAcademics
Blog aggregator for economics research
Cases of plagiarism in Economics
About RePEc
Initiative for open bibliographies in Economics
News about RePEc
Questions about IDEAS and RePEc
RePEc volunteers
Participating archives
Publishers indexing in RePEc
Privacy statement
Found an error or omission?
Opportunities to help RePEc
Get papers listed
Have your research listed on RePEc
Open a RePEc archive
Have your institution's/publisher's output listed on RePEc
Get RePEc data
Use data assembled by RePEc
Tourism Web Portal
About the portal.
A technological tool for effective communication between the leading players in the Moscow tourism market and representatives of the foreign/regional tourism industry through online events. OBJECTIVES: • Building long-term cooperation with foreign/regional representatives • Raising awareness among foreign/regional representatives of the tourism industry of the tourism opportunities, measures and attractiveness of the city of Moscow in the field of tourist infrastructure development
Moscow City Tourism Committee
The Tourism Committee, or Mostourism, is the executive body of the Moscow City Government that oversees tourist activities in the capital. The Committee is responsible for legislative initiatives, congress and exhibition activities, and event and image projects. As the brand manager for an attractive tourism image for Moscow, Mostourism constantly analyses global trends, offers Russian and foreign tourists what they want, and also uncovers new opportunities for the capital in terms of interesting and rewarding leisure activities.
ANO «Project Office for the Development of Tourism and Hospitality of Moscow»
Syundyukova Yulia [email protected] Mezhiev Magomed [email protected]
Video materials about Moscow

Moscow Travel Guide: Interesting Facts and Tourist Maps
Moscow facts, what is moscow how big is moscow when was moscow founded when did moscow became the capital of russia is moscow in europe or asia and, finally, moscow tourist attractions and travel guides... all of this information can be found here in a single article. read it and be ready for your moscow vacations.
Moscow attractions
- Red Square (St Basil’s cathedral, Lenin's tomb, Kremlin, GUM, State Historical museum)
- KGB headquarters
- Moscow metro stations
- Christ the Savior cathedral (very beautiful but new)
- Tretyakov gallery (amazing paintings)
- Bolshoi theatre (its a legend...)
- Arbat and Tverskaya street (nice streets for walking)
- Novodevichy convent (ancient beautiful monastery in the centre of Moscow)
- Sparrow hills (Moscow University - monumental building of Stalin's epoch)
- «VDNH» (Museum of Space Exploration - monumental building of Stalin's epoch)
- Victory Park (memorial complex of Stalin's epoch)
- Secret Soviet bunker (65 meters by stairway to secret soviet bunker)
- Eliseevsky grocery store (shop with amazing interior left from 19th century)
- Gulag museum (dark sides of soviet history)
- Tsaritsino and Kolomenskoye parks (nice parks for walking in good weather with royal palaces)
- Moscow zoo (best place for families with children)
- Izmaylovo palace (modern but nice)
During the tour, we will escape the bustling center of Moscow to explore the ordinary life of people in the «rusty belt of Moscow». I will show you many pieces of the local life that will give you the complete picture of the Real Moscow at the end of the tour.
We will visit areas that are perfect to represent how Russian epochs have followed one another. Many years ago, the place was a far suburb of Moscow full of wooden houses. Then industrial revolution came to change cozy houses into the factories. USSR worsen the situation, turning whole area into the industrial zones of heavy machinery. Many years after, sleeping districts grew there to give a place to a new generation of Soviet people. Then Moscow became so huge, that such a godforsaken area suddenly turned into the very valuable land with a modern apartment complexes raising here and there out of nothing.

For a second part of our adventure, you will visit a network of underground limestone caves with an experienced caver guide. Depending on your adventurism, you can either wander in some easily accessible and beautiful cavern halls or you can search the depths of remote parts and the most challenging kilometers of a lengthy underground network!
Finally, after a long day of exploring, you will have a lovely meal of our traditional food and enjoy a blazing campfire.
Do you want to explore it by yourself? Find Top 10 attractions in Moscow
2018 Primetime Emmy & James Beard Award Winner
R&K Insider
Join our newsletter to get exclusives on where our correspondents travel, what they eat, where they stay. Free to sign up.
A History of Moscow in 13 Dishes
Featured city guides.

15 Top-Rated Tourist Attractions & Things to Do in Moscow
Written by Diana Bocco Updated Dec 23, 2023 We may earn a commission from affiliate links ( )
Moscow is one of Europe's most enigmatic destinations, home to a fascinating history and colorful, awe-inspiring architecture you won't find anywhere else in the world. Moscow might be one of the most populous cities in the world with over 11 million inhabitants, but this hasn't changed its strong cultural and social traditions.
Walk the cobblestone streets of the Red Square or the banks of the Moskva River early in the morning, and it's hard to tell what century you're in.
Tsarist architecture, must-see churches, and glamorous shopping opportunities blend together for a visual experience you won't forget. For ideas on what to see and do while visiting Russia, here's our list of top tourist attractions in Moscow.
1. Marvel at the Size of the Kremlin
2. catch a performance at the bolshoi theatre, 3. shop at the luxurious gum, 4. make your way into lenin's mausoleum, 5. spend an hour (or three) at red square, 6. discover history at the museum of cosmonautics, 7. ride the stunning moscow metro, 8. explore the moscow state integrated museum-reserve, 9. spend a rainy day at the tretyakov gallery, 10. walk up and down arbat street, 11. stop by the vdnkh all-russian exhibition centre, 12. wander around gorky park, where to stay in moscow for sightseeing, map of tourist attractions & things to do in moscow.
Moscow's most recognizable structure is without a doubt the Kremlin, a 15th-century fortified complex that covers an area of 275,000 square meters surrounded by walls built in the 1400s.
The Grand Kremlin Palace -which has over 700 rooms- was once home to the Tsar family and is now the official residence of the president of the Russian Federation, although most heads of state choose to reside elsewhere.
The massive complex also includes many other buildings, some of which are open to the public and can be visited regularly. Aside from three cathedrals (including one where the Tsars were once crowned) and a number of towers, the Kremlin is also home to the Armory building, a museum holding everything from the royal crown and imperial carriages to the ivory throne of Ivan the Terrible and Fabergé eggs.
The Bolshoi Theater is home to the largest and one of the oldest ballet and opera companies in the world . While the theater has undergone several major renovations over the past century-including a recent one in 2011 to restore some of the imperial architectural details-it still retains all of its Neoclassical grandeur.
The Bolshoi Theater you see today opened in 1824, after several older versions burned down. Inside, red velvet, a three-tiered crystal chandelier, and gilt moldings give the place a Byzantine-Renassaince grandiose feel like no other.
Catching a show from the resident ballet and opera troupes is a treat, as the theater often presents a number of classic performances, such as Tchaikovsky's Mazeppa and Rachmaninoff's Francesca da Rimini, both of which originally premiered here.
Moscow's oldest and most upscale shopping center is an architectural marvel. GUM (short for Glávnyj Universálnyj Magazín or "Main Universal Store") was built in the late 1800s in neo-Russian style to showcase a beautiful mix of a steel skeleton and 20,000 panels of glass forming an arched roof.
This was a unique construction at the time, since the glass had to be strong enough to support the snow-heavy Russian winters. The building is just as impressive outside, with all three levels covered in marble and granite.
While GUM is no longer the largest shopping center in Moscow, it's still by far the most beautiful. Home to brands like Gucci and Manolo Blahnik, this might not be the ideal destination for most budget-conscious visitors, but the beauty of the building itself is worth a visit.
On the third floor, there are also great dining options, including a Soviet-style canteen that serves traditional Russian food, and a stand selling ice cream made by hand using an original 1954 recipe originally approved by the Soviet government.
Lenin's Mausoleum, the final resting place of Soviet leader Vladimir Lenin, occupies a central spot in Red Square. His body has been in the mausoleum since his death in 1924-and although the original plan was for him to be buried after a short period of public display for mourning, the plan quickly changed.
After over 100,000 visited the tomb over a period of six weeks, it was decided that a new sarcophagus and a more permanent display space could actually preserve Lenin's body for much longer than expected-and Lenin's Mausoleum was built.
Over the years, the mausoleum and its marble stairs also became the main spot from where Soviet leaders would watch parades and events happening in Red Square.
Lenin's embalmed body can still be seen today, lying down in a bulletproof glass sarcophagus as if he's sleeping. While a visit to the mausoleum is certainly unusual, it has become a must-do for history buffs looking to understand how Lenin's legacy truly changed the nation. Come ready to wait, though -there are usually lines to get in.
All of Moscow's main streets start at Red Square, so it's easy to see why this is considered the heart of the city. A massive space of 330 meters by 70 meters, the square is flanked by the Kremlin, Lenin's Mausoleum, two cathedrals, and the State Historical Museum.
In 1945, a massive Victory Parade was held here to celebrate the defeat of Nazi Germany by the Soviet Armed Forces.
St. Basil's Cathedral , one of the most recognizable buildings on the square, was built in 1555. The unique cathedral has architectural details inspired by Byzantine and Asian design, as well as details that resemble those found in famous mosques. There are nine individual chapels inside the church, all decorated with colorful mural art.
Both the square itself and the Kremlin are recognized as UNESCO World Heritage Sites . On weekends, there are sometimes stalls selling souvenirs and traditional items here, such as matryoshka (Russian nesting dolls), at the entrance of the square.
At one point, Russia and the US were toe-to-toe when it came to space exploration. While that might no longer be the case, the museum's amazing collection-which includes over 85,000 items-is still awe-inspiring.
Main exhibits include the space capsule used by Yuri Gagarin , the first human to travel into outer space; a USSR flag with moon fragments; a Soviet spacesuit; and a rocket propulsion unit from the 1960s. A special two-story hall showcases sections of the Mir space station interior, and there are also models of the first sputniks and a replica miniature spaceship.
English-language tours are available, and there's also a Cinema Hall showing subtitled short films about the history of space exploration programs and the first manned space flight.
The museum is located inside the base of the monument to the Conquerors of Space, which was built almost 20 years before the museum opened.
Riding the Moscow metro is an experience all in itself, but even just heading underground to walk through the stations is something no visitor should miss. With 223 stations and 12 metro lines crosscutting through Moscow, however, this can be tricky, so visiting at least a few of the most impressive ones is a good start.
Arbatskaya station was designed by a skyscraper architect, so it's no surprise that it features multicolored granite slabs and impressive bronze chandeliers.
Park Kultury station , located next to Gorky Park, is covered in marble and features reliefs of people involved in sports, while Teatralnaya station is decorated with porcelain figures dancing and wearing traditional Russian costumes.
The metro is open between 5:30am and 1:00am but it's very crowded in the early morning and after 4pm, so it's better to visit in the late morning or early afternoon to really appreciate the architecture without the crowds.
The Moscow State Integrated Art and Historical Architectural and Natural Landscape Museum-Reserve is a cultural open-air museum complex comprised of four different historical sites.
The most important site, the Kolomenskoye Estate, was once the summer residence of Tsars as far back as the 14 th century. The complex, which covers almost 300 hectares, is home to fairy-tale wooden palaces; a tent-roof stone church built in the 1500s; a water tower; fort towers and structures; and the 24-room Museum of Wooden Architecture , which includes the restored dining room of Tsar Alexei I.
Beautiful manicured gardens , riverside picnic areas, and a massive collection of both artifacts and structures make this a great destination to help you see what medieval Russia looked like. English-language tours are available, but you're also free to wander the grounds on your own.
The largest collection of Russian art in the world sits here, with over 180,000 paintings, sculptures, and religious art dating back to over a millennia ago. The gallery, built using beautiful red and white colors from classical Russian architecture, is located near the Kremlin and it was built in the early 20 th century.
Significant art pieces include the Vladimir Mother of God; a Byzantine icon of the Virgin and child dating back to the 1100s; Andrei Rublev's The Trinity icon from the 15 th century; and several works by Ilya Repin, the most famous realist painter in Russia.
On the grounds of the museum, there is also an 86-meter-tall statue of Peter the Great, as well as a number of Socialist Realism sculptures.

Moscow's one-kilometer-long pedestrian street has been around since the 15 th century. Originally a trade route in the outskirts of the city, Arbat Street is now very centrally located, home to posh buildings and lots of places to eat and shop.
Beautiful street lamps and two significant statues-one of Princess Turandot (from Puccini's last opera) and one of Soviet-era poet Bulat Okudzhava-adorn the street, which fills up with both locals and tourists on evenings and weekends.
A great place to pick up souvenirs or sit down at an outdoor café, Arbat Street also offers a chance to visit the former home of poet Alexander Pushkin and the café both Anton Chekhov and Leo Tolstoy used to visit.
Although it was originally designed as a general-purpose trade show venue, this park complex now houses amusement rides , ice rinks , and a number of galleries and other attractions for all ages.
The park's most famous landmarks are the Moskvarium, a marine biology center home to over 8000 species of marine animals, the Garage Museum of Contemporary Art, and a shopping center selling traditional products from former Soviet countries.
There's even a film museum showing Soviet cartoons or even a full-length film (for an extra fee) and an education center offering masterclasses on everything from becoming a barista to video montage (call or write in advance to find out which ones are English-friendly).
Soviet-era pavilions, sculptures, and fountains abound here as well, including the famous Friendship of the Peoples Fountain, which features statues of women dressed in costumes from different former Soviet countries.
Named after the famous Russian writer Maxim Gorky (who was nominated for the Nobel Prize in Literature five times but never won it) and sitting right across the Moskva River, Gorky Park covers 120 hectares of beautiful ponds and green spaces.
Popular with both locals and tourists, the park offers a variety of things to enjoy-from sunbeds, hammocks, and drinking fountains to free yoga classes and children's playgrounds. There's free Wi-Fi and sockets for charging your phone, as well as many food stands and plenty of wild animals, including deer, rabbits, and pheasants.
Visitors can rent paddle boats and bicycles to explore the park-and from May to October, there is also an open-air movie theater, as well as scheduled presentations by street performers, musicians, and artists. Gorky Park attracts the young and old, so don't be surprised to see a mix of people exercising, playing chess, and sunbathing.
Luxury Hotels :
- Lotte Hotel Moscow is one of the top 5-star properties in Moscow offering the largest Royal Suite in Russia. The trendy rooms and suites here all have contemporary style and great city views. On-site amenities are plentiful. There are two restaurants: one serving contemporary Italian fare, and the other Japanese. There is an impressively lit indoor swimming pool, a well-known spa, and a state-of-the-art gym.
- Another excellent luxury hotel is the Ararat Park Hyatt Moscow . The residential-style property is in the heart of Moscow just next to the Bolshoi Theatre and within walking distance of the Kremlin and Red Square. The rooms and suites have been opulently designed by Tony Chi. The on-site restaurant serves a mix of European and Armenian specialities. There is also a Japanese sushi bar and a rooftop lounge with fabulous city views.
- The St. Regis Moscow Nikolskaya also has a central location just a few minutes from the Kremlin and Red Square. The 5-star property has a mix of elegant rooms and suites, including interconnecting room options for families with kids. There are multiple restaurants on-site including an Italian bistro. Other amenities include the fabulous Iridium Spa, which does a full range of treatments and has an indoor swimming pool, sauna, and steam room.
Mid-Range Hotels :
- Palmira Business Club is a top mid-range choice. The contemporary lifestyle hotel offers well-appointed rooms and suites, including options for families. Suites are quite spacious and have kitchenettes. Amenities here include a complimentary breakfast at the on-site restaurant, a hot tub, sauna, and spa. There is also a fitness center.
- The trendy Mercure Moscow Baumanskaya offers a mix of rooms and suites with contemporary decor. The mid-range hotel can arrange airport transportation and offers baggage storage. Other amenities include a restaurant and room service. The front desk is open 24 hours.
- Boutique Hotel Brighton is about 10 minutes from the city center in a leafy park area. It offers excellent value for money and has charming rooms and suites with sound-proof windows and doors, as well as blackout curtains. A complimentary breakfast is served, and there is also an indoor swimming pool.
Budget Hotels :
- Hotel Ibis Budget Moscow Panfilovskaya is about a 15-minute drive from Moscow's downtown, and it's within walking distance from a metro station that will take you there. The soundproof rooms at this budget property are clean, comfortable, and can sleep up to three people. The hotel is pet friendly, has paid parking available on-site, and also has a salon.
- If you just need a budget hotel near the airport then check out Aviator Hotel Sheremetyevo . Located right at the airport, it has soundproof rooms, including options for families. Amenities include an indoor play area for kids, a sauna and swimming pool, and a free breakfast.
More Related Articles on PlanetWare.com
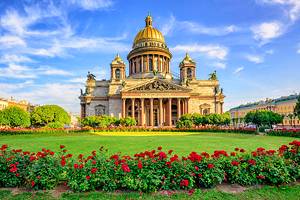
Exploring Russia: Whether you are interested in history, nature, or architecture, there's much to see in Russia. For a good introduction to some of the most fascinating spots in the country, take a look at our article on the Best Places to Visit in Russia . For more on Russia's second-largest city and all it has to offer, check out our piece on the Top-Rated Tourist Attractions in St. Petersburg .

Thousands protest in Spain's Canary Islands over mass tourism
- Medium Text
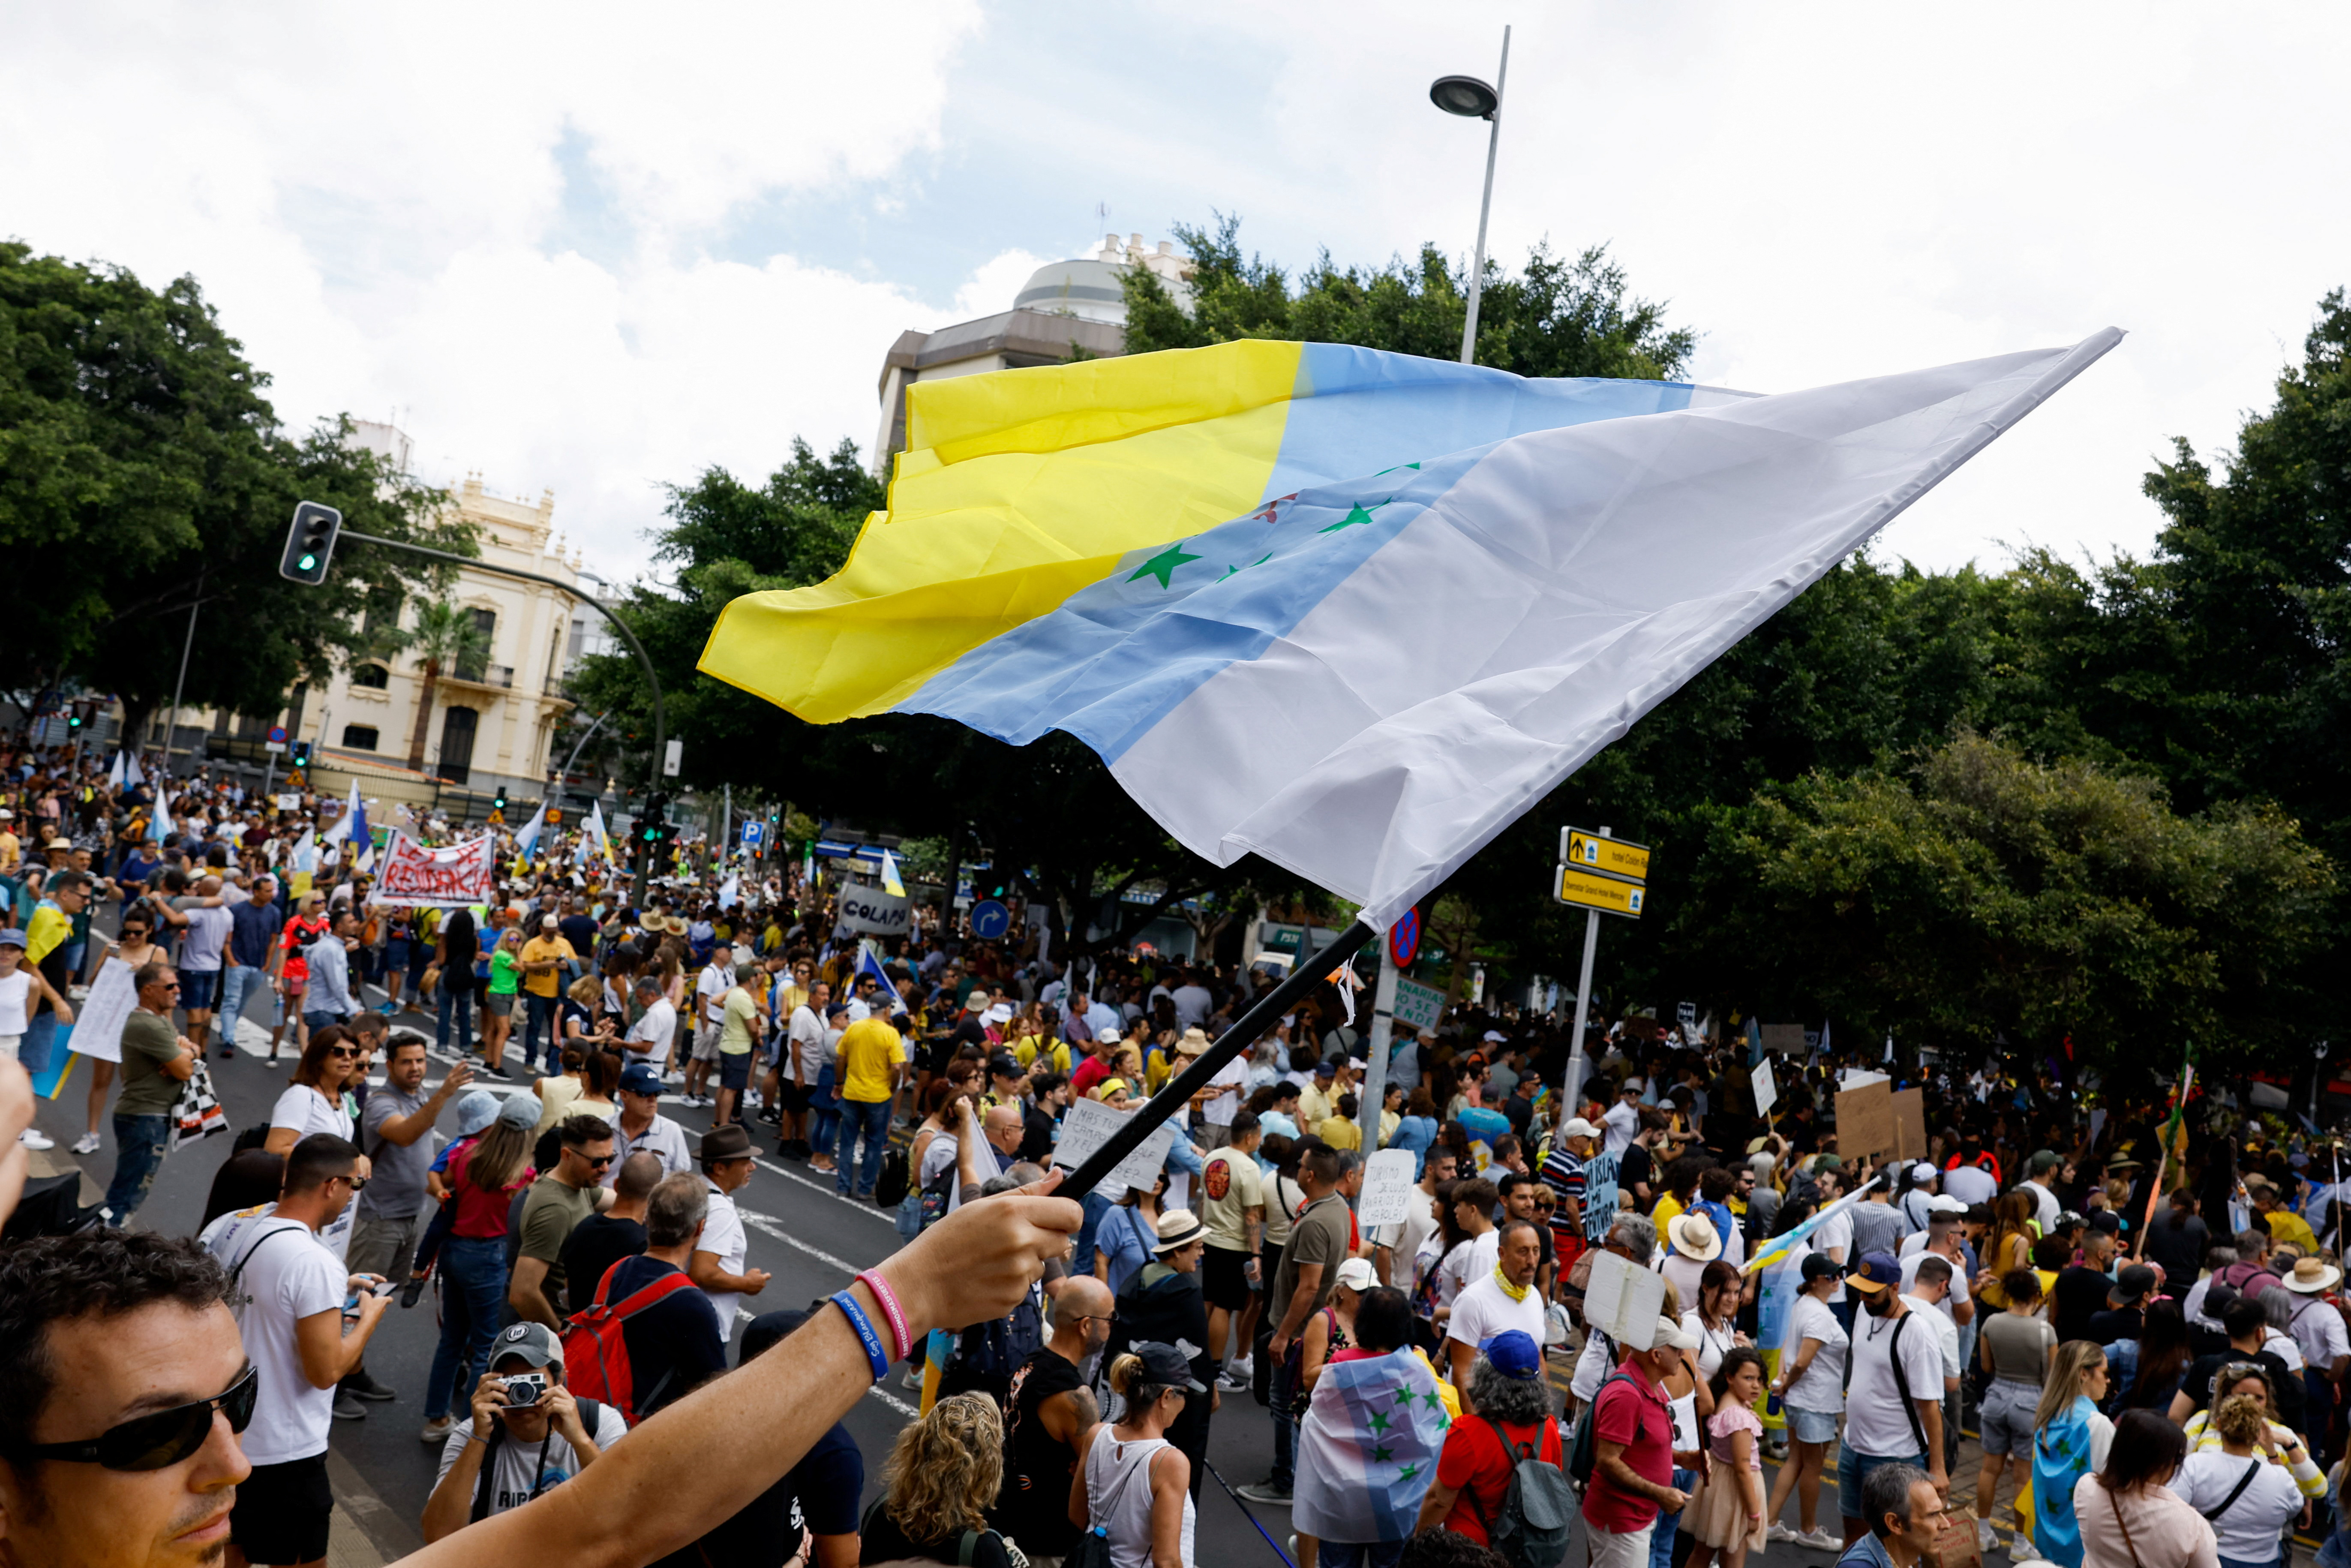
Sign up here.
Reporting by Borja Suarez Writing by Ana Cantero Editing by Helen Popper
Our Standards: The Thomson Reuters Trust Principles. New Tab , opens new tab
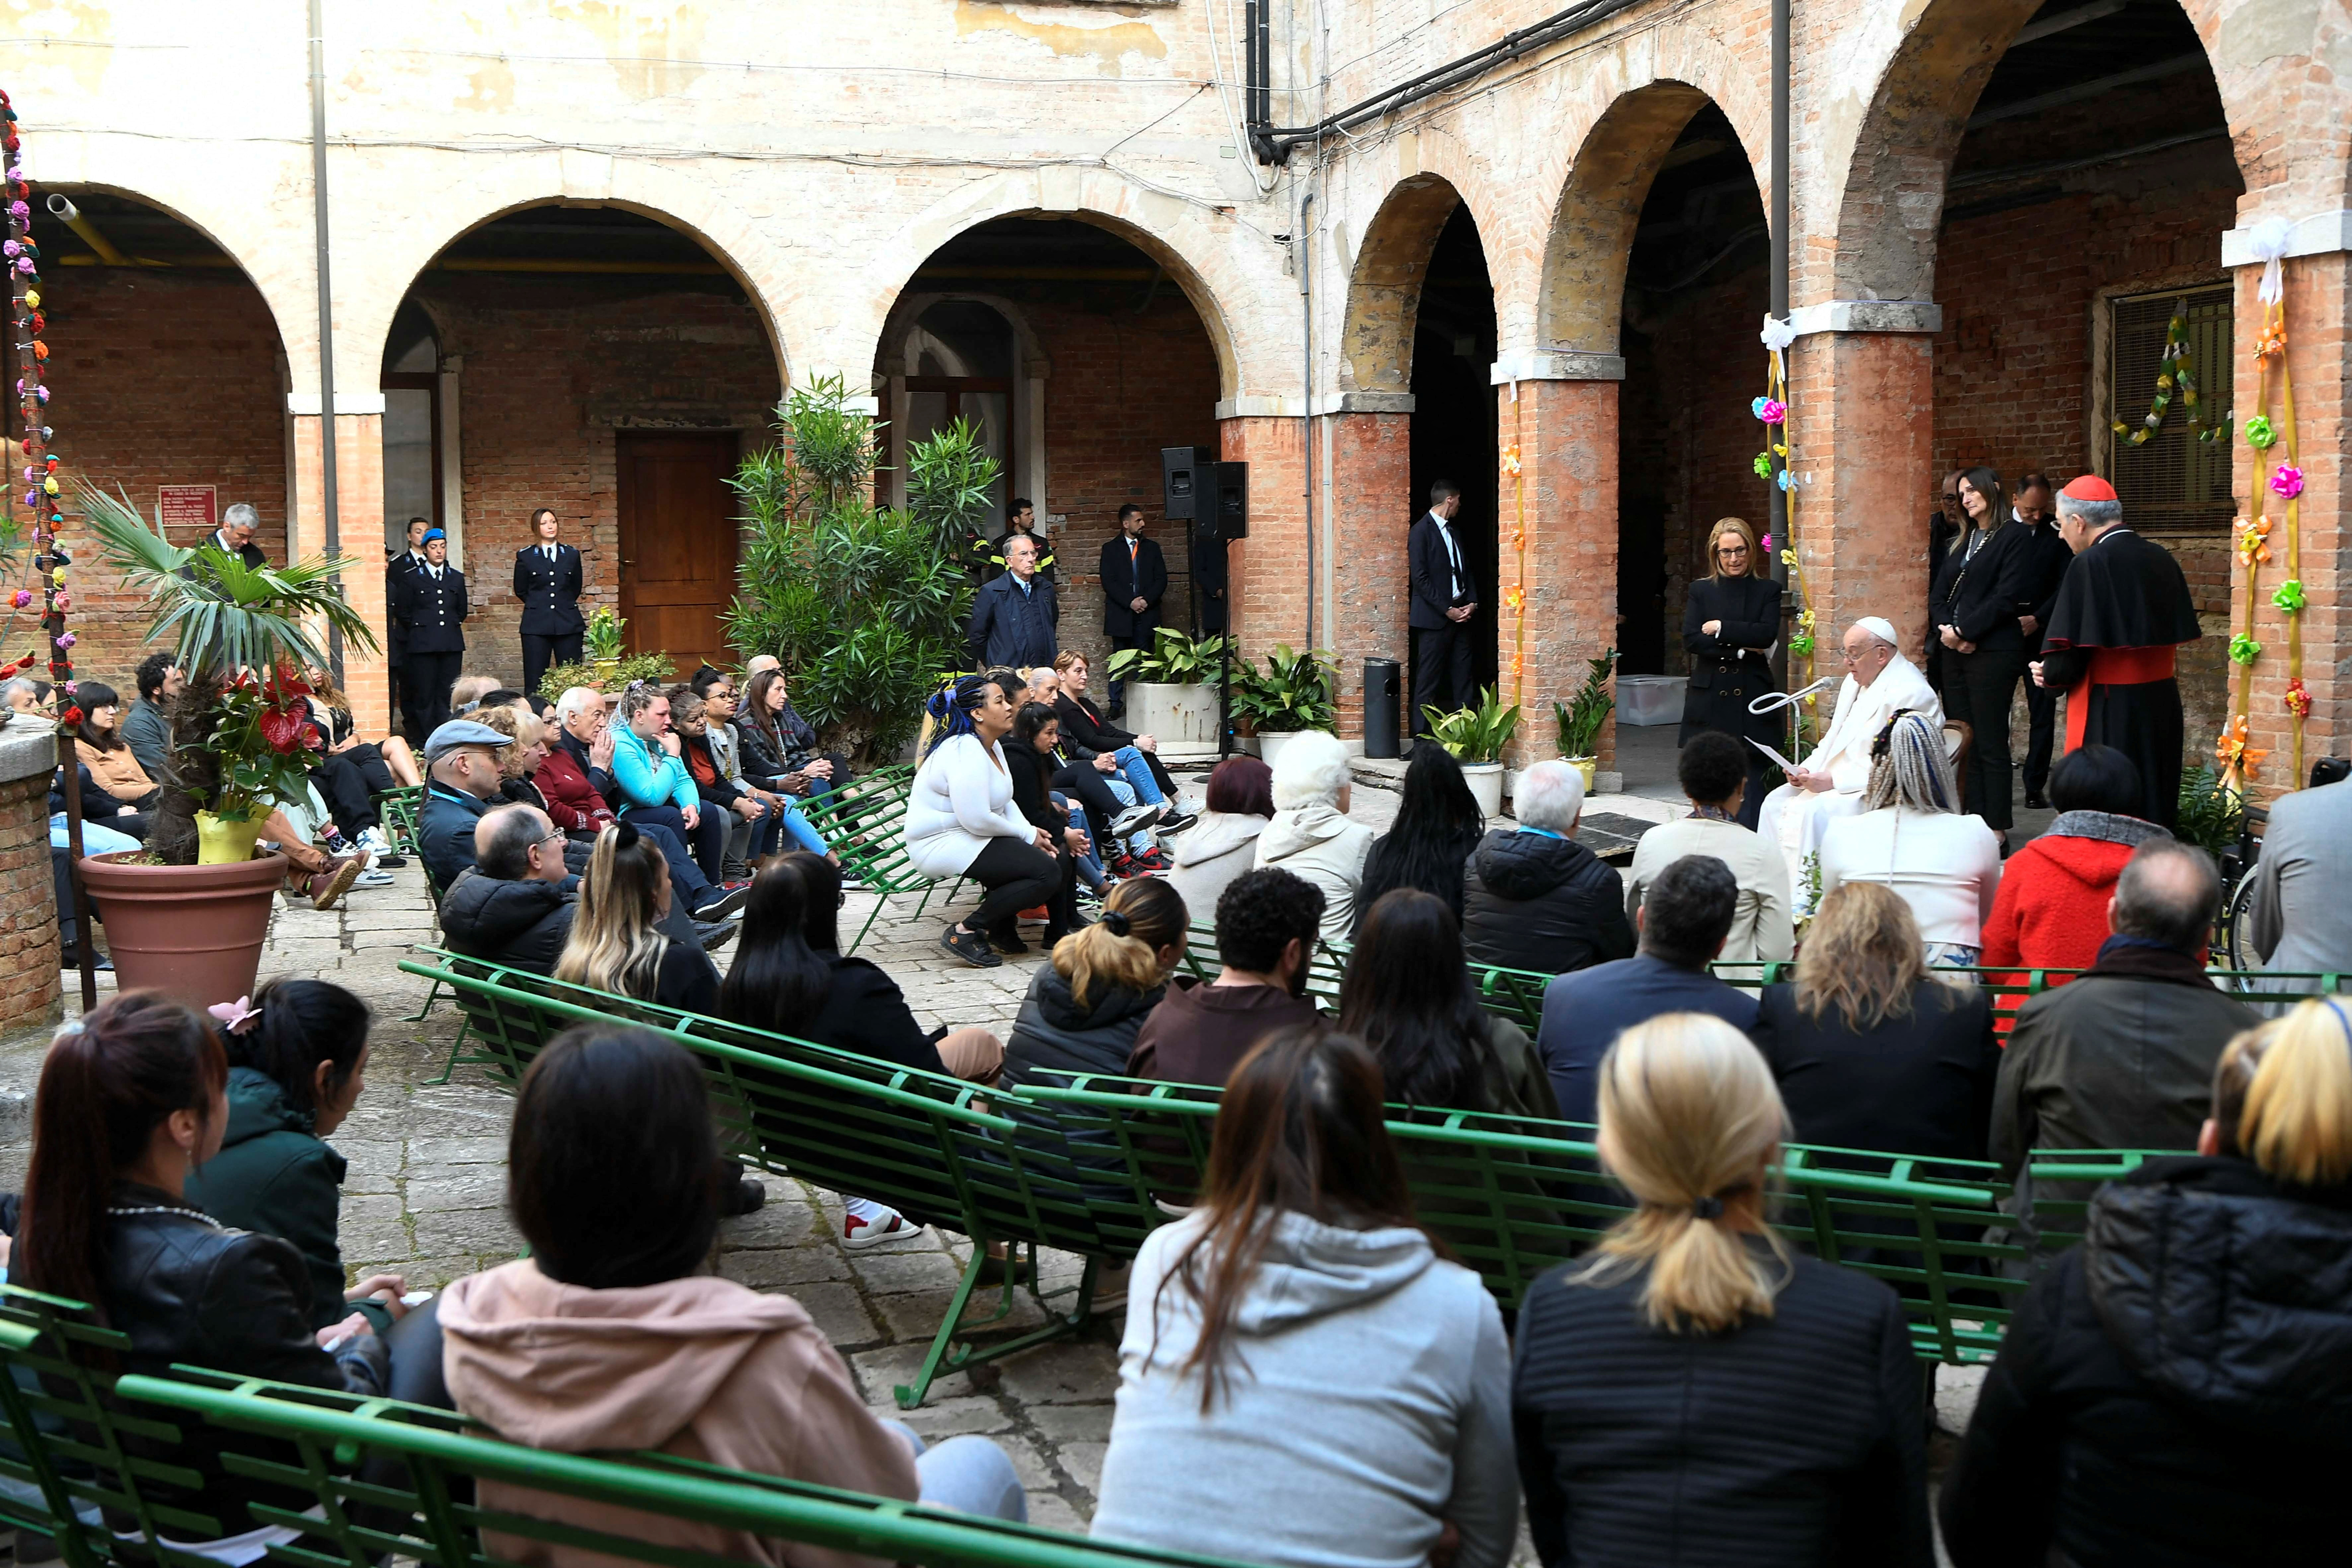
World Chevron
A Hamas delegation will visit Cairo on Monday for talks aimed at securing a ceasefire, a Hamas official told Reuters on Sunday, as mediators stepped up efforts to reach a deal ahead of an Israeli assault on the southern city of Rafah.

Pay to enter: Venice becomes the first city to implement a tourist ticket system
Venice became the first city in the world on Thursday to introduce a payment system for visitors in an experiment aimed at dissuading tourists from arriving during peak periods.
However, it isn't the only place in Italy that has recently introduced new measures aimed at slowing tourist flows.
Here are some of the initiatives currently in force.
Venice tourist tax
The lagoon city has introduced 5 euros (about $5.35) tickets for day trippers, valid from 8:30 a.m. to 4 p.m. The experiment came into force on April 25, a national holiday in Italy. Tickets will be needed for the following 10 days and thereafter for most weekends until mid-July.
Venice residents, students, workers, and homeowners are exempt from paying or booking a slot. Visitors aged under 14 and tourists with hotel reservations will need to register, but access for them will be free of charge.
Other cities, such as Como, have said they are considering introducing a similar measure but are waiting to see how the Venice initiative works before deciding.
In addition, Venice has said that from June, it will limit the size of tourist groups to 25 people and ban the use of loudspeakers by tour guides.
Florence tourist measure
Florence announced in October that it was banning new short-term residential lets on platforms such as Airbnb in its historic center. It also offered three years of tax breaks to landlords of short-term holiday lets who start offering ordinary leases for residents.
The city's famous museum, the Uffizi, offers discounts to people who arrive before 8.55 a.m. and lower prices off-season. To spread out crowds, it also closes at 10 p.m. once a week.
Cinque Terrer overtourism
The five villages that make up the Cinque Terre on the Italian Riviera regularly get swamped with visitors.
To try to reduce the overcrowding at peak periods, the authority which oversees the area said this week it would charge visitors 15 euros (about $16) to walk the most celebrated coastal path. In addition, the path can only be walked in one direction.
Capri tourism measure
The picturesque small island that lies across the bay from the southern city of Naples has doubled its entry fee, which is automatically added to ferry tickets, to 5 euros. The fee will be charged from April 1 to October 1.
Capri, Ischia, Procida, Lampedusa and Linosa changes
These islands have introduced limits, or outright bans, on cars for non-residents during the main tourist season.
For Dasha Wagner, experimentation is the driving force of creativity

Dasha Wagner has seen a great deal in her more than 15 years as a digital designer and illustrator. She has worked with several global brands like Aveda and Southeastern Grocers, non-profit organizations like AIGA, and small publishing houses like Paradigm Education Solution. Dasha has won multiple prestigious awards for her design and art projects and exhibited her works around the world — from Basel to Beijing. Dasha's artworks have also been featured in several books and magazines. She was also an early adopter of augmented reality (AR) and NFT art, pioneering new forms of digital expression.
Despite the depth and breadth of her experience, Dasha is also the first to say she hasn’t seen it all. “If I want to stay on track, I have to keep learning, whether it’s exploring new mediums or being the first to try the latest design technologies,” she says.
Adobe’s design technologies have been a driving force in Dasha’s artistic journey, helping her to master new creative approaches and mediums. She points to Adobe’s family of generative AI models, Adobe Firefly , as an example.
“When Firefly first launched, I started playing around with the new capabilities in Adobe Creative Cloud right away and got hooked,” she says. “Adobe did the right thing by making Firefly accessible to creators and designers from day one. Once you experience the power of generative AI, it immediately becomes less intimidating.”
Futuristic creations inspired by the past
Dasha is particularly interested in making design technology accessible to aspiring creators. Born in Russia, she left the country in 2004 to study graphic design and art education at the University of Northern Iowa before becoming an art teacher. But it was Adobe’s creative software that empowered Dasha to finally pursue her own art and eventually become a full-time graphic designer.
“Adobe’s new technologies allowed me to complement my day job with passion projects that helped me find my artistic voice. When my work started to gain traction and bring in commissions, a new world of possibilities opened up and I haven’t looked back since,” she says.
Dasha’s aesthetic is rooted in the Japanese art of ikebana, which is grounded in simplicity and the symbolic arrangement of shapes and textures. But while her creations are inspired by the past, she uses tools like Adobe Substance 3D, Adobe Aero , and Adobe Firefly to channel this centuries-old philosophy into futuristic designs that are as unique as they are beautiful.
“I love experimenting with light and textures. Adobe Substance allows me to do that while forcing me to work outside traditional graphic design paradigms like posters or calendars. It keeps things interesting and helps to set my work apart,” says Dasha.
Gaining speed and peace of mind with generative AI
When it comes to generative AI, Dasha is overwhelmingly positive about the technology’s power to accelerate the creative process and improve the quality of her work. For instance, the Text Effects capability in Firefly allows her to create advertising posters in seconds, and then add her unique touch to the final designs.
Similarly, the generative AI features in Adobe Photoshop have sped up Dasha’s image editing process by orders of magnitude. She also uses Firefly to create decorative patterns in her unique modern style, which she can later apply to packaging and product design projects.
Like many designers, Dasha Wagner uses stock imagery in many of her creations. Thanks to Firefly capabilities in Adobe Stock , she can find and transform the assets she needs faster than ever. “Designers used to spend hours searching for the right images through Stock. With the Adobe Firefly text-to-image tool, I can generate any assets I need in seconds.” says Dasha.
“One of people's main concerns about generative AI is around intellectual property rights. The transparency I get with Adobe Content Credentials only sweetens the deal. On top of finding better images than I would using manual search, I don’t have to worry about where they come from because information from the creator is attached to each image,” she adds.
Part of the Adobe Content Authenticity Initiative, Content Credentials is a solution built in an open way so that it can be incorporated into other products and platforms. It allows creators to attach information to a piece of content — like their names, dates, and the tools used to create it. Those credentials travel with the content, so that people know exactly where the content came from and what happened to it along the way.

Dasha’s 3D creations, inspired by the Japanese art of ikebana; images source: Dasha Wagner.
This combination of speed and peace of mind lends itself well to the world of NFTs where artists can only list each of their creations on a single marketplace. Using Adobe Firefly, Dasha Wagner can source and transform her images at speed, which helps to ensure every NFT she releases is completely original.
Dasha also appreciates the way Firefly has improved communications between her and her clients. Designers often use a different vocabulary than marketers to discuss their work, which can make it difficult to align on creative approaches. The fact that Dasha and her marketing clients can generate images together in Firefly by using simple verbal prompts has helped to eliminate that communication barrier, opening up new avenues of collaboration instead.
Chasing the sweet spot between digital and human creativity
With the time she saves using generative AI, Dasha is now broadening her creative palette, experimenting with hyper-realistic art, and incorporating color and styles like pastel and watercolor into her work.
At the same time, Dasha stresses the importance of maintaining human touch in her art to keep it compelling and unique. “AI is an incredibly powerful tool, but it’s not a human,” she says. “It’s our job as designers to create art that connects at the human level, whether it’s a simple 2D poster or a fully interactive NFT composition.”

Dasha Wagner — image source: Dasha Wagner.
Dasha’s advice to young creatives born in today’s digital-first world? Go to museums and learn to appreciate the importance of craftsmanship and patience. See how people used to create in the past, sometimes taking years to complete a single piece of art.
“Nobody is saying you need to spend your life on a single creative pursuit, but it’s crucial to think about what you want to create before thinking about how you’re going to create it,” she says. “That’s the best way to develop your professional judgment and use powerful technologies like Adobe Firefly in a healthy and constructive way.”
Learn more about Dasha and her award-winning work on Instagram .
Ready to unlock your new levels of creativity in your own work? Get started with Adobe Firefly and Adobe Substance 3D today.
https://blog.adobe.com/en/publish/2024/02/01/jayson-robertson-takes-generative-ai-to-street
https://blog.adobe.com/en/publish/2024/03/19/tobi-shinobi-remixes-art-whats-possible-adobe-firefly
https://blog.adobe.com/en/publish/2023/10/10/2023-creators-to-watch

IMAGES
VIDEO
COMMENTS
Tourism motivation is a driving force that motivates people to go on holiday or visit destinations. Beerli and Martin ( 2004 ) describe the motivation to travel as an internal need that drives an individual to act in a certain way to achieve his desired satisfaction.
Tourism is one of the driving forces of global economic growth and is considered an effective sector for achieving decent work1 and economic growth in developing countries, especially so for the least developed countries (LDC) and landlocked developing countries (LLDCs) - a recognition reflected explicitly in Target 8.9. ...
As travel resumes and builds momentum, it's becoming clear that tourism is resilient—there is an enduring desire to travel. Against all odds, international tourism rebounded in 2022: visitor numbers to Europe and the Middle East climbed to around 80 percent of 2019 levels, and the Americas recovered about 65 percent of prepandemic visitors 1 "Tourism set to return to pre-pandemic levels ...
GENEVA (ILO News) - Tourism is a major engine for job creation and a driving force for economic growth and development, as highlighted by recent figures. According to the World Travel and Tourism Council data, in 2015 tourism directly created over 107 million jobs (3.6 per cent of total employment representing 3 per cent of total GDP) and ...
Tourism is one of the driving forces of global economic growth and is considered an effective sector to achieving decent work and economic growth in developing countries, especially so for the LDCs, LLDCs - a recognition reflected explicitly in Target 8.9 "By 2030, devise and implement policies to promote sustainable tourism that creates jobs
Driving forces of tourism demand Influencing factors of tourism demand. Figure 8 showed the explanatory power of the driving factors for tourism demand in 2011 vs. 2018. In 2011, The number of ...
Tourism is one of the driving forces of global economic growth and is considered an effective sector to achieving decent work and economic growth in developing countries, especially so for the LDCs, LLDCs - a recognition reflected explicitly in Target 8.9 "By 2030, devise and implement policies to promote sustainable tourism that creates ...
Decent work opportunities in tourism, particularly for youth and women, migrants and displaced persons, and policies that favour better diversification through tourism value chains can enhance tourism positive socio-economic impacts. Tourism is one of the driving forces of global economic growth and is considered an effective sector to
Sport tourism is a fast-growing segment of tourism offering new perspectives and supporting travelers' behavior shift towards active living that is a boost for sustainable destinations. These interrelations between active living, active travelling, and sport tourism have a powerful environmental, economic, and social impact. Based on the recognized contribution of sport tourism in sustaining ...
Thereby, it answers to a need to take tourism seriously in social science, as a major economic, social and ecologic force. In emphasizing the relationship between driving forces on different geographic scales and levels, power relations are highlighted. The paper discusses the role of driving forces for mitigating overtourism.
The results show that inbound tourism may be a new and powerful driving force for regional innovation, while the effect of inbound tourism on technological innovation appears to be weaker than that on social innovation. Our findings also show that a higher market percentage of domestic tourism may weaken the impact of inbound tourism.
Tourism: a driving force for growth. This month the Dossier in our Monthly Report looks at one of the most important sectors for Spain's economy: tourism. A sector that provides more than 11% of the country's gross domestic product and 13% of its jobs, which has been one of the pillars of its economic recovery over the past few years and ...
The driving force analysis shows that the push factor of tourist source, such as the number of people buying pension insurance, is the core driving mechanism, while the pull factor of destination, such as the park green area, and resistance factors such as psychological distance, are in the secondary position.
Sustainable Tourism as a Driving force of the Tourism Industry in a Post-Covid-19 Scenario Soc Indic Res. 2021;158(3):991-1011. doi: 10.1007/s11205-021-02735-2. ... The tourism industry is probably one of the most affected by the crisis caused by Covid-19. It is the responsibility of politicians, tourism professionals and researchers to look ...
Technology is the core driving force of regional tourism eco-efficiency, while traffic conditions and social civilization levels are key external influence factors leading to improvement of tourism eco-efficiency. The research results reveal the great significance of laws for sustainable green tourism development with different economic levels ...
The results show that tourist contentment, destination image, behavioral goals, and the availability of tourism information are driving forces of social media usage toward tourism destination decisions. The findings imply that tourism service providers should revise and incorporate the trending social media strategies to enhance their ...
Sport tourism is a fast-growing segment of tourism offering new perspectives and supporting travelers' behavior shift towards active living that is a boost for sustainable destinations. These interrel ... "Sport Tourism as Driving Force for Destinations' Sustainability," Sustainability, MDPI, vol. 15(3), pages 1-21, January.
Sport tourism is a fast-growing segment of tourism offering new perspectives and sup-. porting travelers' behavior shift towards active living that is a boost for sustainable destinations. These ...
1. Introduction. Within tourism studies, the literature on the driving forces of tourism flows is extensive. Destination image and specific characteristics of destinations are frequently studied factors driving tourism flows, but choices of multiple tourism destinations has not been treated independently or as separate activities.
The presence of a tourism village in Indonesia might be viewed as an opportunity to strengthen small, micro, and medium-sized businesses as a driving force in the local economy. The goal of Micro Small Medium Enterprises (MSMEs) development is to create a tourism village supported by MSMEs that combines natural and culture attractions, local gastronomic and artisan, and public service facilities.
About the portal. A technological tool for effective communication between the leading players in the Moscow tourism market and representatives of the foreign/regional tourism industry through online events. OBJECTIVES: • Building long-term cooperation with foreign/regional representatives. • Raising awareness among foreign/regional ...
Enjoy our Moscow Travel Guide: Touristic Maps, Places to Visit, Best Routes and Interesting Facts | Travel Real Russia in 2019 ... This vehicle was designed in the 1950s as a support vehicle for military forces. It is still being produced today as it was sixty years ago… And, surprisingly, it looks almost like it did in 1965! Driving it on ...
1: Off-kilter genius at Delicatessen: Brain pâté with kefir butter and young radishes served mezze-style, and the caviar and tartare pizza. Head for Food City. You might think that calling Food City (Фуд Сити), an agriculture depot on the outskirts of Moscow, a "city" would be some kind of hyperbole. It is not.
Spend a rainy day at the Tretyakov Gallery. 10. Walk Up and Down Arbat Street. 11. Stop by the VDNKh All-Russian Exhibition Centre. 12. Wander Around Gorky Park. Where to Stay in Moscow for Sightseeing. Map of Tourist Attractions & Things to Do in Moscow.
Holding placards reading "People live here" and "We don't want to see our island die", demonstrators said changes must be made to the tourism industry that accounts for 35% of gross domestic ...
Here are some of the initiatives currently in force. Venice tourist tax The lagoon city has introduced 5 euros (about $5.35) tickets for day trippers, valid from 8:30 a.m. to 4 p.m.
People will travel abroad more, probably. Imports are cheaper, so they will import more. But obviously if that happens, then the rest of the world is happily financing the country's current ...
NEW YORK -- The Yankees had been deep in negotiations with the Padres for days, repeatedly volleying proposals that could deliver Juan Soto to the Bronx. Brian Cashman recognized that the two sides were getting close; there would be a heavy price, as the longtime general manager informed Hal Steinbrenner, but this was someone worth paying for.
Adobe's design technologies have been a driving force in Dasha's artistic journey, helping her to master new creative approaches and mediums. ... information to a piece of content — like their names, dates, and the tools used to create it. Those credentials travel with the content, so that people know exactly where the content came from ...
Investigating the spatial-temporal evolution of land use and its driving forces provides a scientific basis for policy formulation, land-use structure adjustment, and ecological civilization development. Using the Google Earth Engine (GEE) platform, this study analyzed remote sensing images from 2000, 2010, and 2020 to derive basic land-use data for Putian City and its five districts and counties.