

Debugging .NET Apps with Time Travel Debugging (TTD)
Felipe Pessoto
January 25th, 2019 0 0
When you are debugging an application, there are many tools and techniques you can use, like logs, memory dumps and Event Tracing for Windows (ETW). In this post, we will talk about Time Travel Debugging, a tool used by Microsoft Support and product teams and more advanced users, but I encourage everyone to try this approach when diagnosing hard to find bugs.
Time Travel Debugging
Time Travel Debugging or TTD, is the process of recording and then replay the execution of a process, both forwards and backward, to understand what is happening during the execution. It is vital to fixing bugs when the root cause is not clear, and the symptoms appear moments later when the source of the problem is gone. In a way it’s similar to Intellitrace (available in Visual Studio 2017 Enterprise), but while Intellitrace records specific events and associated data – call stack, function parameters and return value -, TTD embraces a more general approach and let you move at a single instruction level and access any process data (heap, registers, stack).
The same way you can debug a native or managed process, you can also use TTD in both cases, including .NET Core, but it is limited to Windows. In the following sections, we’ll describe particularities when debugging a managed process.
It also allows you to rewind and play how many times you want, helping you to isolate the problem when it happened, and setting breakpoints just as you usually do in Windbg. Even when you don’t need to rewind, TTD has advantages over Live Debugging, since it doesn’t interrupt the process, you can create a trace and analyze it offline, but be aware that TTD is very intrusive and ideally you shouldn’t use it for more than a few minutes or the traces files can become very large (>5GB).
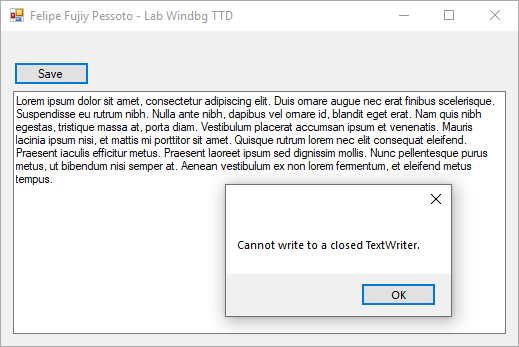
The demo application is a simple Windows Forms bugged applications that writes a log file to disk. You can download the code from GitHub and compile it, or download the binaries . The machine where we’ll record the traces must be a Windows 10 Anniversary Update or newer.
Open the application and click on Save several times and after some seconds it doesn’t work anymore:
Recording a trace
You can use WinDbg Preview to record the trace, it is available in Microsoft Store .
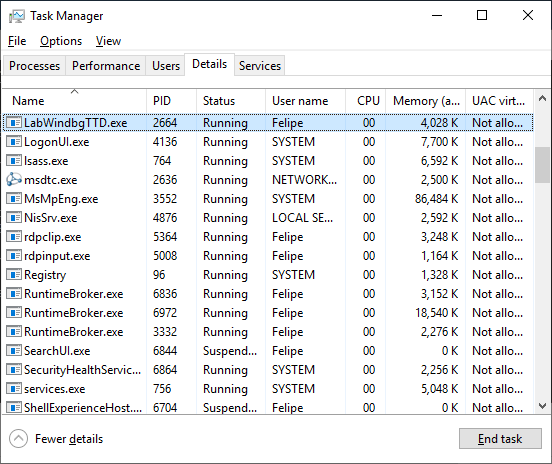
1. Open the LabWindbgTTD.exe in the target machine and take a note of its PID:
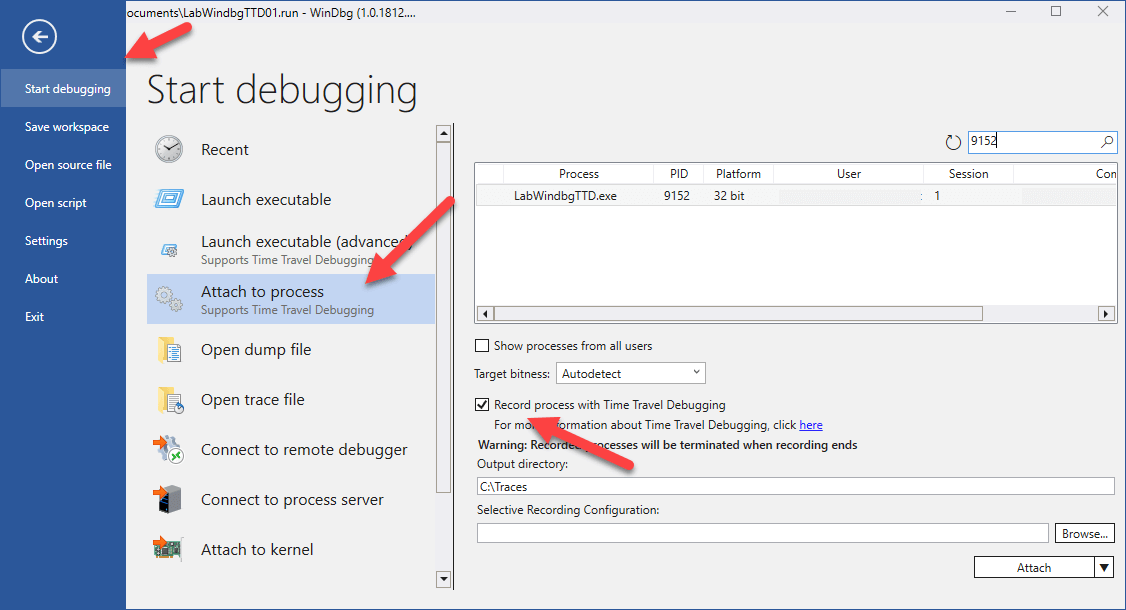
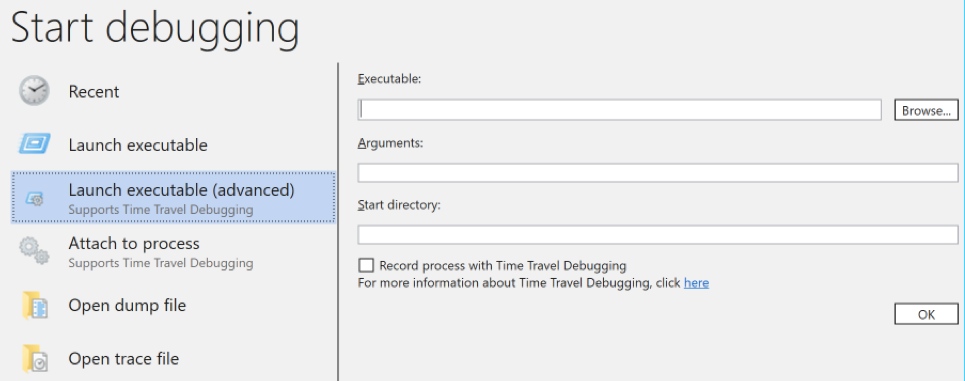
2. Open WinDbg Preview as admin, click on File -> Start debugging -> “Attach to process” and search for the process name or PID (in case you have multiple processs with the same name). Check the option “Record process with Time Travel Debugging” and optionally change the output dictory:
Now, the TTD is recording the process execution, keep it open.
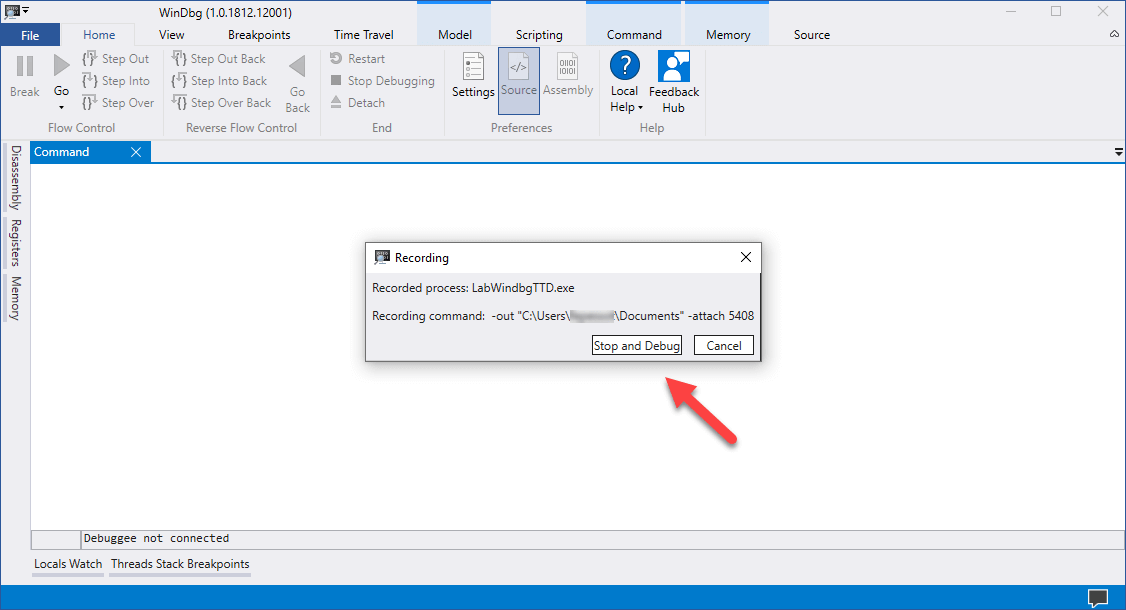
3. Go to the LabWindbgTTD application and click on Save several times until you receive the error. After the error appears, click on “Stop and Debug”, the processes will be closed:
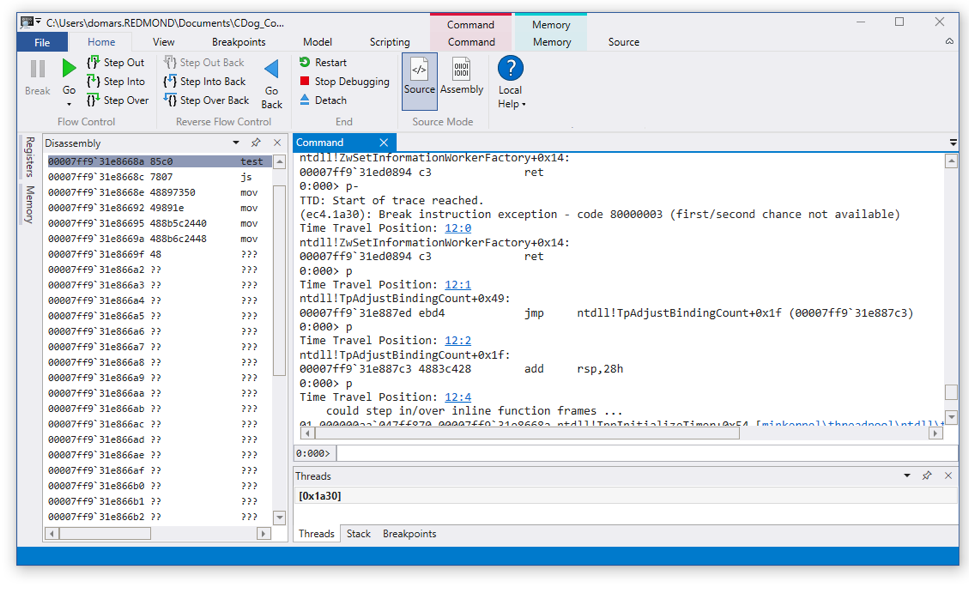
4. WinDbg will automatically load the resulting file and index it:
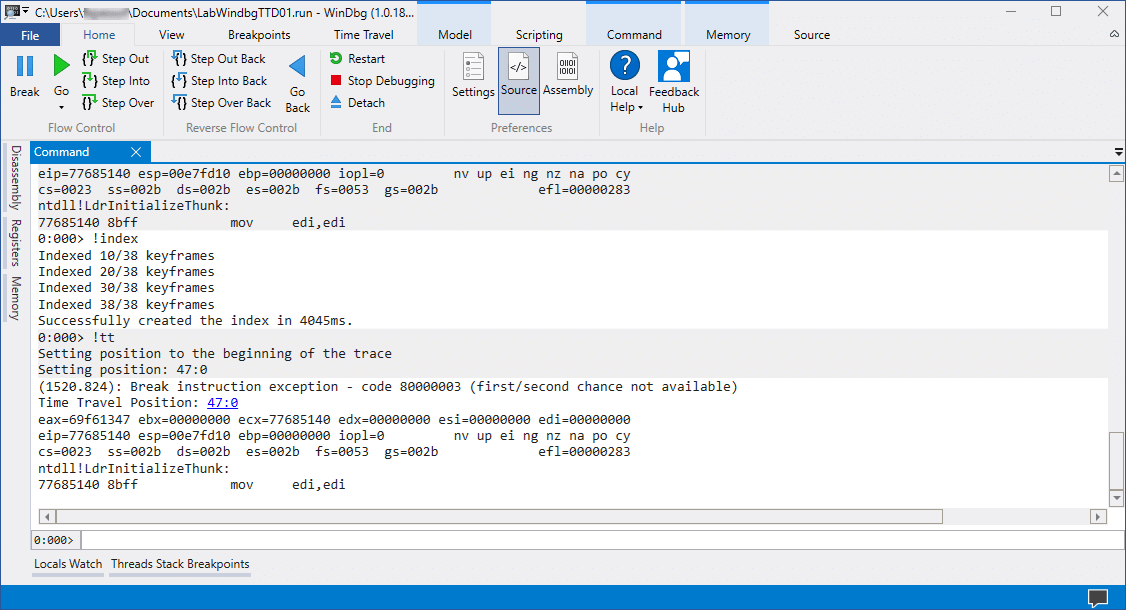
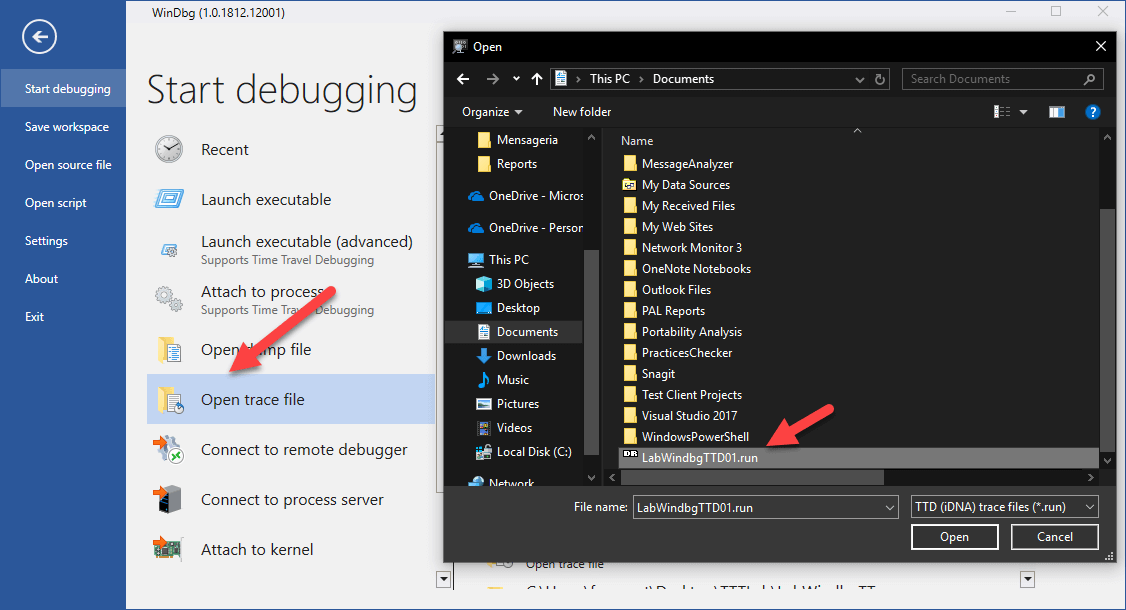
5. You can also open it later clicking on File -> Open trace file and select the .run file:
Replay and Analyze
Copy the files to your machine, you can use WinDbg or WinDbg Preview to analyze it and don’t forget to set up the symbols to be able to resolve the function names. We’ll use WinDbg Preview, but the steps are similar in WinDbg, click File -> Open Trace File and select the “.run” file.
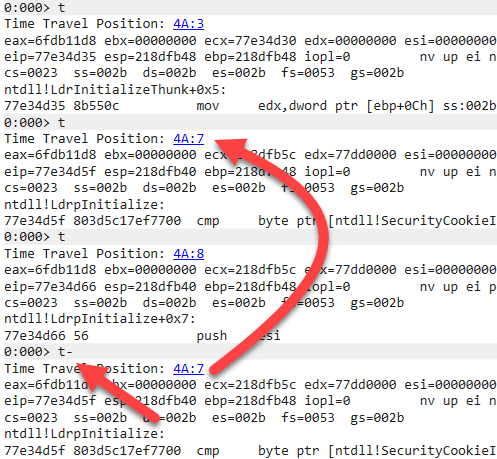
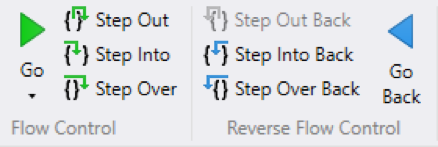
When debugging a TTD file, you can Step Into (t), Step Out and Step Over (p) like you do when Live Debugging:
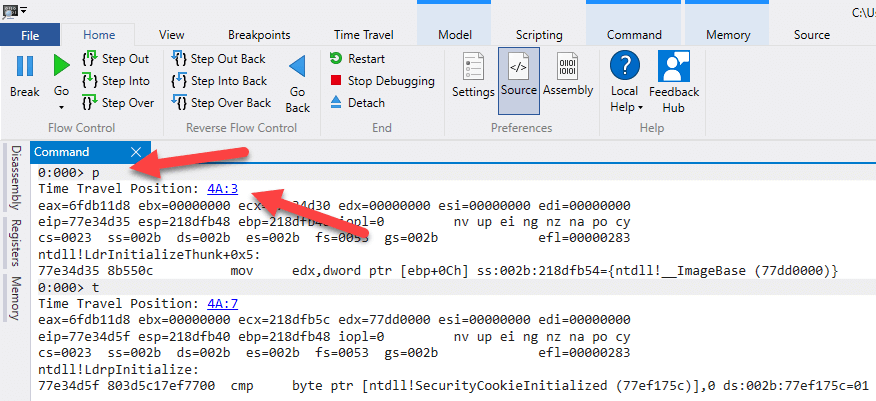
You can see the current Time Travel Position when stepping through the application, like in the image above.
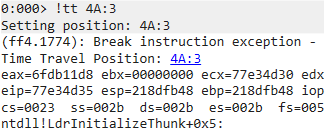
Using the !tt <POSITION> command you can navigate to a specific position:
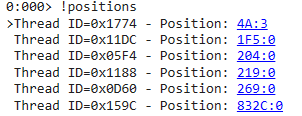
The !positions command show the positions for all threads:
But it gets interesting when using the Step command contrariwise, instead of p, t, and g, you can execute p- (Step Back), t- (Trace Back), and g- (Go Back):
Loading Data Access Component and SOS debugging extension
When debugging .NET applications in a different machine from where the dump or trace was created, you need to copy the Data Access and SOS dlls:
- For .NET Framework: mscordacwks.dll and SOS.dll in C:\Windows\Microsoft.NET\Framework\v4.0.30319\ (or C:\Windows\Microsoft.NET\Framework64\v4.0.30319\ for 64 bits processes)
- For .NET Core: mscordaccore.dll and SOS.dll in C:\Program Files\dotnet\shared\Microsoft.NETCore.App\X.X.X\
And execute this command in WinDbg:
.cordll -ve -u -lp <PATH>

Finding the problem
Now we know how to navigate into the TTD file, how can we find the bug?
Let’s try to stop when the error occurs, to do this you could use “ sxe clr;g ” like you would do in a Live Debug, but the TTD extends the Session and Process data model objects, exposing events like Exceptions. To see them all, execute “ dx @$curprocess.TTD ” and “ dx @$cursession.TTD “:

We can take advantage of this feature and filter the Exception events, “ dx -r2 @$curprocess.TTD.Events.Where(t => t.Type == “Exception”).Select(e => e.Exception) “:

Click on [Time Travel] to navigate to the moment when the Exception was thrown and execute !pe to see the System.ObjectDisposedException.

You can now execute !clrstack to see exactly which method is throwing the Exception, but it isn’t helpful since the BtnSave_Click just call StreamWriter.WriteAsync and is not disposing the object.

In this case, a log containing the Stack Trace, or a Dump file wouldn’t help. The application is small and simple enough that looking the code you would easily find the problem, but let’s continue the analysis using the WinDbg.
Execute !dso (or !DumpStackObjects ) to see the objects in the current stack and click on StreamWriter address.

Click the address to execute !do (or !DumpObj ) that shows the details of the object, including its fields, where we can see the stream is null, which means it is disposed.

We know that at this point the StreamWrite.Dispose method has been called and we need to find out who called it. Set a breakpoint to this method and continue the execution in reverse, “ !bpmd mscorlib.dll System.IO.StreamWriter.Dispose;g- “:

You’ll stop at Dispose method of StreamWriter . Execute !dso again, we can see a StreamWriter in the same address as before, let’s inspect the object and the underlying stream to find more details about it.

The object address may be different because a Garbage Collection happened or just because we are looking at a different instance of StreamWriter. In this case, you would need to check if the object is the same.
Another option, to see if the object is the same, is to use !GCRoot to find references to the object, this way we can see if in both moments the StreamWriter object is the LogFile field in Form1.

If it is not the object you are looking for, execute g- again until you find it, then execute !clrstack to show the Stack Trace and find the method that is Disposing the StreamWriter:

TTD makes it viable to analyze many scenarios that would be extremely difficult to reproduce or to collect the right data. The possibility of going back and forth is powerful and has the potential to greatly reduce troubleshooting time.
Microsoft Docs has many more details about TTTracer and Windbg Preview .
Felipe Pessoto Software Engineer, Microsoft Fabric

Discussion is closed.

Time Travel Debugging is now available in WinDbg Preview
- James Pinkerton
We are excited to announce that Time Travel Debugging (TTD) features are now available in the latest version of WinDbg Preview. About a month ago, we released WinDbg Preview , which provides great new debugging user experience s . We are now publicly launching a preview version of TTD for the first time and are looking forward to your feedback.
What is TTD?
Wouldn’t it be great to go back in time and fix a problem? We can’t help you go back in time to fix poor life choices, but we can help you go back in time to fix code problems.
Time Travel Debugging (TTD) is a reverse debugging solution that allows you to record the execution of an app or process, replay it both forwards and backwards and use queries to search through the entire trace. Today’s debuggers typically allow you to start at a specific point in time and only go forward. TTD improves debugging since you can go back in time to better understand the conditions that lead up to the bug. You can also replay it multiple times to learn how best to fix the problem.
TTD is as easy as 1 – 2 – 3.
- Record: Record the app or process on the machine which can reproduce the bug. This creates a Trace file (.RUN extension) which has all of the information to reproduce the bug.
- Replay: Open the Trace file in WinDbg Preview and replay the code execution both forward and backward as many times as necessary to understand the problem.
- Analyze: Run queries & commands to identify common code issues and have full access to memory and locals to understand what is going on.
Getting Started
I know you are all excited and ready to start using TTD. Here are a few things you should know to get started.
- Install : You can use TTD by installing the WinDbg Preview (build 10.0.16365.1002 or greater) from the Store if you have Windows 10 Anniversary Update or newer at https://aka.ms/WinDbgPreview .
- Feedback: This is a preview release of TTD, so we are counting on your feedback as we continue to finish the product. We are using the Feedback Hub to help us prioritize what improvements to make. The Windows Insider website has a great overview on how to give good feedback https://insider.windows.com/en-us/how-to-feedback .
- Questions : We expect you will have some questions as you work with TTD. So feel free to post them on this blog or send them in the Feedback Hub and we will do our best to answer. We’ll be posting a TTD FAQ on our blog shortly.
- Documentation : We’ve got some initial documentation at https://docs.microsoft.com/en-us/windows-hardware/drivers/debugger/time-travel-debugging-overview and will be improving our content based upon customer feedback and usage. You can give us feedback or propose edits on the docs.microsoft.com documentation by hitting “Comments” or “Edit” on any page.
- Blog s: Watch for more in-depth TTD updates and tips in the future on our team’s blog https://blogs.msdn.microsoft.com/windbg .
How to use TTD
You use TTD directly in the WinDbg Preview app. We have added all of the key TTD features into WinDbg Preview to provide a familiar debugging experience, which makes it intuitive to go backwards and forwards in time during your debugging session.
Record a Trace
WinDbg Preview makes it easy to record a trace. Simply click File >> Start Debugging and point to the app or process. You will have an option to Record during attach and launch. See https://docs.microsoft.com/en-us/windows-hardware/drivers/debugger/time-travel-debugging-overview for more information.
Replay a Trace
Once the Trace is complete, we automatically load and index the Trace for faster replay and memory lookups. Then simply use the WinDbg ribbon buttons or commands to step forwards and backwards through the code.
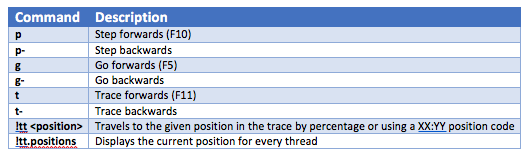
Basic TTD Commands
You can use the ribbon or enter the following TTD commands in WinDbg Preview. See https://docs.microsoft.com/en-us/windows-hardware/drivers/debugger/time-travel-debugging-overview for a complete list of TTD commands.
Final Thoughts
We are very excited to get TTD into the hands of our developers; but there are a few things to remember.
- TTD is a preview, so we will be regularly improving performance and features
- This only runs on Windows 10 since WinDbg Preview is a Store app
- See docs.microsoft.com documentation for TTD known issues and compatibility
Welcome to the world of time travel. Our goal is to improve the lives of developers by making debugging easier to increase product quality. Please send us feedback and feature requests in the Feedback Hub to let us know how we are doing!
Introducing the newest addition to Visual Studio: Time-Travel Debugging!
Are you tired of constantly debugging your code, trying to figure out where that one pesky bug is coming from look no further, because we are thrilled to announce our newest addon to visual studio: time-travel debugging..
With Time-Travel Debugging, developers can now travel through time like Doc Brown and Marty McFly, but instead of saving their families, they'll be saving their code. No more long nights trying to figure out where you went wrong, just a simple click of a button and voila! You're in the past, present or future of your code, fixing bugs with ease.
Imagine being able to fix that bug that's been bugging you for months, without having to go through the hassle of rewriting entire sections of your code. Time-Travel Debugging has got you covered.
Think about it, no more staring at the screen for hours trying to find that one missing semicolon that broke your entire application, just press the time-travel button and boom ! You're back in time , right before the bug was introduced. And if you're feeling particularly ambitious, you can even travel to the future and see how your code will evolve.
Who needs a crystal ball when you have Time-Travel Debugging?
And the best part? Time-Travel Debugging is available now in the latest version of Visual Studio, and we're looking for beta testers to help us fine-tune the addon before its official release. So if you're ready to join the ranks of the elite time-traveling debuggers, sign up for the beta today!
Sign up for beta testing!
With Time-Travel Debugging, you can now go back in time to see exactly what caused the bug, making debugging faster and more efficient than ever before. Simply hit the "time-travel" button in the debugger and watch as your code rewinds to the exact moment the bug occurred. But that's not all! Time-Travel Debugging also allows you to fast forward through your code to see the future state of your program, giving you the ability to catch potential bugs before they even happen.


Time Travel Debug in VS Code

We’re happy to announce that time travel debugging is now available in Visual Studio Code (VS Code) via the Time Travel Debug for C/C++ plugin.
Time Travel Debug for C/C++ places time travel debugging capabilities at the fingertips of developers using VS Code. The technology is based on the UDB time travel debugger .
With this plugin, developers can now travel forward and backward through full code execution in order to:
- Get full visibility into the state of the code they’re working on – at any point in its execution
- Understand complex code and how it all hangs together
- Accelerate root cause analysis and reduce bug-fix time
By debugging this way, programmers can conduct effective root-cause analysis (without needing to predict ahead of time what to log), and avoid disruptive redeployments.
How does it work?
The plugin adds a time travel debugging toolbar to your VS Code interface so that you can step through the code forward and backward and watch variable and memory changes as your navigate forward and in reverse to understand what the software did.

How to get started with Time Travel Debug for C/C++
Key features
Here’s a summary of the key feature capabilities added to VS Code:
- Navigate backward and forward through code execution: Reverse Step In/Out/Over joins the familiar Step In/Out/Over
- Launch, Attach, or Replay a LiveRecorder recording
- Continue and Reverse Continue , stopping at Breakpoints / Conditional Breakpoints / Watchpoints
- Inspect global and local variable values at any point in your program’s execution history
- Timeline – visually navigate and zoom through the execution flow
- Bookmarks – set bookmarks at any point in your program’s execution history. These appear on the timeline and can be easily jumped to
- Undo your last navigation action
- Evaluate expressions and call functions in the Debug Console at any point in your program’s execution history
Making VS Code better for developers
Microsoft’s IDE provides a rich development environment, including debugging capabilities such as variable inspection, stepping into code, and displaying the call stack. The great thing about VS Code is that it is highly extensible. With this integration we’ve taken advantage of that extensibility, and by adding time travel debugging superpowers, we’ve made it substantially quicker and easier to understand complex C/C++ codebases and the conditions that led to a specific error.
Try it out for yourself
Give it a try and don’t forget to leave your review on the VS Code marketplace.
Get the extension

Stay informed. Get the latest in your inbox.
Hit enter to search or ESC to close
Time-Travel Debugging Production Code

Loren Sands-Ramshaw
Developer Relations Engineer
In this post, I’ll give an overview of time-travel debugging (what it is, its history, how it’s implemented) and show how it relates to debugging your production code.
Normally, when we use debuggers, we set a breakpoint on a line of code, we run our code, execution pauses on our breakpoint, we look at values of variables and maybe the call stack, and then we manually step forward through our code’s execution. In time-travel debugging , also known as reverse debugging , we can step backward as well as forward. This is powerful because debugging is an exercise in figuring out what happened: traditional debuggers are good at telling you what your program is doing right now, whereas time-travel debuggers let you see what happened. You can wind back to any line of code that executed and see the full program state at any point in your program’s history.
History and current state
It all started with Smalltalk-76, developed in 1976 at Xerox PARC . ( Everything started at PARC 😄.) It had the ability to retrospectively inspect checkpointed places in execution. Around 1980, MIT added a “retrograde motion” command to its DDT debugger , which gave a limited ability to move backward through execution. In a 1995 paper, MIT researchers released ZStep 95, the first true reverse debugger, which recorded all operations as they were performed and supported stepping backward, reverting the system to the previous state. However, it was a research tool and not widely adopted outside academia.
ODB, the Omniscient Debugger , was a Java reverse debugger that was introduced in 2003, marking the first instance of time-travel debugging in a widely used programming language. GDB (perhaps the most well-known command-line debugger, used mostly with C/C++) added it in 2009.
Now, time-travel debugging is available for many languages, platforms, and IDEs, including:
- Replay for JavaScript in Chrome, Firefox, and Node, and Wallaby for tests in Node
- WinDbg for Windows applications
- rr for C, C++, Rust, Go, and others on Linux
- Undo for C, C++, Java, Kotlin, Rust, and Go on Linux
- Various extensions (often rr- or Undo-based) for Visual Studio, VS Code, JetBrains IDEs, Emacs, etc.
Implementation techniques
There are three main approaches to implementing time-travel debugging:
- Record & Replay : Record all non-deterministic inputs to a program during its execution. Then, during the debug phase, the program can be deterministically replayed using the recorded inputs in order to reconstruct any prior state.
- Snapshotting : Periodically take snapshots of a program’s entire state. During debugging, the program can be rolled back to these saved states. This method can be memory-intensive because it involves storing the entire state of the program at multiple points in time.
- Instrumentation : Add extra code to the program that logs changes in its state. This extra code allows the debugger to step the program backwards by reverting changes. However, this approach can significantly slow down the program’s execution.
rr uses the first (the rr name stands for Record and Replay), as does Replay . WinDbg uses the first two, and Undo uses all three (see how it differs from rr ).
Time-traveling in production
Traditionally, running a debugger in prod doesn’t make much sense. Sure, we could SSH into a prod machine and start the process handling requests with a debugger and a breakpoint, but once we hit the breakpoint, we’re delaying responses to all current requests and unable to respond to new requests. Also, debugging non-trivial issues is an iterative process: we get a clue, we keep looking and find more clues; discovery of each clue is typically rerunning the program and reproducing the failure. So, instead of debugging in production, what we do is replicate on our dev machine whatever issue we’re investigating and use a debugger locally (or, more often, add log statements 😄), and re-run as many times as required to figure it out. Replicating takes time (and in some cases a lot of time, and in some cases infinite time), so it would be really useful if we didn’t have to.
While running traditional debuggers doesn’t make sense, time-travel debuggers can record a process execution on one machine and replay it on another machine. So we can record (or snapshot or instrument) production and replay it on our dev machine for debugging (depending on the tool, our machine may need to have the same CPU instruction set as prod). However, the recording step generally doesn’t make sense to use in prod given the high amount of overhead—if we set up recording and then have to use ten times as many servers to handle the same load, whoever pays our AWS bill will not be happy 😁.
But there are a couple scenarios in which it does make sense:
- Undo only slows down execution 2–5x , so while we don’t want to leave it on just in case, we can turn it on temporarily on a subset of prod processes for hard-to-repro bugs until we have captured the bug happening, and then we turn it off.
- When we’re already recording the execution of a program in the normal course of operation.
The rest of this post is about #2, which is a way of running programs called durable execution .
Durable execution
What’s that.
First, a brief backstory. After Amazon (one of the first large adopters of microservices) decided that using message queues to communicate between services was not the way to go (hear the story first-hand here ), they started using orchestration. And once they realized defining orchestration logic in YAML/JSON wasn’t a good developer experience, they created AWS Simple Workfow Service to define logic in code. This technique of backing code by an orchestration engine is called durable execution, and it spread to Azure Durable Functions , Cadence (used at Uber for > 1,000 services ), and Temporal (used by Stripe, Netflix, Datadog, Snap, Coinbase, and many more).
Durable execution runs code durably—recording each step in a database, so that when anything fails, it can be retried from the same step. The machine running the function can even lose power before it gets to line 10, and another process is guaranteed to pick up executing at line 10, with all variables and threads intact.[^1] It does this with a form of record & replay: all input from the outside is recorded, so when the second process picks up the partially-executed function, it can replay the code (in a side-effect–free manner) with the recorded input in order to get the code into the right state by line 10.
Durable execution’s flavor of record & replay doesn’t use high-overhead methods like software JIT binary translation , snapshotting, or instrumentation. It also doesn’t require special hardware. It does require one constraint: durable code must be deterministic (i.e., given the same input, it must take the same code path). So it can’t do things that might have different results at different times, like use the network or disk. However, it can call other functions that are run normally ( “volatile functions” , as we like to call them 😄), and while each step of those functions isn’t persisted, the functions are automatically retried on transient failures (like a service being down).
Only the steps that require interacting with the outside world (like calling a volatile function, or calling sleep('30 days') , which stores a timer in the database) are persisted. Their results are also persisted, so that when you replay the durable function that died on line 10, if it previously called the volatile function on line 5 that returned “foo”, during replay, “foo” will immediately be returned (instead of the volatile function getting called again). While yes, it adds latency to be saving things to the database, Temporal supports extremely high throughput (tested up to a million recorded steps per second). And in addition to function recoverability and automatic retries, it comes with many more benefits , including extraordinary visibility into and debuggability of production.
Debugging prod
With durable execution, we can read through the steps that every single durable function took in production. We can also download the execution’s history, checkout the version of the code that’s running in prod, and pass the file to a replayer (Temporal has runtimes for Go, Java, JavaScript, Python, .NET, and PHP) so we can see in a debugger exactly what the code did during that production function execution. Read this post or watch this video to see an example in VS Code.[^2]
Being able to debug any past production code is a huge step up from the other option (finding a bug, trying to repro locally, failing, turning on Undo recording in prod until it happens again, turning it off, then debugging locally). It’s also a (sometimes necessary) step up from distributed tracing.
💬 Discuss on Hacker News , Reddit , Twitter , or LinkedIn .
I hope you found this post interesting! If you’d like to learn more about durable execution, I recommend reading:
- Building reliable distributed systems
- How durable execution works
and watching:
- Introduction to Temporal
- Why durable execution changes everything
Thanks to Greg Law, Jason Laster, Chad Retz, and Fitz for reviewing drafts of this post.
[^1]: Technically, it doesn’t have line-by-line granularity. It only records certain steps that the code takes—read on for more info ☺️. [^2]: The astute reader may note that our extension uses the default VS Code debugger, which doesn’t have a back button 😄. I transitioned from talking about TTD to methods of debugging production code via recording, so while Temporal doesn’t have TTD yet, it does record all the non-deterministic inputs to the program and is able to replay execution, so it’s definitely possible to implement. Upvote this issue or comment if you have thoughts on implementation!
This browser is no longer supported.
Upgrade to Microsoft Edge to take advantage of the latest features, security updates, and technical support.
Introduction to Time Travel Debugging objects
- 1 contributor
This section describes how to use the data model to query time travel traces. This can be a powerful tool to answer questions like these about the code that is captured in a time travel trace.
- What exceptions are in the trace?
- At what point in time in the trace did a specific code module load?
- When were threads created/terminated in the trace?
- What are the longest running threads in the trace?
There are TTD extensions that add data to the Session and Process data model objects. The TTD data model objects can be accessed through the dx (Display Debugger Object Model Expression) command, WinDbg's model windows, JavaScript and C++. The TTD extensions are automatically loaded when debugging a time travel trace.
Process Objects
The primary objects added to Process objects can be found in the TTD namespace off of any Process object. For example, @$curprocess.TTD .
For general information on working with LINQ queries and debugger objects, see Using LINQ With the debugger objects .
Session Objects
The primary objects added to Session objects can be found in the TTD namespace off of any Session object. For example, @$cursession.TTD .
There are some objects and methods added by TTDAnalyze that are used for internal functions of the extension. Not all namespaces are documented, and the current namespaces will evolve over time.
Sorting query output
Use the OrderBy() method to sort the rows returned from the query by one or more columns. This example sorts by TimeStart in ascending order.
To display additional depth of the data model objects the -r2 recursion level option is used. For more information about the dx command options, see dx (Display Debugger Object Model Expression) .
This example sorts by TimeStart in descending order.
Specifying elements in a query
To select a specific element a variety of qualifiers can be appended to the query. For example, the query displays the first call that contains "kernelbase!GetLastError".
Filtering in a query
Use the Select() method to choose which columns to see and modify the column display name.
This example returns rows where ReturnValue is not zero and selects to display the TimeStart and ReturnValue columns with custom display names of Time and Error.
Use the GroupBy() method to group data returned by the query to do perform analysis using structured results This example groups the time locations by error number.
Assigning result of a query to a variable
Use this syntax to assigning result of a query to a variable dx @$var = <expression>
This example assigns the results of a query to myResults
Use the dx command to display the newly created variable using the -g grid option. For more information on the dx command options, see dx (Display Debugger Object Model Expression) .
Querying for exceptions
This LINQ query uses the TTD.Event object to display all of the exceptions in the trace.
Querying for specific API calls
Use TTD.Calls object to query for specific API calls. In this example, an error has occurred when calling user32!MessageBoxW , the Windows API to show a message box. We list all calls to MessageBoxW , order it by the start time of the function, and then pick the last call.
Querying for the load event of a specific module
First, use the lm (List Loaded Modules) command to display the loaded modules.
Then use the following dx command to see at what position in the trace a specific module was loaded, such as ntdll.
This LINQ query displays the load event(s) of a particular module.
The address of FFFFFFFFFFFFFFFE:0 indicates the end of the trace.
Querying for all of the error checks in the trace
Use this command to sort by all of the error checks in the trace by error count.
Querying for the time position in the trace when threads were created
Use this dx command to display all of the events in the trace in grid format (-g).
Select any of the columns with a + sign to sort the output.
Use this LINQ query to display in grid format, the time position in the trace when threads were created (Type == "ThreadCreated").
Use this LINQ query to display in grid format, the time positions in the trace when threads were terminated (Type == "ThreadTerminated").
Sorting output to determine the longest running threads
Use this LINQ query to display in grid format, the approximate longest running threads in the trace.
Querying for read accesses to a memory range
Use the TTD.Memory object to query for to query for read accesses to a memory range.
The Thread Environment Block (TEB) is a structure that contains all the information regarding the state of a thread, including the result returned by GetLastError(). You can query this data structure by running dx @$teb for the current thread. One of TEB's members is a LastErrorValue variable, 4 bytes in size. We can reference the LastErrorValue member in the TEB using this syntax. dx &@$teb->LastErrorValue .
The example query shows how to find every read operation done in that range in memory, select all the reads that happen before the a dialog was created and then sort the result to find the last read operation.
If in our trace a "dialog" event has taken place we can run a query to find every read operation done in that range in memory, select all the reads that happen before the dialog got created and then sort the result to find the last read operation. Then time travel to that point in time by calling SeekTo() on the resulting time position.
GitHub TTD Query Lab
For a tutorial on how to debug C++ code using a Time Travel Debugging recording using queries to find information about the execution of the problematic code in question, see https://github.com/Microsoft/WinDbg-Samples/blob/master/TTDQueries/tutorial-instructions.md .
All of the code used in the lab is available here: https://github.com/Microsoft/WinDbg-Samples/tree/master/TTDQueries/app-sample .
Troubleshooting TTD Queries
"unknownormissingsymbols" as the function names.
The data model extension needs full symbol information in order to provide function names, parameter values, etc. When full symbol information is not available the debugger uses "UnknownOrMissingSymbols" as the function name.
- If you have private symbols you will get the function name and the correct list of parameters.
- If you have public symbols you will get the function name and a default set of parameters - four unsigned 64-bit ints.
- If you have no symbol information for the module you are querying, then “UnknownOrMissingSymbols” is used as the name.
TTD Queries for calls
There can be a several reasons that a query does not return anything for calls to a DLL.
- The syntax for the call isn't quite right. Try verifying the call syntax by using the x command: "x <call>". If the module name returned by x is in uppercase, use that.
- The DLL is not loaded yet and is loaded later in the trace. To work around this travel to a point in time after the DLL is loaded and redo the query.
- The call is inlined which the query engine is unable to track.
- The query pattern uses wildcards which returns too many functions. Try to make the query pattern more specific so that the number of matched functions is small enough.
Using LINQ With the debugger objects
dx (Display Debugger Object Model Expression)
Time Travel Debugging - Overview
Time Travel Debugging - JavaScript Automation
Was this page helpful?
Coming soon: Throughout 2024 we will be phasing out GitHub Issues as the feedback mechanism for content and replacing it with a new feedback system. For more information see: https://aka.ms/ContentUserFeedback .
Submit and view feedback for
Additional resources
Sign in to add this item to your wishlist, follow it, or mark it as ignored
Sign in to see reasons why you may or may not like this based on your games, friends, and curators you follow.

Planned Release Date: 6 May, 2024
This game plans to unlock in approximately 2 days
About This Game
What is it.
- 16 levels of increasing difficulty.
- Two separate endings.
- Preview system to assist with time travel.
- A novel approach to time travel in video games.
System Requirements
- OS: Windows 10
- Processor: Intel Core i5 or equivalent
- Memory: 4 GB RAM
- Graphics: N/A
- Storage: 90 MB available space
More like this
You can write your own review for this product to share your experience with the community. Use the area above the purchase buttons on this page to write your review.

You can use this widget-maker to generate a bit of HTML that can be embedded in your website to easily allow customers to purchase this game on Steam.
Enter up to 375 characters to add a description to your widget:
Copy and paste the HTML below into your website to make the above widget appear

Popular user-defined tags for this product: (?)
Sign in to add your own tags to this product.
IMAGES
VIDEO
COMMENTS
The Time Travel Debugging preview can be enabled in the latest version of Visual Studio Enterprise 2019 for Azure Virtual Machines on the Windows OS running ASP.NET (4.8+). After installing the latest version of Visual Studio Enterprise, complete the following steps: 1. Open the project you would like to Time Travel Debug - ensure that you ...
In Visual Studio, click Build > Build Solution. If all goes well, the build windows should display a message indicating that the build succeeded. ... On the Time Travel menu, use Time travel to start or use the !tt 0command to move to the start of the trace. 0:000> !tt 0 Setting position to the beginning of the trace Setting position: 15:0 ...
Time Travel Debugging or TTD, is the process of recording and then replay the execution of a process, both forwards and backward, to understand what is happening during the execution. ... In a way it's similar to Intellitrace (available in Visual Studio 2017 Enterprise), but while Intellitrace records specific events and associated data ...
The extension doesn't support running a UDB debug session at the same time as another debug session, in the same instance of Visual Studio Code. Data Watchpoints. The Visual Studio Code C/C++ extension doesn't currently support setting data watchpoints from the Watch window (issue #1410).
Time travel debugging in Visual Studio Enterprise can record a web app running on an Azure virtual machine (VM), and then accurately reconstruct and replay the execution path. Time Travel Debugging (TTD) was added to Visual Studio 2019 Enterprise as a preview feature, and is now integrated into the Visual Studio Snapshot Debugger. ...
In this episode, Robert is joined by Mark Downie, who shows us Time Travel Debugging. provides the ability to record a Web app running on a Azure Virtual Machine (VM) and then accurately reconstruct and replay the execution path. You can record code executed in production and replay the execution path inside Visual Studio. TTD also gives you the ability to move forward and backwards in time as ...
In C++/Windbg, there is now Time Travel Debugging. What is the path to do this in C#? Note: I am looking for TTD from a C# app created in visual studio. Whether the TTD is in visual studio or in windbg (or some other tool) does not matter to me. The point is full TTD. Intellitrace is not TTD. Intellitrace is an event and state capturing system.
ODB, the Omniscient Debugger, was a Java reverse debugger that was introduced in 2003, marking the first instance of time-travel debugging in a widely used programming language. GDB (perhaps the most well-known command-line debugger, used mostly with C/C++) added it in 2009. Now, time-travel debugging is available for many languages, platforms ...
In this episode, Robert is joined by Mark Downie, who shows us Time Travel Debugging. provides the ability to record a Web app running on a Azure Virtual Mac...
Time Travel Debugging (TTD) is a reverse debugging solution that allows you to record the execution of an app or process, replay it both forwards and backwards and use queries to search through the entire trace. Today's debuggers typically allow you to start at a specific point in time and only go forward. TTD improves debugging since you can ...
Look no further, because we are thrilled to announce our newest addon to Visual Studio: Time-Travel Debugging. class Hello {. static void Main(string[] args) System.Console.WriteLine("Hello World!"); With Time-Travel Debugging, developers can now travel through time like Doc Brown and Marty McFly, but instead of saving their families, they'll ...
Developer Community
The killer feature for JS/TS platforms. If you are building a JavaScript/TypeScript based platform, time-travel debugging is a killer feature. Users add breakpoints, then can step-through to see the internal state change line-by-line. This lets devs move fast and fix things. But more importantly it's a delightful developer experience.
The Time Travel Debugging preview can be enabled in the latest version of Visual Studio Enterprise 2019 for Azure Virtual Machines on the Windows OS running ASP.NET (4.8+). After installing the latest version of Visual Studio Enterprise, complete the following steps: 1.
Time travel debugging is also known as reverse debugging.In layman terms, you can debug the same lines again and again (without stopping/restarting the app). For example, you're debugging a method which threw an exception at line 10, to find the cause of exception you can again execute that method from a prior point let's say line 4 without restarting the complete debugging process. it's all ...
Just released version 2.0.0 of our Visual Studio Code extension: Time Travel Debug for C/C++. If you're not familiar with it, it supports time travel debugging within your preferred IDE. Community. C/C++ Docs. Java Docs. Support. Products. UDB - C/C++/Rust. Time Travel Debugging for Developers.
We're happy to announce that time travel debugging is now available in Visual Studio Code (VS Code) via the Time Travel Debug for C/C++ plugin.. Time Travel Debug for C/C++ places time travel debugging capabilities at the fingertips of developers using VS Code. The technology is based on the UDB time travel debugger.. With this plugin, developers can now travel forward and backward through ...
Time Travel Debugging is integrated with WinDbg, providing seamless recording and replay experience. To use TTD, you need to run the debugger elevated. Install WinDbg using an account that has administrator privileges and use that account when recording in the debugger. In order to run the debugger elevated, select and hold (or right-click) the ...
This utilizes Visual Studio's Edit and Continue feature. The result is that you can see the result of your changes live. Time Travel Loops. With loops, displaying the future is not straightforward. Each iteration will have different values inside. While time travel debugging, OzCode will display a small adornment near each loop.
Various extensions (often rr- or Undo-based) for Visual Studio, VS Code, JetBrains IDEs, Emacs, etc. Implementation techniques. There are three main approaches to implementing time-travel debugging: Record & Replay: Record all non-deterministic inputs to a program during its execution. Then, during the debug phase, the program can be ...
This debugger provides a launch configurations and support for mixing live and time-travel debugging in Node.js 10+. In addition to the Visual Studio Code debugger logic this extension provides: NodeChakraCore binaries with time-travel debugging functionality. Launch configuration for mixed live/time-travel debugging.
Method Description; Data.Heap() A collection of heap objects that were allocated during the trace. Note that this is a function that does computation, so it takes a while to run. Calls() Returns a collection of calls objects that match the input string. The input string can contain wildcards.
Time Trials is a turn-based single-player game where you use time travel to fight and make your way through a lab under siege by an alien threat. While the rules are simple, Time Trials enforces paradox free time travel, which means players cannot take any action that would change an observed event in the future.
For anyone else encountering this issue, there is a workaround which - however - undermines the whole idea of app containers (but it works). If you use a tool such as psexec to start a command prompt as nt authority\system, you can copy the WinDbgX subdirectory from underneath C:\Program Files\WindowsApps to another location, adjust its ACLs and run it from the new location (elevation works ...