
- Salary & Income Tax Calculators
- Mortgage Calculators
- Retirement Calculators
- Depreciation Calculators
- Statistics and Analysis Calculators
- Date and Time Calculators
- Contractor Calculators
- Budget & Savings Calculators
- Loan Calculators
- Forex Calculators
- Real Function Calculators
- Engineering Calculators
- Tax Calculators
- Volume Calculators
- 2D Shape Calculators
- 3D Shape Calculators
- Logistics Calculators
- HRM Calculators
- Sales & Investments Calculators
- Grade & GPA Calculators
- Conversion Calculators
- Ratio Calculators
- Sports & Health Calculators
- Other Calculators

Fuel Economy Calculator
Our easy-to-use calculator allows you to determine a car's fuel economy using just two figures: the amount of fuel consumed during a journey and the distance of this trip.
To use the calculator, simply enter the distance you traveled and the amount of fuel you used to get from your origin to your destination and click the "Calculate" button. You will then receive an estimation of the average fuel economy.
Distance (D): Miles Km
Fuel Used (F): Gallons (US) Gallons (UK Imperial) Liters
How your fuel economy is calculated
Fuel economy is represented as the ratio of distance to fuel consumed. Where the imperial system of units is used, fuel economy measurements are given in MPG (miles per gallon). Where metric units are used, fuel economy measurements are given in either KPL or KMPL (kilometers per liter). A higher fuel economy ratio indicates a more fuel-efficient vehicle.
In some nations, fuel consumption rather than fuel economy is used to measure the fuel efficiency of a vehicle. Measured as L/100km (liters per 100 kilometers), fuel consumption measurements express how much fuel is consumed over a certain distance while fuel economy expresses how far a car can go on a certain amount of fuel. Consequently, a lower fuel consumption ratio indicates a more fuel-efficient vehicle. If you have calculated the KMPL of your car, just divide the number 100 by the KMPL figure to determine your car's fuel consumption.
Both fuel economy and consumption can be easily calculated if you know how far you have traveled and much fuel you used to travel this distance. You will get a more accurate result if you fill up your tank before you set off. Make sure your odometer is set to '0' and drive as you normally would. Then, when you feel you have driven far enough, go to a gas station, take note of how far you have traveled, and fill your tank once more, recording how much gas is required to get a full tank.
To calculate MPG, the following equation is used:
MPG = D / F
where ' D ' or distance is in miles and ' F ' or fuel is in gallons.
To calculate KMPL, the following equation is used:
KMPL = D / F
where ' D ' or distance is in kilometers and ' F ' or fuel is in liters.
If you want to convert MPG as measured in US gallons into KMPL, the following equations are used:
MPG = 2.352145836 × KMPL
KMPL = 0.425143707 × MPG
If you want to convert MPG as measured in imperial gallons into KMPL, the following equations are used:
MPG = 2.824810534 × KMPL
KMPL = 0.35400604 × MPG
You may also be interested in our Lease Mileage Calculator or Power to Weight Ratio Calculator
- Currently 4.51/5
Rating: 4.5 /5 (313 votes)
Everyday Calculation
Free calculators and unit converters for general and everyday use.
Calculators » Home & Lifestyle » Trip Calculator
Trip Fuel Cost Calculator
Our online tools will provide quick answers to your calculation and conversion needs. On this page, you can calculate amount of fuel consumed and estimated cost of fuel (gas) for a journey or road trip.
Trip Distance: Mile(s) Kilometer(s)
Fuel Economy: miles per gallon [US] miles per gallon [Imp.] kilometers per liter liters per 100 kilometers gallons [US] per 100 miles
Gas Price: per gallon [US] per gallon [Imp.] per liter
Android: Use this trip fuel calculator offline with our all-in-one calculator app.
Fuel consumption calculation
We calculate the total fuel required to cover the distance with your vehicles fuel economy number and then multiply that with the gas price to find the total fuel cost for the trip.
Select the fuel economy unit used in your country from the options provided viz., miles per gallon (mpg) , kilometers per liter (kmpl) , liters per 100 kilometers and gallons per 100 miles . Our calculator will take care of all conversions required for finding the total fuel consumption and trip cost.
Related Calculators
- Gas Mileage Calculator
- Energy Consumption
- Resistor Color Code
© everydaycalculation.com
Fuel Consumption And Fuel Cost Calculator (gas Calculator)
This free fuel consumption calculator estimates the fuel cost of your trip based on average fuel consumption, trip distance, and fuel price! Use this gas calculator to find out consumption and price of the gas instantly!
Fuel Calculator
Table of contents, how to calculate fuel consumption, how to use gas calculator, why gas costs, public transportation, car-sharing or carpool, fuel-efficient vehicles, tune the engine, tire adjustment, proper motor oil, efficient travel planning, factors that impact the fuel prices, intervention by the government, financial markets, geographical area, weather or natural disasters, how does gas calculator work, what does mpg mean, gas mileage calculator.

Fuel Consumption And Fuel Cost Calculator (gas Calculator) English
Fuel consumption and fuel cost calculator (gas calculator) in other languages, how to add fuel consumption and fuel cost calculator (gas calculator) to my website.
You can easily add Fuel Consumption And Fuel Cost Calculator (gas Calculator) to your own website with the help of our code. Paste the code to your website and the calculator will appear on that spot automatically!
How to add Fuel Consumption And Fuel Cost Calculator (gas Calculator) widget to WordPress website?
Adding Fuel Consumption And Fuel Cost Calculator (gas Calculator) to your Wordpres website is fast and easy! Find the page to which you want to add the calculator, go to edit mode, click 'Text', and paste the code to there.
Other calculators in category other
Calculate how much money you can make with streaming royalties with our free online calculator
How much money artists make in Spotify? This Spotify money calculator helps you to calculate an estimation of earnings.
Use this free online text repeater to repeat any text. Works with apps: WhatsApp, Telegram Messenger, Facebook and SMS!
Our free hours calculator tells you precisely how many hours and minutes you have worked!
This tool can be used to calculate the characters contained in a text and display them.
This is an online tool that converts any number to words.
This month counter is a simple tool that can be used to determine the exact number of months between two dates.
Use this calculator to convert Roman numerals to numbers, and to convert numbers to Roman numerals!
To calculate the tip per person and the total cost per person, the Tip Calculator takes into account the cost of the service, the number of people, and the chosen tip percentage.
This is a virtual dice roller that can mimic any number of faces and generate random numbers simulating a dice roll based on the number of faces and dice
Calculate how long it will take to charge an electric car or hybrid car using with this calculator. Estimate time for a partial charge or to full capacity.
The crosswind calculator can assist you to find the headwind, crosswind, and tailwind components for the blowing winds.
This calculator calculates your weight on other planets and will show you how much you would weigh if you were to land on another planet in our Solar System.
The MPG Calculator (also known as the miles per gallon calculation) is a handy tool that can help you calculate your fuel consumption.
This test grade calculator is an essential tool for setting a scale of grading.
This online name picker allows you to choose a random name from any list or draw multiple names randomly from the list. It can be used for raffles, team selection, random prize distribution, and many other purposes.
This online letter generator can be used to generate random letters using the English alphabet. This online generator accepts custom input. You can use it to generate random letter sequences from any alphabet.
You can quickly determine what time it is in military times with our military time converter, also known as an Army Time Converter.
The calculator will determine the Easter date for any particular year.
Are you a coffee drinker? If so, then you'll love our coffee calculator. It will help you determine the optimum amount of coffee to drink each day in order to achieve the desired results.
This calculator helps you figure out how many balloons you need to inflate to reach the desired altitude!
The Population Density Calculator is a handy tool that allows you to determine population density in a specific area.
The Remainders in China Theorem refers to a system that contains congruences, and multiple simultaneous modular systems. The problem lies in calculating the number of elements that remain and how to solve it.
Our QR code generator makes it super simple to create personalized QR codes for your business or personal needs. Just enter the information you want to encode and voila! You'll have your own QR code in no time. Whether you want to promote your brand, upcoming events, or products, our generator can help you easily connect with your customers and share important information.
Gas Mileage (MPG) Calculator
Use this gas mileage calculator to easily calculate the gas mileage of a vehicle: car, bus, truck, etc. in miles per gallon (mpg), kilometers per liter... Calculate your fuel cost efficiency in USD per mile, miles per $, etc.
- How to calculate miles per gallon?
- MPG formula
- How to get better gas mileage?
- Fuel economy vs. fuel efficiency. The MPG illusion.
- Issues with averaging fuel economy in MPG
* see the explanation about the MPG illusion in the "Fuel economy vs. Fuel Efficiency. The MPG illusion." section below.
How to calculate miles per gallon?
To calculate gas mileage, using our MPG calculator or otherwise, you need to know three things: the previous reading of your odometer (in miles or kilometers), the current reading of the odometer, and the amount of fuel you put in your tank during the previous refill. That is all. Our online gas mileage calculator supports both gallons and miles, as well as liters and kilometers.
The output is gas mileage in mpg (miles per gallon) or km/l (kilometers per liter), depending on the metric system you chose. If you supply price per gallon or price per liter, the gas calculator will also output gas cost per mile and miles per 1 USD, and if using the metric system the fuel cost will be in currency per kilometer (e.g. $ per km) and km per $.
MPG formula
The formula to calculate mpg is:
Gas mileage mpg = (Current reading - Previous reading) / (Gas added to tank)
Calculating the cost per mile (or cost per kilometer), which is something our mpg calculator also does, is just a matter of a slight modification of the above formula:
Gas cost miles per $ = (Price per gallon x Gas added to tank) / (Current reading - Previous reading)
In both formulas above "current" and "previous" reading refers to the reading of your odometer in miles or kilometers at the point of the previous refilling of the tank and at the current (latest) one. These are also the equations used in our MPG calculator.
How to get better gas mileage?
If you don't like the result from our MPG calculator and wonder how you can get a better gas mileage from your vehicle, we have some advice for you. You can cover more miles (or kilometers) with less fuel by following these 10 tips for improving mpg that can result in significant savings in gas costs, especially when applied consistently:
- Drive sensibly - Driving aggressively, driving too fast compared to other cars, the practice of constantly overtaking other vehicles, and rapid acceleration followed by braking wastes a lot of gas. According to some estimates, quick starts and hard stops can increase gas consumption by more than 30% ! Driving sensibly can result in a huge improvement in mpg.
- Observe the speed limit - Different vehicles have optimal fuel economy at different velocities, but one way to increase gas mileage is to avoid driving at higher speeds. A small reduction of your speed, say from 70 mph to 60 mph (equivalently: from 115 km/h to 100 km/h) can help you save 10 to 20% due to lower fuel consumption. This will improve the results you see from our MPG calculator.
- Follow the leader - drive at about the speed of the vehicle in front of you, if they are following the first 2 tips above. This will make sure you need to accelerate and decelerate as little as possible. If possible, overtake drivers who do not follow them, as it will make it very hard for you to do so.
- Check your tires - make sure your tire pressure is at optimal levels as indicated in the owner's manual provided by the manufacturer. If the tire pressure is too low your mileage will decrease significantly, not to mention that the car may become dangerous to drive.
- Smart routing - try to take optimal paths to reach your desired destination. Learn the different modes of route selection your GPS supports - shortest is not always fastest and idling stuck in traffic will waste fuel. Use live map services such as Google Maps to monitor for traffic congestions on the planned route. Using a route you know well might also help improve gas efficiency as it will decrease the unnecessary changes of speed.
- Air conditioning - turning the air conditioning off will most likely improve your mpg efficiency by about 10-15%, and you will also accelerate quicker when needed. If it is necessary, make sure you do not set it to unreasonably low or high levels. Air temperature in the range between 64°F - 75°F (18°C - 24°C) is comfortable for most people. Due to the law of thermodynamics, each subsequent degree of heating or cooling requires progressively more energy to accomplish and maintain.
- Remove excess weight - make sure you remove all heavy items that you do not need in that particular trip from your trunk. The lighter the car, the better mpg calculation you will get from our gas calculator.
- Turn on cruise control - when driving on a highway, use your cruise control option. It will save you gas by keeping your speed constant better than you can.
- Avoid idling - idling results in a calculation of 0 miles per gallon. The larger the car engine, the more gas is wasted when idling. Avoid excessive idling, when possible, in line with point #5 above. This will result in a better MPG calculator result.
- Maintain your vehicle - a well-maintained car, truck, van, SUV, etc. will operate at greater efficiency. Exact mpg improvement is hard to calculate, as it will depend on the type of maintenance work your vehicle needs.

All the above advice will help, but what can you do if you have been following the above advice, yet our mpg calculator still results in very high numbers for gas costs? It could be time for a new, more efficient car, or it could be just the gas price fluctuations over which, unfortunately, you have no direct influence. Fuel prices in most locations include license fees and other state or local government taxes, in some places reaching as much as 50% of the final price. Financial market fluctuations, natural disasters or extreme weather, crisis, as well the geographical area you are in and the local fuel suppliers all influence the price of gas. All you can do is try to observe them and predict when you can get a more decent price.
Fuel economy vs. fuel efficiency. The MPG illusion.
To use an MPG calculator without being misled one needs to understand the MPG illusion. First, basic terminology. The term fuel economy is used when speaking about miles per gallon or kilometers per liter (mpg, km/l). The term fuel efficiency is used when speaking about gallons per mile or gallons per 1,000 miles, and liters per kilometer or liters per 100 km. The first is mostly used in the U.S., U.K., India, Japan, South Korea, Latin America, Denmark, Netherlands, while the second is preferred in most of Europe, Canada, Australia, New Zealand, China, Uruguay, Paraguay and a couple of other countries.
The relationship between the two is non-linear and improvements in miles per gallon can be very deceptive, while fuel efficiency in gallons per mile or liters per km are much more straightforward to understand, as noted on fueleconomy.gov [1] :
"While a miles per gallon (MPG) estimate is a required feature that has appeared on the fuel economy label for several decades, this metric can be potentially misleading when consumers compare fuel economy improvements, particularly when they use it in place of fuel costs. [...] A fuel consumption metric allows for more accurate energy usage comparisons among vehicles."
The graph below illustrates what the U.S. Department of Energy dubs "the MPG Illusion".

The difference in change rate, or the rate of improvement in MPG relative to the gallons a vehicle uses per 1,000 miles stems from the non-linear relationship between the two metrics. For example, an improvement of 5 MPG from 10 MPG to 15 MPG results in about 31 gallons saved over 1,000 miles, while the same 5 MPG improvement, but from 25 MPG to 30 MPG results in less than 7 gallons in fuel costs saved per 1,000 miles.
The illusion is more pronounced if you try to extrapolate or compare gas savings in lower MPG numbers to saving in higher MPG numbers. This MPG illusion is the reason our gas mileage calculator also outputs fuel efficiency in gallons per 1,000 miles.
Issues with averaging fuel economy in MPG
Fuel efficiency and fuel economy can be tricky concepts as demonstrated above, but this also extends to averaging MPG data. For example, let us say you want to compare two types of cars: A and B. You put two researchers, one American and one French, to the task, with the first using miles per gallon as an efficiency metric, and the second using gallons per mile. You have each researcher record the efficiency of 2 cars of each type (the data available is the same for both), and the results recorded by them look like so:
Data for car type A:
Data for car type B:
Average above means the arithmetic mean . The US engineer will see that for type A the average is 2.5 while for type B it is just 2.0, concluding that type A is more efficient than type B as it can cover a larger distance with a gallon of gas. The French will see that for type A the average is 0.625 while for type B it is 0.5 and will conclude that type B is more efficient than type A, as the car will use less fuel to cover the same distance. The two researchers would come to different conclusions as they are using different metrics! Note that our MPG calculator will produce both metrics for you automatically.
But who is right in the above example? Most people would argue that when we calculate gas efficiency we care about how much fuel we would need to cover a given distance . In such a case the French researcher is correct, as the average is misleading the US researcher. Here is an explanation why: if you were to take both cars of type A and want to cover 100 miles with each of them, you would need not 200 / 2.5 = 80 gallons, but 125 gallons of gas (100 gallons for the first car and 25 gallons for the second). The French will get it right by multiplying 200 x 0.625 = 125. For type B both researchers will correctly estimate that 100 gallons will be required for the same task. Therefore, type B is more efficient than type A.
However, if you define efficiency as covering the greatest distance given a certain fuel amount , then the US researcher would be correct. If we give each car of type A a gallon of fuel, they will cover 5 miles combined while giving each car of type B a gallon of fuel, they will cover only 4 miles combined. It follows that type A is more efficient than type B using this definition. Note that the mpg average is not misleading in this case, as it is 2.5 mpg, and 2 x 2.5 = 5, which is correct.
The above is an illustration of why when using our gas mileage calculator in mpg, as well as other such tools, it is important to keep track of the end goal and define the question at hand precisely, before measuring and making conclusions. It is also a lesson on applying appropriate data transformations. The arithmetic average is not invariant to monotonic transformations, so this is an issue when averaging performance of two or more vehicles, or when averaging the performance of a single vehicle in different situations , e.g. highway fuel consumption and city drive consumption could replace Car 1 and Car 2 in the above table and produce the same result.
The car example uses as basis one from Hand D. 1994 [2] .
References
1 U.S. Department of Energy, "Gasoline Vehicles: Learn More About the Label" [online] https://www.fueleconomy.gov/feg/label/learn-more-gasoline-label.shtml#fuel-consumption-rate - point 5: Fuel Consumption Rate, accessed on Mar 22, 2018
2 Hand D. (1994) "Deconstructing Statistical Questions", Journal of the Royal Statistical Society , Series A, Vol.157-3:317-356
Cite this calculator & page
If you'd like to cite this online calculator resource and information as provided on the page, you can use the following citation: Georgiev G.Z., "Gas Mileage (MPG) Calculator" , [online] Available at: https://www.gigacalculator.com/calculators/mpg-calculator.php URL [Accessed Date: 12 Apr, 2024].
Transportation calculators
Fuel Cost Calculator
This calculator can estimate fuel cost according to the distance of a trip, the fuel efficiency of the car, and the price of gas using various units.
Related Gas Mileage Calculator | Mileage Calculator
The price of gas may go up or down, but it's always a major expense for most drivers. The average American driver spends about $3,000 per year on gas, according to the American Automobile Association. Some of the practical ways to reduce fuel costs are listed below.
Use public transportation
Walking or biking does not consume fuel, and as such does not accumulate fuel cost. In most cases, public transport alternatives to cars such as buses, trains, and trolleys are viable options of reducing fuel costs. Due to the communal nature of ride sharing, the fuel costs of operating public transport are generally less than the fuel costs associated with each individual operating their own vehicle. In some places, public transport is free. Considering the costs associated with owning or renting a car creates even more incentive to use other modes of transportation.
Also known as car sharing, carpooling is the arrangement between two or more people to travel to a shared destination in a single vehicle. Although a heavier car consumes slightly more fuel, it is usually much more efficient than two people driving separate cars towards the same destination.
Use a more fuel efficient vehicle
Driving a smaller car makes a great difference – the fuel cost is about half for a small sedan than for a very large SUV. Similarly, drive with a less powerful engine than you need. Don't pay for an eight-cylinder engine when four cylinders work just fine. Unless you're hauling heavy loads on a routine basis, the extra cost of a bigger engine results in more money spent on gasoline.
Tune the engine
A properly tuned engine maximizes power and can greatly enhance fuel efficiency. But tuning the car engine is often done to increase horsepower – that's not the way to save on fuel. Make sure the tuner gets the message.
Fixing a car that is noticeably out of tune or has failed an emissions test can improve its gas mileage by an average of 4 percent – this amount will vary depending on the nature of the repair.
Fixing a serious maintenance problem, such as a faulty oxygen sensor, can improve your mileage by as much as 40 percent.
Placing ornaments and ground effects, aerodynamics kits, and airfoils, such as deck-lid spoilers, may make you feel good, but they also increase the car's drag and make it require more fuel. Such accessories offer no real handling enhancements, although they may look nice on your car. Also, place signs or cargo on the roof so that the object angles forward. This will reduce the frontal area of the object, and it will cause less drag, and cause you to use less fuel.
Adjust tires
Make sure the tires are inflated to the right levels. Properly inflated tires can reduce fuel consumption by up to 3 percent. Your tires also lose about 1 PSI per month, and when the tires are cold (e.g., in the winter), their pressure will decrease due to the thermal contraction of the air. It is recommended to check tires at least monthly, preferably weekly. Having properly inflated tires will also help you avoid uneven wear on the tread.
Gas stations don't always have accurate equipment for this purpose. Sometimes gas stations use automatic air compressors that stop at a pre-determined level. To make sure you inflate to the right level, double-check pressure with your own gauge.
Recommended inflation pressures are for cold tires; put about 3 PSI more in if the tires have been driven on a while. Inflate to the pressure recommended by the car manufacturer, not to the level stamped on the tire.
Use the correct motor oil
Gas mileage will improve by 1 percent to 2 percent if you use the manufacturer's recommended grade of motor oil. For example, using 10W-30 motor oil in an engine designed to use 5W-30 can reduce your gas mileage by a considerable amount. Using 5W-30 in an engine designed for 5W-20 can lower your gas mileage by 1 percent to 2 percent. Also, look for motor oil that says "Energy Conserving" on the API performance symbol to be sure it contains friction-reducing additives.
Plan trips carefully
There is no more obvious way to save gas than to drive a shorter distance.
Plan your route carefully. With today's GPS route planners, it's easy to calculate a straight route with the fewest stops and diversions. It is also possible to judge which route will have the least traffic. Take highways instead of local routes or city streets when possible – the steady speed maximizes fuel efficiency.
When driving in a city, try to park in a central location, and then walk from one appointment to another, or take public transportation. Ragged stop-and-go city driving is terrible for your gas mileage. This also saves the high level of gas used in parking and pulling out in a parking lot.
Factors that determine the fuel price
Government intervention.
Governments may intervene in gasoline (referred to as petrol in some parts of the world) markets by taxation, which may raise prices for consumers within or outside the governmental territory. Similarly, certain industries may receive financial support from the government to promote commercial enterprise (a subsidy). Generally, subsidized products or services can be sold at lower prices.
Financial markets
The global oil price fluctuates constantly. The key crudes quoted are Brent and West Texas Intermediate (WTI) in the unit of US$ per barrel. The retail fuel price is closely related to the global oil price fluctuation.
Political elements such as structure, regime, personnel, and events can all affect the cost of fuel. For instance, a change in leadership from a leader who doesn't believe in climate change to one who does may result in changes to the cost of fuel for consumers based on different policies, such as choosing not to subsidize fuel. Political relationships between countries are also a factor; nations can go to war over resources, or form alliances in order to trade, both of which can affect the cost of fuel.
Geographic area
Certain geographical areas or countries in the world have an abundance of oil, while others do not have a single drop. Regional consumers within close proximity of high supplies of oil are more likely to have lower costs of fuel due to ease of access. Areas without their own supply of oil that are isolated from the rest of the world (such as islands in the Pacific) can find fuel to be relatively expensive.
Natural disaster or weather
Earthquakes, tsunamis, hurricanes, major floods, and other such nature-related phenomena can affect the production, manufacturing, and logistics of gasoline, which can possibly affect the price of fuel. For instance, a snowstorm may close certain roads, disallowing the transportation of the resource and driving up fuel costs in these areas. Hurricanes or earthquakes can damage oil refineries, abruptly halting production, which can also eventually increase fuel costs.
- PRO Courses Guides New Tech Help Pro Expert Videos About wikiHow Pro Upgrade Sign In
- EDIT Edit this Article
- EXPLORE Tech Help Pro About Us Random Article Quizzes Request a New Article Community Dashboard This Or That Game Popular Categories Arts and Entertainment Artwork Books Movies Computers and Electronics Computers Phone Skills Technology Hacks Health Men's Health Mental Health Women's Health Relationships Dating Love Relationship Issues Hobbies and Crafts Crafts Drawing Games Education & Communication Communication Skills Personal Development Studying Personal Care and Style Fashion Hair Care Personal Hygiene Youth Personal Care School Stuff Dating All Categories Arts and Entertainment Finance and Business Home and Garden Relationship Quizzes Cars & Other Vehicles Food and Entertaining Personal Care and Style Sports and Fitness Computers and Electronics Health Pets and Animals Travel Education & Communication Hobbies and Crafts Philosophy and Religion Work World Family Life Holidays and Traditions Relationships Youth
- Browse Articles
- Learn Something New
- Quizzes Hot
- This Or That Game New
- Train Your Brain
- Explore More
- Support wikiHow
- About wikiHow
- Log in / Sign up
- Cars & Other Vehicles
- Driving Vehicles
- Efficient Driving
How to Compute Your Car’s Fuel Consumption
Last Updated: February 13, 2024 Fact Checked
Finding Fuel Consumption
Calculating average fuel consumption, maximizing fuel efficiency.
This article was co-authored by Simon Miyerov and by wikiHow staff writer, Devin McSween . Simon Miyerov is the President and Driving Instructor for Drive Rite Academy, a driving academy based out of New York City. Simon has over 8 years of driving instruction experience. His mission is to ensure the safety of everyday drivers and continue to make New York a safer and efficient driving environment. There are 13 references cited in this article, which can be found at the bottom of the page. This article has been fact-checked, ensuring the accuracy of any cited facts and confirming the authority of its sources. This article has been viewed 705,500 times.
With the price of fuel going up all the time, you’re probably more aware of how much it takes to fill up your car. Knowing your car’s fuel consumption can help maximize your fuel efficiency, but how do you calculate that? Well, you’ve come to the right place! In this article, we’ll tell you how to find your car’s fuel consumption with 2 simple formulas and give you tips on improving your fuel efficiency. Read on to learn more!
Things You Should Know
- Use the formula Distance Driven ÷ Fuel Used to find your car’s fuel consumption.
- Fill up your car’s gas tank and set your trip odometer to 0. Then, drive your car until your gas tank is empty.
- Refuel your car, recording the number of gallons or liters it takes to fill up your gas tank and the distance you drove from the trip odometer reading.

- The best time to record your fuel consumption is right after you fill your car with gas.

- Your trip odometer will say "0 miles" or “0 kilometers.”
- If you don't have a trip odometer, record the number of miles or kilometers on your car as your "Starting Distance." For example, if your car has 10,000 miles or kilometers on it when you fill your tank, write "10,000."

- It’s important to refill your tank completely when calculating your fuel consumption. Otherwise, you don't know how much gas your car has used since your last tank.

- If you do not have a trip odometer, subtract your "Starting Distance" from your current odometer reading to find out how far you traveled. If your “Starting Distance” was 10,000 and your odometer now says 10,250, subtract 10,000. So, you drove 250 miles or kilometers on that tank of gas.

- If you use kilometers and liters, divide the fuel you used by the kilometers you traveled. Then, multiply the result by 100 to get "liters per 100 kilometers".
- You have to start with a full tank and fill your gas tank all the way back up to know exactly how much gas your car consumed.

- Fuel Consumption = (Final Distance - Starting Distance) / Fuel Usage
- Fuel Consumption = (23,889 mi - 23,500 mi) / 12.5 gallons
- Fuel Consumption = 389 mi / 12.5 gallons
- Fuel Consumption = 31.1 mpg

- Using cruise control can help you get better fuel consumption.
- Fuel consumption gets worse the faster you drive.
- Since AC burns gasoline, using it diminishes your fuel consumption. [8] X Trustworthy Source FuelEconomy.gov Official source for the U.S. government for fuel economy information Go to source

- Say, for example, that you calculated your fuel consumption on a day that you drove into the mountains, which you don’t normally do. Climbing uphill uses more fuel, so your fuel consumption on that day is lower than it normally is.

- If you don't have an odometer, record how many miles are on your car with a full tank of gas as your “Starting Distance.”

- You do not need to fill your car all the way up each time. All you need to do is record the number of gallons or liters you put in your car to calculate fuel consumption.

- If you filled up 3 times, once using 12 gallons, the other 3 gallons, and the last time using 10 gallons, your total gas usage is 25 gallons.

- For example, if you used 25 gallons of gas, and drove 500 miles during that time, then your average fuel consumption is 20 miles per gallon (500 miles / 25 gallons = 20 mpg).

- If your calculation is drastically different from the suggested average, get your car checked out by a mechanic. An engine issue or part malfunction may cause your car to use fuel less efficiently.

- Running AC on max can decrease your fuel economy by almost 25%.

- Leave space between you and other vehicles so you’re able to come safely to a stop in case of an emergency.
- Brake and accelerate gently instead of slamming on either pedal. [15] X Trustworthy Source Consumer Reports Nonprofit organization dedicated to consumer advocacy and product testing Go to source

- Some cars list the proper tire pressure on a sticker on the driver's side door or the glove compartment.

- Replacing the air filter on newer cars doesn’t help as much with fuel efficiency. It will, however, make it easier for your car to accelerate without issues. [18] X Trustworthy Source FuelEconomy.gov Official source for the U.S. government for fuel economy information Go to source

Community Q&A

- Don't speed up and slow down irregularly. This wastes fuel, especially in big SUV and Sedan type vehicles. Thanks Helpful 0 Not Helpful 1
- Always observe the posted speed limit when you’re driving. Thanks Helpful 0 Not Helpful 0
- It’s a good idea to turn your car off when you know you’ll be stopped for a long period of time (e.g. waiting to pick up someone at the airport). Generally, turning your car off at stop lights isn’t helpful since you’re typically only stopped for no more than 2 minutes. Thanks Helpful 0 Not Helpful 0

You Might Also Like

- ↑ https://www.calculatorsoup.com/calculators/tools/gas-mileage-calculator.php
- ↑ https://www.fueleconomy.gov/mpg/MPG.do?action=calcMPG
- ↑ https://www.caranddriver.com/research/a31518112/what-is-good-gas-milage/
- ↑ http://www.fueleconomy.gov/feg/drive.shtml
- ↑ https://skywayholdings.com/news-single/easy-ways-to-calculate-fuel-consumption
- ↑ https://skywayholdings.com/news-single/easy-ways-to-calculate-fuel-consumption
- ↑ http://www.consumerreports.org/cro/magazine/2013/08/the-mpg-gap/index.htm
- ↑ http://www.fueleconomy.gov/feg/factors.shtml
- ↑ http://www.fueleconomy.gov/feg/driveHabits.jsp
- ↑ https://www.fueleconomy.gov/feg/factors.shtml
- ↑ http://www.consumerreports.org/cro/2012/01/how-to-save-money-on-gas/index.htm
- ↑ http://www.fueleconomy.gov/feg/maintain.jsp
- ↑ http://www.lifehacker.co.uk/2014/06/26/hypermile-driving-secrets-max-petrol-mileage
About This Article

To calculate fuel consumption, start by writing down how many miles you have on your car and then filling up the gas tank. Then, drive your car around until the gas tank is nearly empty. When the tank is almost empty, refill it and write down how many gallons of gas you needed and how many miles you've driven since the last time you filled up. Finally, divide the number of miles you drove by the number of gallons you put in the tank to find how many miles per gallon your car gets. To learn how to find the average fuel consumption for your vehicle, scroll down! Did this summary help you? Yes No
- Send fan mail to authors
Reader Success Stories
Kwesi Aryee
May 20, 2017
Did this article help you?

Apr 17, 2017
Oct 9, 2023
Harrison Akaho
Sep 30, 2017
Swaroop Singh
Dec 10, 2016

Featured Articles

Trending Articles

Watch Articles

- Terms of Use
- Privacy Policy
- Do Not Sell or Share My Info
- Not Selling Info
Don’t miss out! Sign up for
wikiHow’s newsletter

Today in Energy
- Recent articles
- liquid fuels
- natural gas
- electricity
- oil/petroleum
- production/supply
- consumption/demand
- exports/imports
- international
- forecasts/projections
- steo (short-term energy outlook)
Less U.S. jet fuel consumption on average in 2022 than in 2019
Average jet fuel consumption in the United States so far in 2022 has been consistently below 2019, although airline passenger counts in the United States have nearly returned to 2019 levels in recent months, based on Transportation Security Administration (TSA) reports. So far in 2022, jet fuel consumption has averaged 1.5 million barrels per day (b/d), according to weekly product supplied data reported in our Weekly Petroleum Status Report . By comparison, consumption of jet fuel in all of 2019 averaged 1.7 million b/d.
In 2020, U.S. jet fuel consumption fell significantly because of restricted air travel aimed at reducing the spread of COVID-19. As travel restrictions and other responses to the COVID-19 pandemic eased in the latter part of 2020 and especially into 2021, consumption of jet fuel gradually increased. In the second half of 2021, U.S. consumption grew to 1.5 million b/d and has remained at that level through 2022.
Jet fuel consumption has remained somewhat steady since July 2021, although passenger data from TSA suggest that the number of air passengers has grown closer to 2019 numbers throughout 2022. The increasing number of passengers and yet unchanging jet fuel demand may reflect airlines’ measures to ensure that flights are full. Constraints on labor supply , as well as high fuel prices, have led air carriers to consolidate flights despite growing passenger demand.
Even though relatively less jet fuel has been consumed in the United States this year than in 2019, supplies of jet fuel have remained tight in 2022, both globally and in the United States. So far this year, less jet fuel has been held in U.S. inventories than the previous five-year (2017–21) average. Tighter jet fuel supplies this year stem from a number of factors, including disruptions in global petroleum trade following Russia’s full-scale invasion of Ukraine, the associated sanctions on Russia, and less export of petroleum product from China.
This tighter balance between supply and demand has resulted in less jet fuel in inventories and in higher prices. During the spring, inventories decreased sharply after Russia’s invasion. In response to high prices during the summer, refiners made greater use of their facilities in order to maximize production of all liquid fuels, growing jet inventories to only slightly less than their previous five-year average. Less use of refineries in September and October, when refiners were undergoing seasonal maintenance, contributed to inventory levels dipping back below the previous five-year low during that time.
Principal contributor: Kevin Hack
Tags: jet fuel , liquid fuels , petroleum products , consumption/demand

Explore trends in transport technologies and emissions across the world.
By Hannah Ritchie and Max Roser
First published in September 2021.
Road travel
Passenger vehicle registrations by type.
These interactive charts show the breakdown of new passenger vehicle registrations by type.
This is broken down by: petroleum; diesel; full hybrid (excluding plug-in hybrids); plug-in electric hybrids; and fully electric battery vehicles.
Number of new passenger vehicle registrations by type
Electric vehicle registrations.
This interactive chart shows the share of new passenger vehicle registrations that are battery electric vehicles. This does not include plug-in hybrid vehicles.
This interactive chart shows the share of new passenger vehicle registrations that are battery electric plus plug-in hybrid vehicles.
Carbon intensity of new passenger vehicles
This interactive chart shows the average carbon intensity of new passenger vehicles in each country.
This is measured as the average emissions of CO₂ (in grams) per kilometer travelled across all types of passenger vehicles.
Fuel economy of new passenger vehicles
This interacrive chart shows the average fuel economy of new passenger vehicles in each country.
This is measured as the average liters consumed per 100 kilometers travelled, across all types of passenger vehicles.
What share of global CO 2 emissions come from aviation?
Flying is a highly controversial topic in climate debates. There are a few reasons for this.
The first is the disconnect between its role in our personal and collective carbon emissions. Air travel dominates a frequent traveller's individual contribution to climate change. Yet aviation overall accounts for only 2.5% of global carbon dioxide (CO 2 ) emissions. This is because there are large inequalities in how much people fly – many do not, or cannot afford to, fly at all. 1
The second is how aviation emissions are attributed to countries. CO 2 emissions from domestic flights are counted in a country’s emission accounts. International flights are not – instead they are counted as their own category: ‘bunker fuels’. The fact that they don’t count towards the emissions of any country means there are few incentives for countries to reduce them.
It’s also important to note that unlike the most common greenhouse gases – carbon dioxide, methane or nitrous oxide – non-CO 2 forcings from aviation are not included in the Paris Agreement. This means they could be easily overlooked – especially since international aviation is not counted within any country’s emissions inventories or targets.
How much of a role does aviation play in global emissions and climate change? In this article we take a look at the key numbers that are useful to know.
Global aviation (including domestic and international; passenger and freight) accounts for:
- 1.9% of greenhouse gas emissions (which includes all greenhouse gases, not only CO 2 )
- 2.5% of CO 2 emissions
- 3.5% of 'effective radiative forcing' – a closer measure of its impact on warming.
The latter two numbers refer to 2018, and the first to 2016, the latest year for which such data are available.
Aviation accounts for 2.5% of global CO 2 emissions
As we will see later in this article, there are a number of processes by which aviation contributes to climate change. But the one that gets the most attention is its contribution via CO 2 emissions. Most flights are powered by jet gasoline – although some partially run on biofuels – which is converted to CO 2 when burned.
In a recent paper, researchers – David Lee and colleagues – reconstructed annual CO 2 emissions from global aviation dating back to 1940. 2 This was calculated based on fuel consumption data from the International Energy Agency (IEA), and earlier estimates from Robert Sausen and Ulrich Schumann (2000). 3
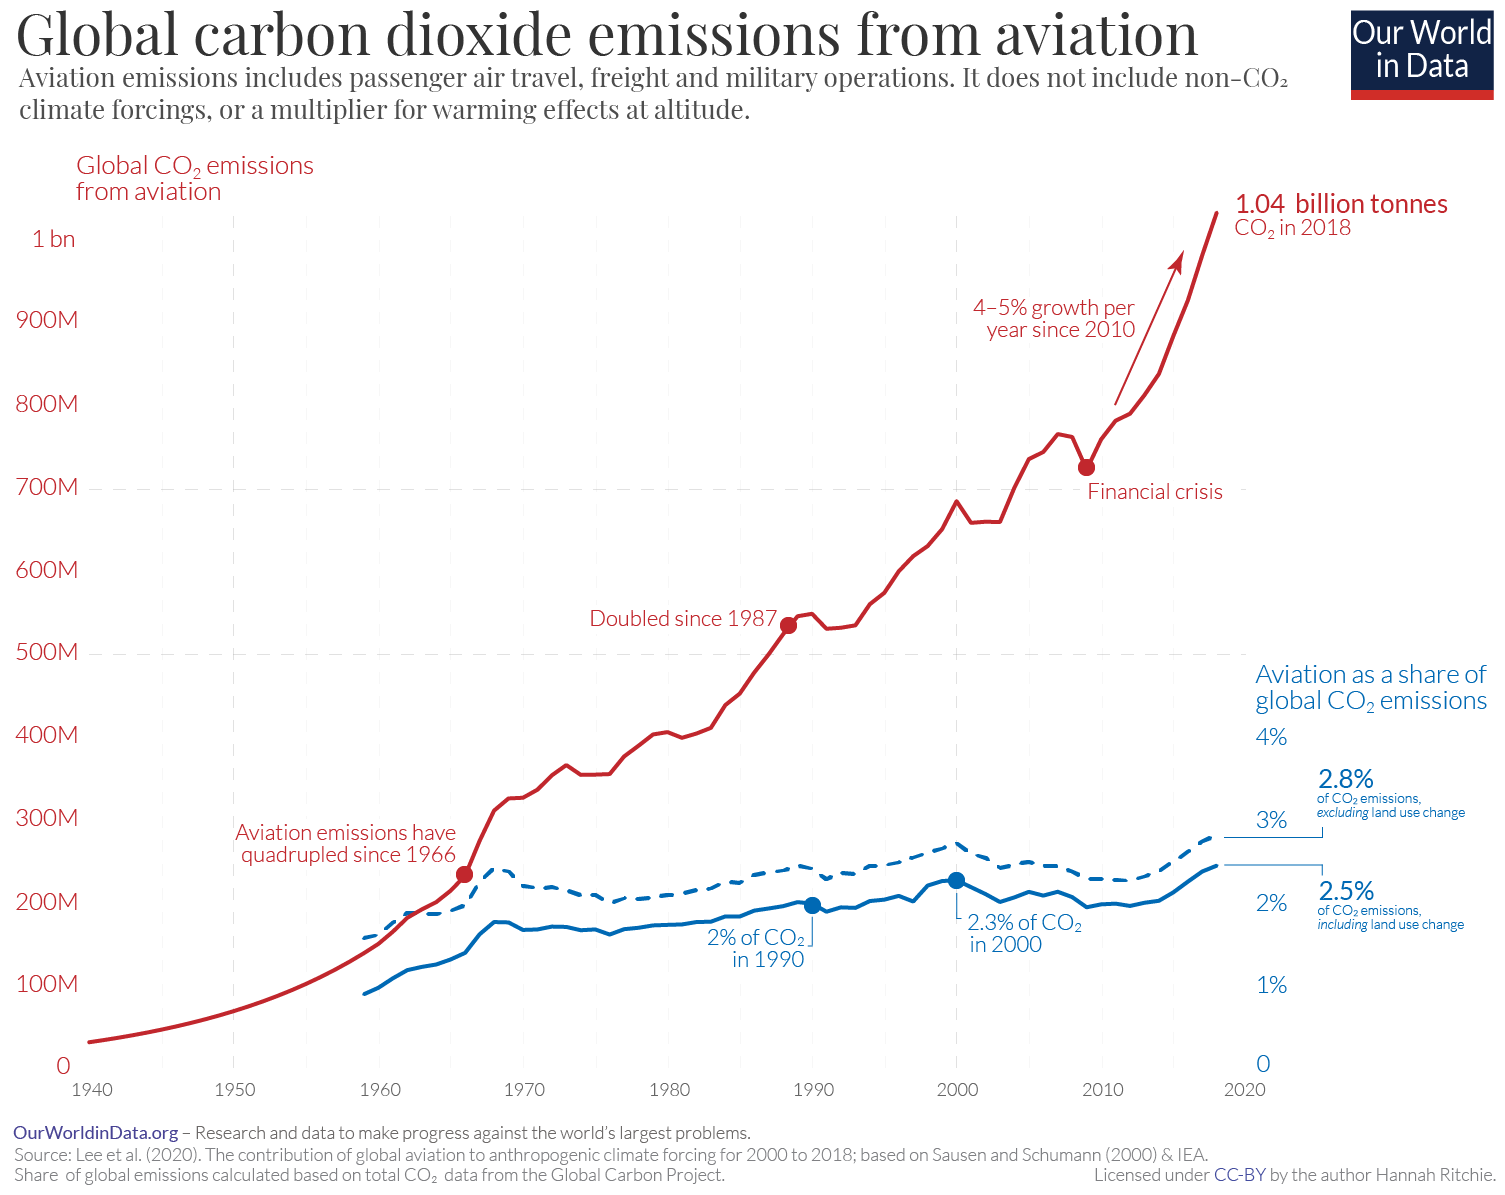
The time series of global emissions from aviation since 1940 is shown in the accompanying chart. In 2018, it’s estimated that global aviation – which includes both passenger and freight – emitted 1.04 billion tonnes of CO 2 .
This represented 2.5% of total CO 2 emissions in 2018. 4 , 5
Aviation emissions have doubled since the mid-1980s. But, they’ve been growing at a similar rate as total CO 2 emissions – this means its share of global emissions has been relatively stable: in the range of 2% to 2.5%. 6
Non-CO 2 climate impacts mean aviation accounts for 3.5% of global warming
Aviation accounts for around 2.5% of global CO 2 emissions, but it’s overall contribution to climate change is higher. This is because air travel does not only emit CO 2 : it affects the climate in a number of more complex ways.
As well as emitting CO 2 from burning fuel, planes affect the concentration of other gases and pollutants in the atmosphere. They result in a short-term increase, but long-term decrease in ozone (O 3 ); a decrease in methane (CH 4 ); emissions of water vapour; soot; sulfur aerosols; and water contrails. While some of these impacts result in warming, others induce a cooling effect. Overall, the warming effect is stronger.
David Lee et al. (2020) quantified the overall effect of aviation on global warming when all of these impacts were included. 2 To do this they calculated the so-called ‘Radiative Forcing’. Radiative forcing measures the difference between incoming energy and the energy radiated back to space. If more energy is absorbed than radiated, the atmosphere becomes warmer.
In their chart we see their estimates for the radiative forcing of the different elements. When we combine them, aviation accounts for approximately 3.5% of effective radiative forcing: that is, 3.5% of warming.
Although CO 2 gets most of the attention, it accounts for less than half of this warming. Two-thirds (66%) comes from non-CO 2 forcings. Contrails – water vapor trails from aircraft exhausts – account for the largest share.
We don’t yet have the technologies to decarbonize air travel
Aviation’s contribution to climate change – 3.5% of warming, or 2.5% of CO 2 emissions – is often less than people think. It’s currently a relatively small chunk of emissions compared to other sectors.
The key challenge is that it is particularly hard to decarbonize. We have solutions to reduce emissions for many of the largest emitters – such as power or road transport – and it’s now a matter of scaling them. We can deploy renewable and nuclear energy technologies, and transition to electric cars. But we don’t have proven solutions to tackle aviation yet.
There are some design concepts emerging – Airbus, for example, have announced plans to have the first zero-emission aircraft by 2035, using hydrogen fuel cells. Electric planes may be a viable concept, but are likely to be limited to very small aircraft due to the limitations of battery technologies and capacity.
Innovative solutions may be on the horizon, but they’re likely to be far in the distance.
Towards zero-carbon transport: how can we expect the sector’s CO2 emissions to change in the future?
Additional information.
Global emissions from aviation have increased a lot over the past half-century. However, air travel volumes increased even more rapidly.
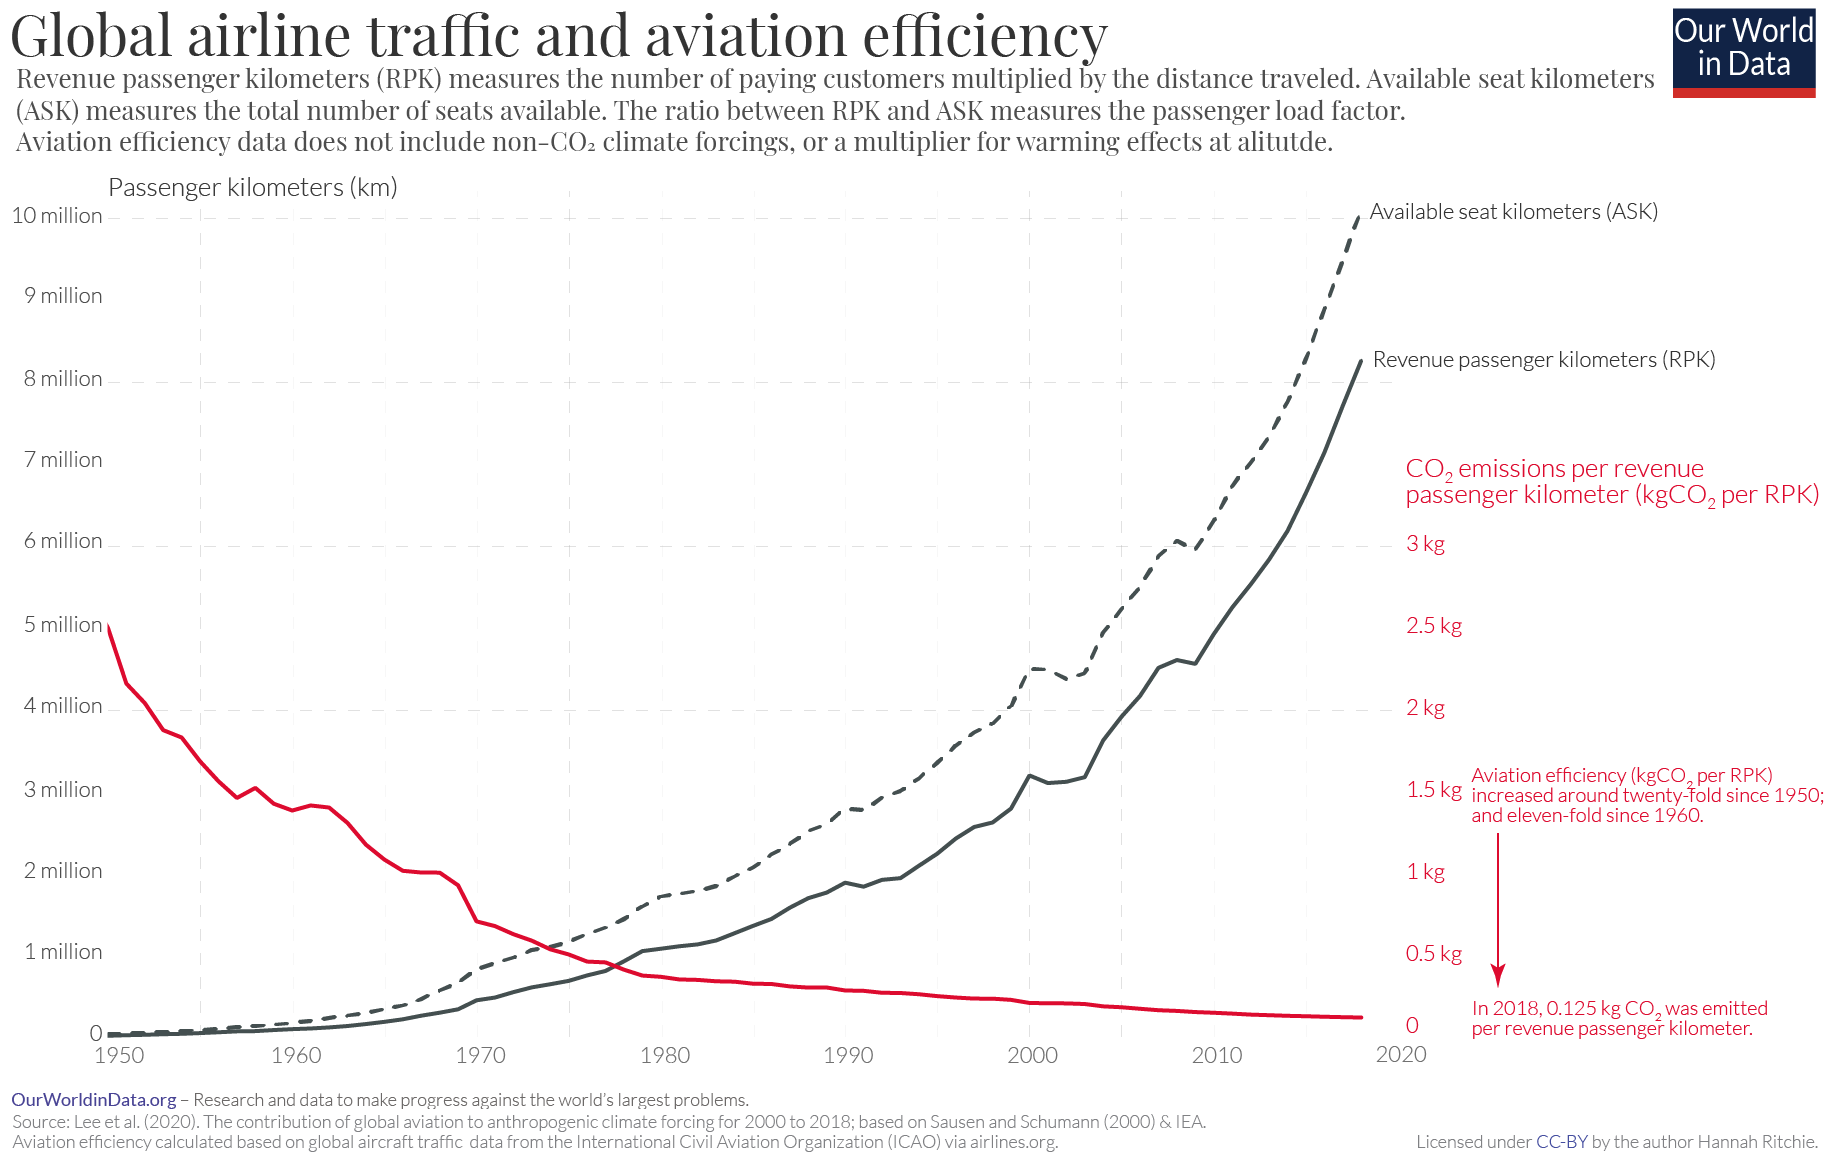
Since 1960, aviation emissions increased almost seven-fold; since 1970 they’ve tripled. Air traffic volume – here defined as revenue passenger kilometers (RPK) traveled – increased by orders of magnitude more : almost 300-fold since 1950; and 75-fold since 1960. 7
The much slower growth in emissions means aviation efficiency has seen massive improvements. In the chart we show both the increase in global airline traffic since 1950, and aviation efficiency, measured as the quantity of CO 2 emitted per revenue passenger kilometer traveled. In 2018, approximately 125 grams of CO 2 were emitted per RPK. In 1960, this was eleven-fold higher; in 1950 it was twenty-fold higher. Aviation has seen massive efficiency improvements over the past 50 years.
These improvements have come from several sources: improvements in the design and technology of aircraft; larger aircraft sizes (allowing for more passengers per flight); and an increase in how ‘full’ passenger flights are. This last metric is termed the ‘passenger load factor’. The passenger load factor measures the actual number of kilometers traveled by paying customers (RPK) as a percentage of the available seat kilometers (ASK) – the kilometers traveled if every plane was full. If every plane was full the passenger load factor would be 100%. If only three-quarters of the seats were filled, it would be 75%.
The global passenger load factor increased from 61% in 1950 to 82% in 2018 .
Passenger vs. freight; domestic vs. international: where do aviation emissions come from?
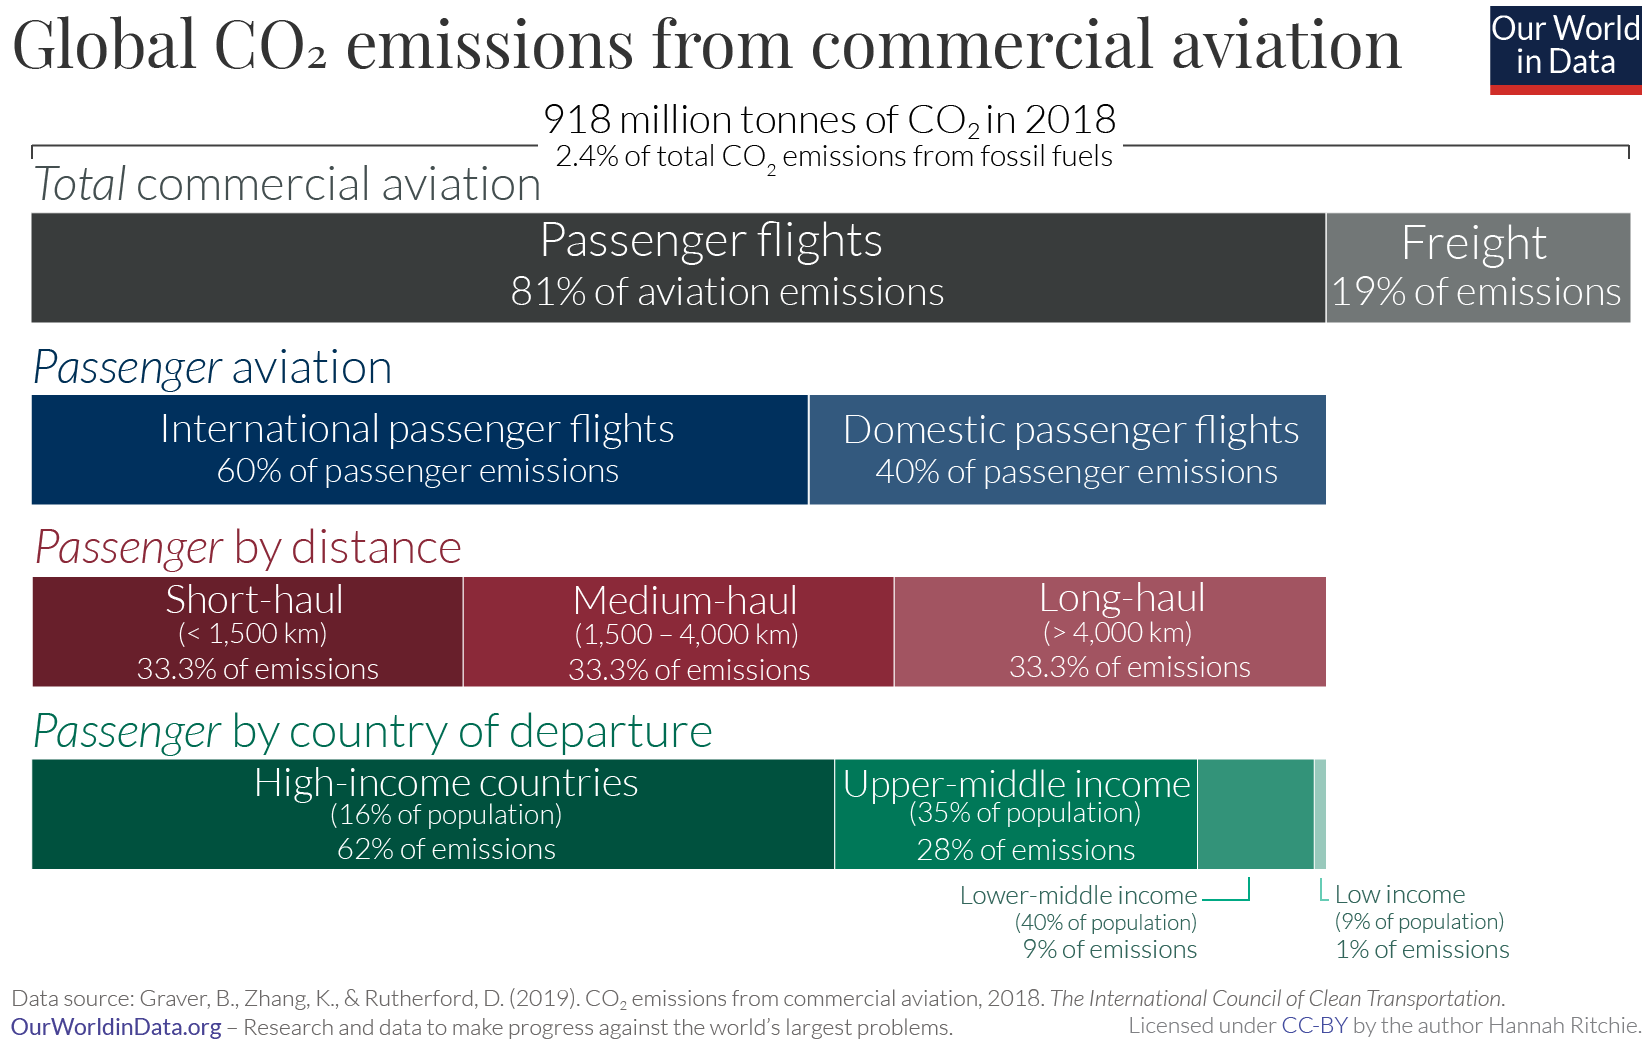
Global aviation – both passenger flights and freight – emits around one billion tonnes of carbon dioxide (CO 2 ) each year. This was equivalent to around 2.4% of CO 2 emissions in 2018.
How do global aviation emissions break down?
The chart gives the answer. This data is sourced from the 2019 International Council on Clean Transportation(ICCT) report on global aviation. 8
Most emissions come from passenger flights – in 2018, they accounted for 81% of aviation’s emissions; the remaining 19% came from freight, the transport of goods.
Sixty percent of emissions from passenger flights come from international travel; the other 40% come from domestic (in-country) flights.
When we break passenger flight emissions down by travel distance, we get a (surprisingly) equal three-way split in emissions between short-haul (less than 1,500 kilometers); medium-haul (1,500 to 4,000 km); and long-haul (greater than 4,000 km) journeys.
The richest half are responsible for 90% of air travel CO 2 emissions
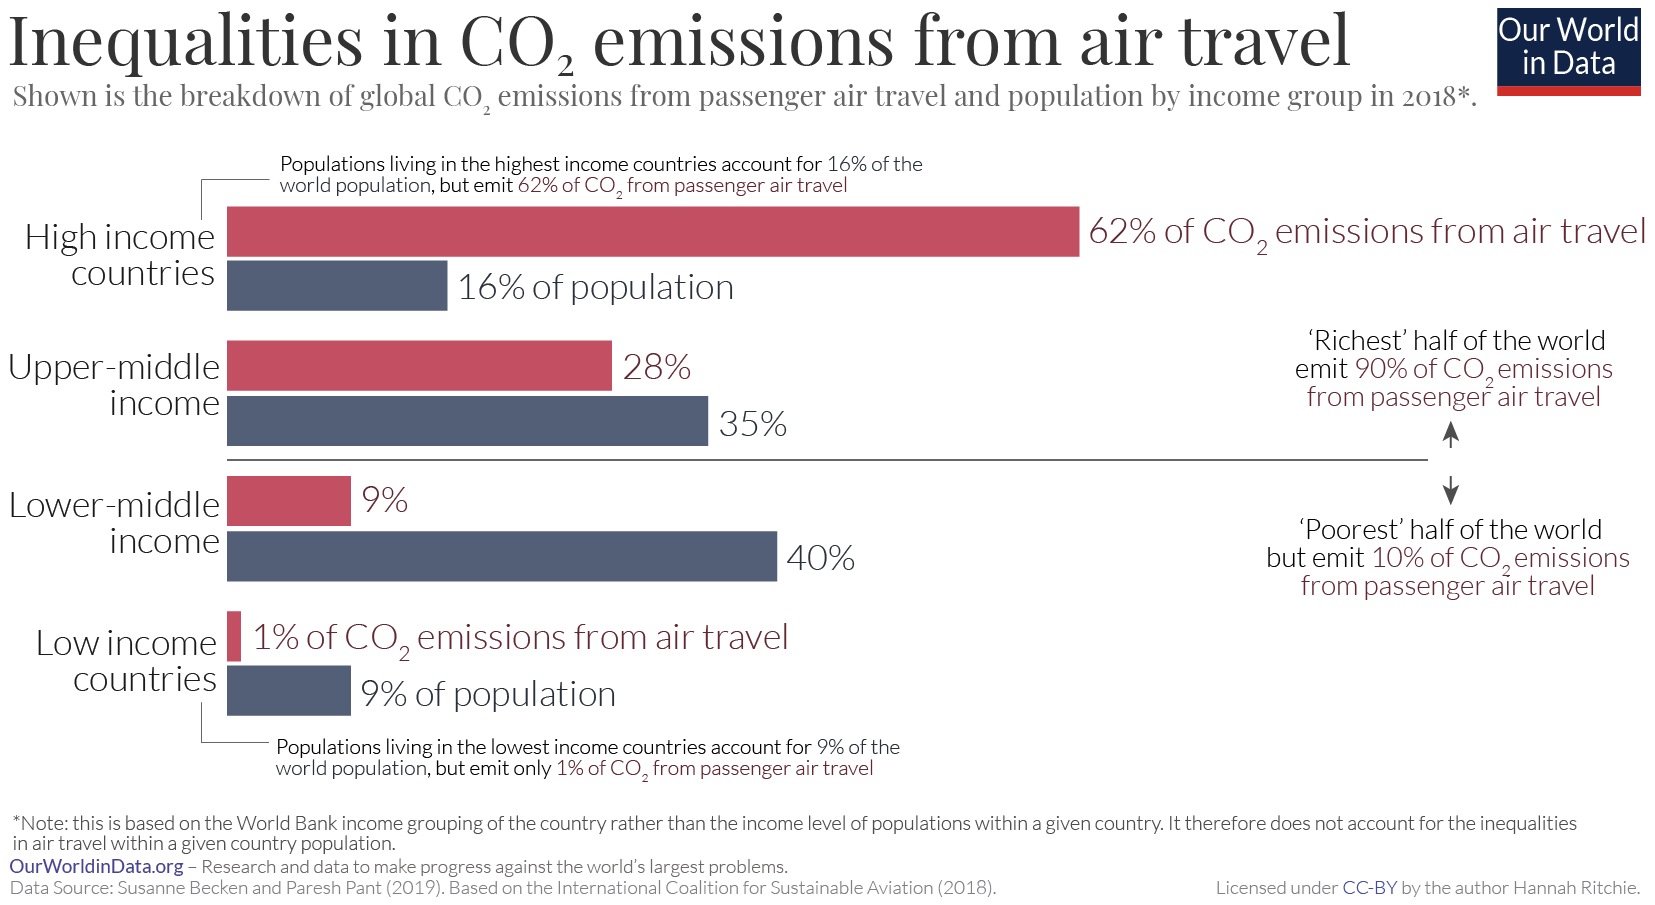
The global inequalities in how much people fly become clear when we compare aviation emissions across countries of different income levels. The ICCT split these emissions based on World Bank's four income groups .
A further study by Susanne Becek and Paresh Pant (2019) compared the contribution of each income group to global air travel emissions versus its share of world population. 9 This comparison is shown in the visualization.
The ‘richest’ half of the world (high and upper-middle income countries) were responsible for 90% of air travel emissions. 10
Looking at specific income groups:
- Only 16% of the world population live in high-income countries yet the planes that take off in those countries account for almost two-thirds (62%) of passenger emissions;
- Upper-middle income countries are home to 35% of the world population, and contribute 28% of emissions;
- Lower-middle income countries are home to the largest share (40% of the world), yet emit the planes taking off there just account for 9%;
- The poorest countries – which are home to 9% of the world population – emit just 1%.
In an upcoming article we will look in more detail at the contribution of each country to global aviation emissions.
Where in the world do people have the highest carbon footprint from flying?
Aviation accounts for around 2.5% of global carbon dioxide (CO 2 ) emissions. But if you are someone who does fly, air travel will make up a much larger share of your personal carbon footprint.
The fact that aviation is relatively small for global emissions as a whole, but of large importance for individuals that fly is due to large inequalities in the world. Most people in the world do not take flights. There is no global reliable figure, but often cited estimates suggest that more than 80% of the global population have never flown. 11
How do emissions from aviation vary across the world? Where do people have the highest footprint from flying?
Per capita emissions from domestic flights
The first and most straightforward comparison is to look at emissions from domestic aviation – that is, flights that depart and arrive in the same country.
This is easiest to compare because domestic aviation is counted in each country’s inventory of greenhouse gas emissions. International flights, on the other hand, are not attributed to specific countries – partly because of contention as to who should take responsibility (should it be the country of departure or arrival? What about layover flights?).
In the chart here we see the average per capita emissions from domestic flights in 2018. This data is sourced from the International Council on Clean Transportation – we then used UN population estimates to calculate per capita figures. 12 , 13
We see large differences in emissions from domestic flights across the world. In the United States the average person emits around 386 kilograms of CO 2 each year from internal flights. This is followed by Australia (267 kg); Norway (209 kg); New Zealand (174 kg); and Canada (168 kg). Compare this with countries at the bottom of the table – many across Africa, Asia, and Eastern Europe in particular emit less than one kilogram per person – just 0.8 kilograms; or 0.14 kilograms in Rwanda. For very small countries where there are no internal commercial flights, domestic emissions are of course, zero.
There are some obvious factors that explain some of these cross-country differences. Firstly, countries that are richer are more likely to have higher emissions because people can afford to fly. Second, countries that have a larger land mass may have more internal flights – and indeed we see a correlation between land area and domestic flight emissions; in small countries people are more likely to travel by other means such as car or train. And third, countries that are more geographically-isolated – such as Australia and New Zealand – may have more internal travel.
Related charts:
Total co₂ emissions from domestic aviation, share of global co₂ emissions from domestic aviation, per capita emissions from international flights.
Allocating emissions from international flights is more complex. International databases report these emissions separately as a category termed ‘bunker fuels’. The term ‘bunker fuel’ is used to describe emissions which come from international transport – either aviation or shipping.
Because they are not counted towards any particular country these emissions are also not taken into account in the goals that are set by countries in international treaties like the Kyoto protocol or the Paris Agreement. 14
But if we wanted to allocate them to a particular country, how would we do it? Who do emissions from international flights belong to: the country that owns the airline; the country of departure; the country of arrival?
Let’s first take a look at how emissions would compare if we allocated them to the country of departure . This means, for example, that emissions from any flight that departs from Spain are counted towards Spain’s total. In the chart here we see international aviation emissions in per capita terms.
Some of the largest emitters per person in 2018 were Iceland (3.5 tonnes of CO 2 per person); Qatar (2.5 tonnes); United Arab Emirates (2.2 tonnes); Singapore (1.7 tonnes); and Malta (992 kilograms).
Again, we see large inequalities in emissions across the world – in many lower-income countries per capita emissions are only a few kilograms: 6 kilograms in India, 4 kilograms in Nigeria; and only 1.4 kilograms in the Democratic Republic of Congo.
Total CO₂ emissions from international aviation
Share of global co₂ emissions from international aviation, per capita emissions from international flights – adjusted for tourism.
The above allocation of international aviation emissions to the country of departure raises some issues. It is not an accurate reflection of the local population of countries that rely a lot on tourism, for example. Most of the departing flights from these countries are carrying visiting tourists rather than locals.
One way to correct for this is to adjust these figures for the ratio of inbound to outbound travellers. This approach was applied in an analysis by Sola Zheng for the International Council on Clean Transportation . This attempts to distinguish between locals traveling abroad and foreign visitors traveling to that country on the same flight. 15 For example, if we calculated that Spain had 50% more incoming than outgoing travellers, we would reduce its per capita footprint from flying by 50%. If the UK had 75% more outgoing travellers than incoming, we’d increase its footprint by 75%.
We have replicated this approach and applied this adjustment to these figures by calculating the inbound:outbound tourist ratio based on flight departures and arrival data from the World Bank .
How does this affect per capita emissions from international flights? The adjusted figures are shown in the chart here.
As we would expect, countries which are tourist hotspots see the largest change. Portugal’s emissions, for example, fall from 388 to just 60 kilograms per person. Portuguese locals are responsible for much fewer travel emissions than outgoing tourists. Spanish emissions fall from 335 to 77 kilograms per person.
On the other hand, countries where the locals travel elsewhere see a large increase. In the UK, they almost double from 422 to 818 kilograms.
Per capita emissions from domestic and international flights
Let’s combine per capita emissions from domestic and international travel to compare the total footprint from flying.
This is shown in the interactive map [we’ve taken the adjusted international figures – you can find the combined figures without tourism-adjustment here ].
The global average emissions from aviation were 103 kilograms. The inequality in emissions across the world becomes clear when this is broken down by country.
At the top of the table lies the United Arab Emirates – each person emits close to two tonnes – 1950 kg – of CO 2 from flying each year. That’s 200 times the global average. This was followed by Singapore (1173 kilograms); Iceland (1070 kg); Finland (1000 kg); and Australia (878 kilograms).
To put this into perspective: a return flight (in economy class) from London to Dubai/United Arab Emirates would emit around one tonne of CO 2 . 16 So the two-tonne average for the UAE is equivalent to around two return trips to London.
In many countries, most people do not fly at all. The average Indian emits just 18 kilograms from aviation – this is much, much less than even a short-haul flight which confirms that most did not take a flight.
In fact, we can compare just the aviation emissions for the top countries to the total carbon footprint of citizens elsewhere. The average UAE citizen emits 1950 kilograms of CO 2 from flying. This is the same as the total CO 2 footprint of the average Indian (including everything from electricity to road transport, heating and industry). Or, to take a more extreme example, 200 times the total footprint of the average Nigerien, Ugandan or Ethiopian, which have per capita emissions of around 100 kilograms.
This again emphasises the large difference between the global average and the individual emissions of people who fly. Aviation contributes a few percent of total CO 2 emissions each year – this is not insignificant, but far from being the largest sector to tackle. Yet from the perspective of the individual, flying is often one of the largest chunks of our carbon footprint. The average rich person emits tonnes of CO 2 from flying each year – this is equivalent to the total carbon footprint of tens or hundreds of people in many countries of the world.
Per capita CO₂ emissions from aviation (without tourism adjustment)
Total co₂ emissions from aviation, share of global co₂ emissions from aviation, where in the world do people fly the most, domestic air travel.
This interactive chart shows the average distance travelled per person through domestic air travel each year. This data is for passenger flights only and does not include freight.
Share of global passenger kilometers from domestic air travel
What share of global domestic air travel does each country account for?
Total passenger kilometers from domestic air travel
International air travel.
This interactive chart shows the average distance travelled per person through international air travel each year. This data is for passenger flights only and does not include freight.
Share of global passenger kilometers from international air travel
What share of global international air travel does each country account for?
Total passenger kilometers from international air travel
Total air travel.
This interactive chart shows the average distance travelled per person through domestic and international air travel each year. This data is for passenger flights only and does not include freight.

Share of global passenger kilometers from air travel
What share of global air travel does each country account for?
Total passenger kilometers from air travel
This interactive chart shows the total rail travel in each country, measured in passenger-kilometers per year.
This includes passenger travel only and does not include freight.
Energy intensity of transport
This chart shows the average energy intensity of transport across different modes of travel. It is measured as the average kilowatt-hours required per passenger-kilometer.
This data comes from the United States Department of Transportation's Bureau of Transportation Statistics (BTS). The energy intensity of public transport depends on the assumptions made about the capacity of transport modes i.e. how many passengers travel on a given train or bus journey. This data therefore reflects average capacities in the United States, but will vary from country-to-country.
CO 2 emissions from transport
Per capita transport emissions from transport.
This interactive shows the average per capita emissions of carbon dioxide from transport each year. This includes road, train, bus and domestic air travel but does not include international aviation and shipping.
Total transport emissions
This interactive shows the emissions of carbon dioxide from transport each year. This includes road, train, bus and domestic air travel but does not include international aviation and shipping.
CO 2 emissions by mode of transport
Transport accounts for around one-fifth of global carbon dioxide (CO 2 ) emissions [24% if we only consider CO 2 emissions from energy] . 17
How do these emissions break down? Is it cars, trucks, planes or trains that dominate?
In the chart here we see global transport emissions in 2018. This data is sourced from the International Energy Agency (IEA) .
Road travel accounts for three-quarters of transport emissions. Most of this comes from passenger vehicles – cars and buses – which contribute 45.1%. The other 29.4% comes from trucks carrying freight.
Since the entire transport sector accounts for 21% of total emissions, and road transport accounts for three-quarters of transport emissions, road transport accounts for 15% of total CO 2 emissions.
Aviation – while it often gets the most attention in discussions on action against climate change – accounts for only 11.6% of transport emissions. It emits just under one billion tonnes of CO 2 each year – around 2.5% of total global emissions [we look at the role that air travel plays in climate change in more detail in an upcoming article] . International shipping contributes a similar amount, at 10.6%.
Rail travel and freight emits very little – only 1% of transport emissions. Other transport – which is mainly the movement of materials such as water, oil, and gas via pipelines – is responsible for 2.2%.
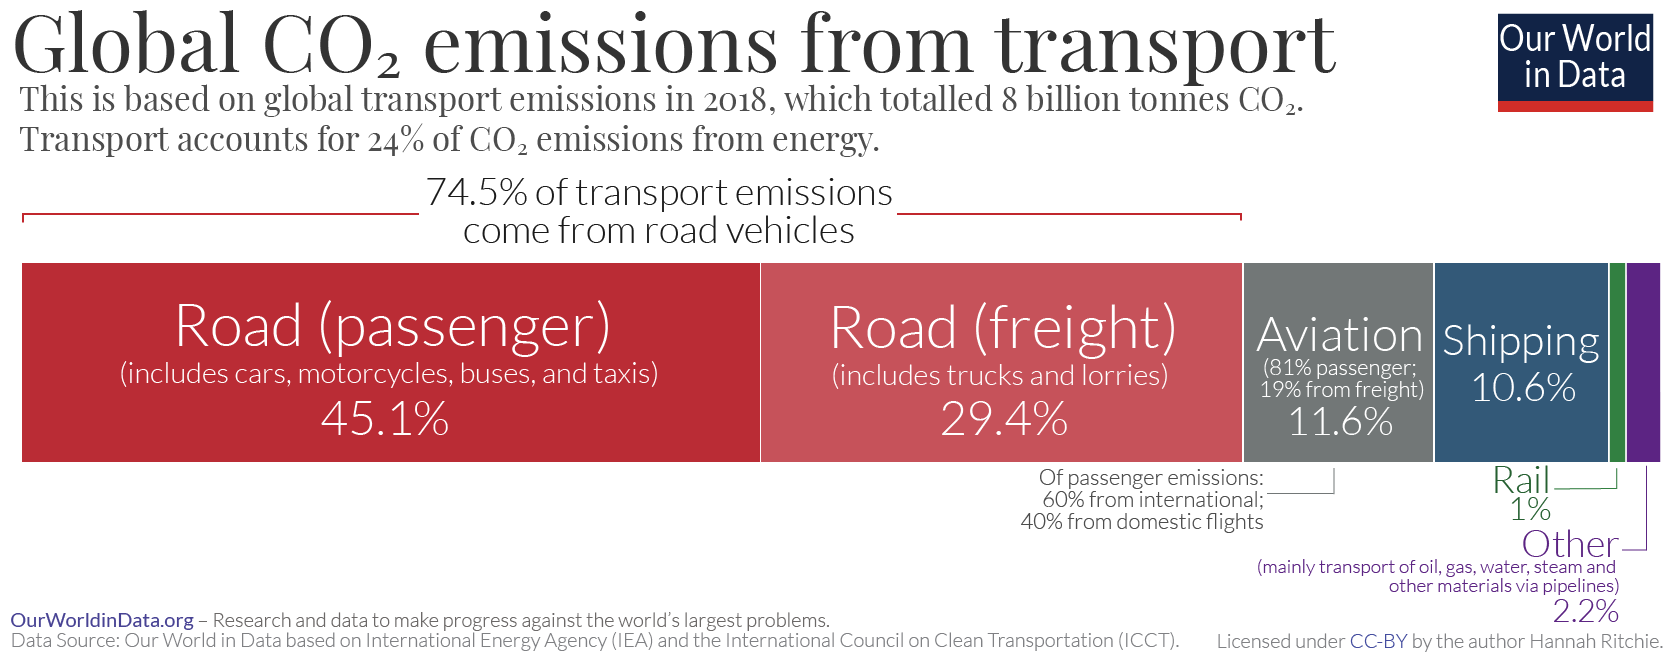
Towards zero-carbon transport: how can we expect the sector’s CO 2 emissions to change in the future?
Transport demand is expected to grow across the world in the coming decades as the global population increases, incomes rise, and more people can afford cars, trains and flights. In its Energy Technology Perspectives report, the International Energy Agency (IEA) expects global transport (measured in passenger-kilometers) to double, car ownership rates to increase by 60%, and demand for passenger and freight aviation to triple by 2070. 18 Combined, these factors would result in a large increase in transport emissions.
But major technological innovations can help offset this rise in demand. As the world shifts towards lower-carbon electricity sources, the rise of electric vehicles offers a viable option to reduce emissions from passenger vehicles.
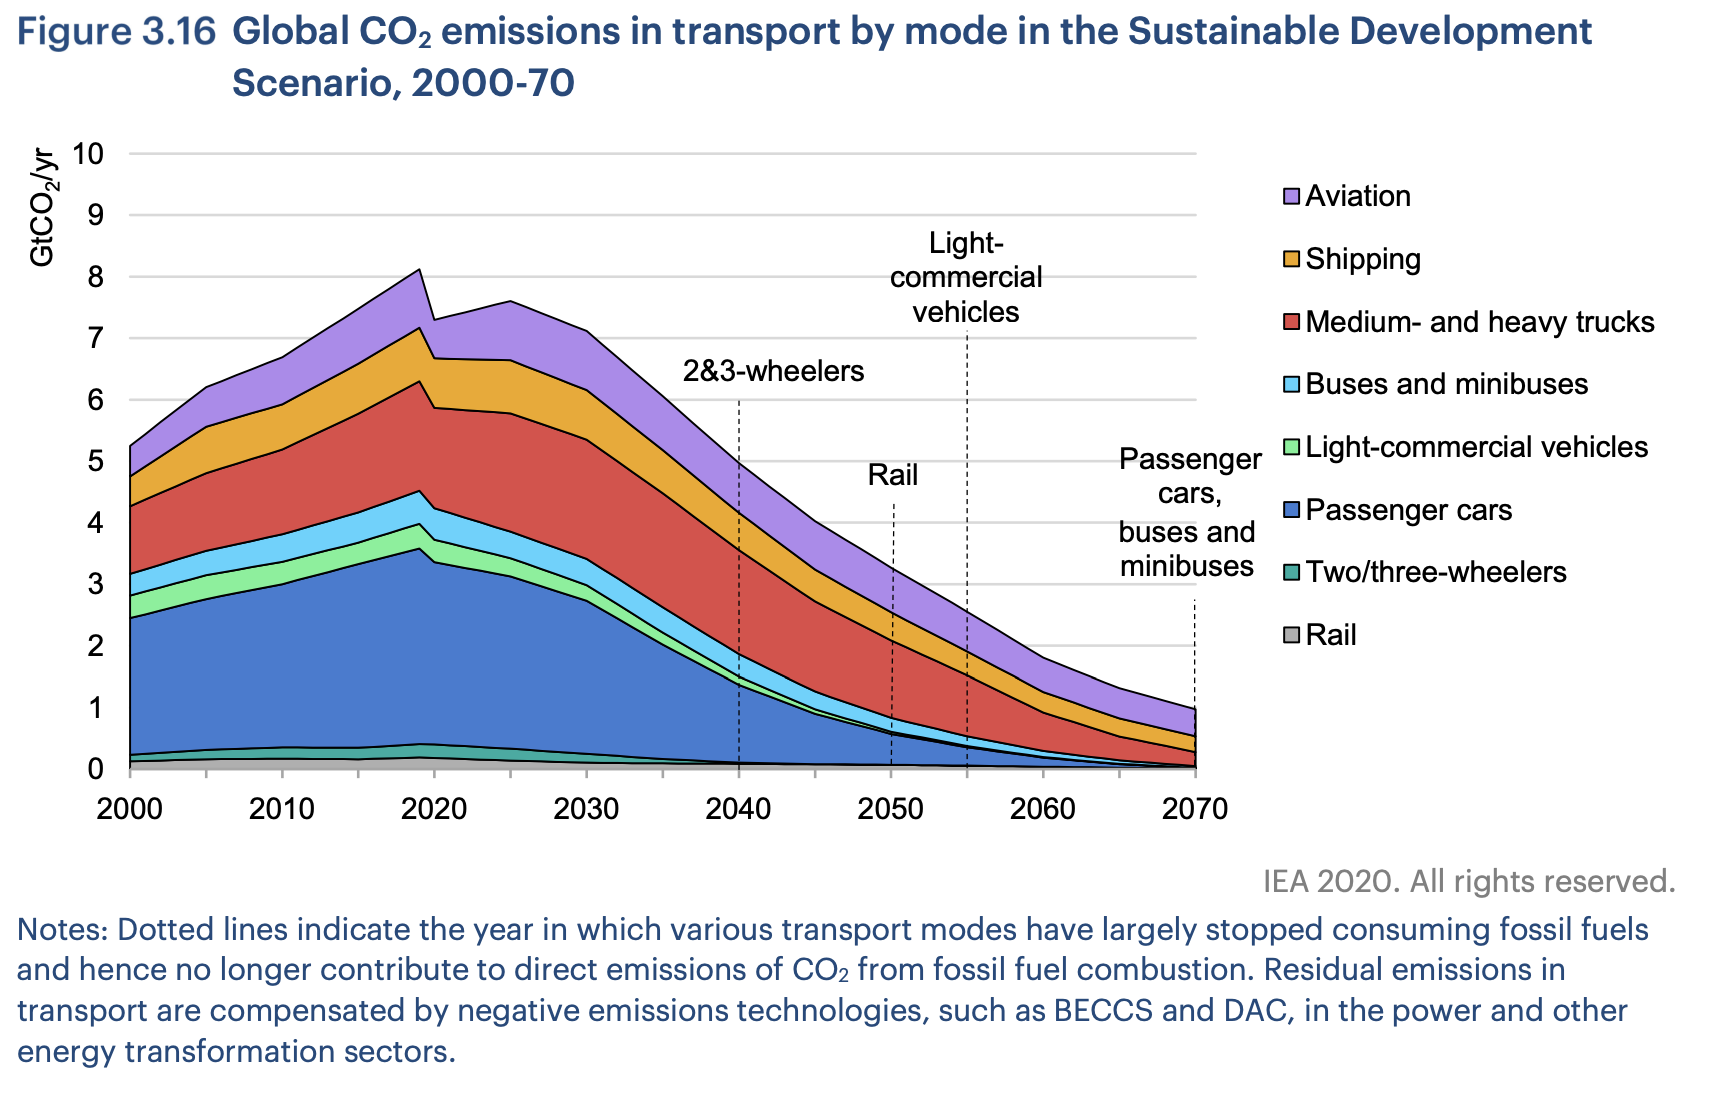
This is reflected in the IEA’s Energy Technology Perspective report. There it outlines its “Sustainable Development Scenario” for reaching net-zero CO2 emissions from global energy by 2070. The pathways for the different elements of the transport sector in this optimistic scenario are shown in the visualization.
We see that with electrification- and hydrogen- technologies some of these sub-sectors could decarbonize within decades. The IEA scenario assumes the phase-out of emissions from motorcycles by 2040; rail by 2050; small trucks by 2060; and although emissions from cars and buses are not completely eliminated until 2070, it expects many regions, including the European Union; United States; China and Japan to have phased-out conventional vehicles as early as 2040.
Other transport sectors will be much more difficult to decarbonize.
In a paper published in Science , Steven Davis and colleagues looked at our options across sectors to reach a net-zero emissions energy system. 19 They highlighted long-distance road freight (large trucks), aviation and shipping as particularly difficult to eliminate. The potential for hydrogen as a fuel, or battery electricity to run planes, ships and large trucks is limited by the range and power required; the size and weight of batteries or hydrogen fuel tanks would be much larger and heavier than current combustion engines. 20 , 21
So, despite falling by three-quarters in the visualized scenario, emissions from these sub-sectors would still make transport the largest contributor to energy-related emissions in 2070. To reach net-zero for the energy sector as a whole, these emissions would have to be offset by ‘negative emissions’ (e.g. the capture and storage of carbon from bioenergy or direct air capture ) from other parts of the energy system.
In the IEA’s net-zero scenario, nearly two-thirds of the emissions reductions come from technologies that are not yet commercially available. As the IEA states, “Reducing CO 2 emissions in the transport sector over the next half-century will be a formidable task.” 18
The best estimates put this figure at around 80% of the world population. We look at this in more detail in our article " Where in the world do people have the highest CO2 emissions from flying? "
Lee, D. S., Fahey, D. W., Skowron, A., Allen, M. R., Burkhardt, U., Chen, Q., ... & Gettelman, A. (2020). The contribution of global aviation to anthropogenic climate forcing for 2000 to 2018 . Atmospheric Environment , 117834.
Sausen, R., & Schumann, U. (2000). Estimates of the climate response to aircraft CO2 and NOx emissions scenarios . Climatic Change , 44 (1-2), 27-58.
The Global Carbon Budget estimated total CO 2 emissions from all fossil fuels, cement production and land-use change to be 42.1 billion tonnes in 2018. This means aviation accounted for [1 / 42.1 * 100] = 2.5% of total emissions.
Global Carbon Project. (2019). Supplemental data of Global Carbon Budget 2019 (Version 1.0) [Data set]. Global Carbon Project. https://doi.org/10.18160/gcp-2019 .
If we were to exclude land use change emissions, aviation accounted for 2.8% of fossil fuel emissions. The Global Carbon Budget estimated total CO 2 emissions from fossil fuels and cement production to be 36.6 billion tonnes in 2018. This means aviation accounted for [1 / 36.6 * 100] = 2.8% of total emissions.
2.3% to 2.8% of emissions if land use is excluded.
Airline traffic data comes from the International Civil Aviation Organization (ICAO) via Airlines for America . Revenue passenger kilometers (RPK) measures the number of paying passengers multiplied by their distance traveled.
Graver, B., Zhang, K., & Rutherford, D. (2019). CO2 emissions from commercial aviation, 2018 . The International Council of Clean Transportation .
Becken, S. and P. Pant (2019). Airline initiatives to reduce climate impact: ways to accelerate action (White paper).
Note that this is based on categorisations from the average income level of countries, and does not take account of variation in income within countries. If we were to look at this distribution based on the income level of individuals rather than countries, the inequality in aviation emissions would be even larger.
There is no global database available on who in the world flies each year. Passenger information is maintained by private airlines. Therefore, deriving estimates of this exact percentage is challenging. The most-cited estimate I’ve seen on this is that around 80% of the world population have never flown. This figure seems to circle back to a quoted estimate from the Boeing CEO.
Even in some of the world’s richest countries, a large share of the population do not fly frequently. Gallup survey data from the United States suggests that in 2015, half of the population did not take a flight. Survey data from the UK provides similar estimates : 46% had not flown in the previous year.
Note that this gives us mean per capita emissions, which does not account for in-country inequalities in the amount of flights people take.
Larsson, J., Kamb, A., Nässén, J., & Åkerman, J. (2018). Measuring greenhouse gas emissions from international air travel of a country’s residents methodological development and application for Sweden . Environmental Impact Assessment Review , 72 , 137-144.
A country with a ratio greater than one will have more incoming travellers than outgoing locals i.e. they are more of a hotspot for tourism.
We can calculate this by taking the standard CO2 conversion factors for travel, used in the UK greenhouse gas accounting framework . For a long-haul flight in economy class, around 0.079 kilograms of CO 2 are emitted per passenger-kilometer. This means that you would travel around 12,600 kilometers to emit one tonne [1,000,000 / 0.079 kg = 12,626 kilometers]. Since we’re taking a return flight, the travel distance would be half of that figure: around 6300 kilometers. The direct distance from London to Dubai is around 5,500 kilometers. Depending on the flight path, it’s likely to be slightly longer than this, and in the range of 5500 to 6500 kilometers.
Note that in this case we’re looking at CO 2 emissions without the extra warming effects of these emissions at high altitudes. This is to allow us to compare with the ICCT figures by country presented in this article. You find additional data on how the footprint of flying is impacted by non-CO 2 warming effects here .
The World Resource Institute ’s Climate Data Explorer provides data from CAIT on the breakdown of emissions by sector. In 2016, global CO 2 emissions (including land use) were 36.7 billion tonnes CO 2 ; emissions from transport were 7.9 billion tonnes CO 2 . Transport therefore accounted for 7.9 / 36.7 = 21% of global emissions.
The IEA looks at CO 2 emissions from energy production alone – in 2018 it reported 33.5 billion tonnes of energy-related CO 2 [hence, transport accounted for 8 billion / 33.5 billion = 24% of energy-related emissions.
IEA (2020), Energy Technology Perspectives 2020 , IEA, Paris.
Davis, S. J., Lewis, N. S., Shaner, M., Aggarwal, S., Arent, D., Azevedo, I. L., ... & Clack, C. T. (2018). Net-zero emissions energy systems . Science , 360(6396).
Cecere, D., Giacomazzi, E., & Ingenito, A. (2014). A review on hydrogen industrial aerospace applications . International Journal of Hydrogen Energy , 39 (20), 10731-10747.
Fulton, L. M., Lynd, L. R., Körner, A., Greene, N., & Tonachel, L. R. (2015). The need for biofuels as part of a low carbon energy future . Biofuels, Bioproducts and Biorefining , 9(5), 476-483.
Cite this work
Our articles and data visualizations rely on work from many different people and organizations. When citing this topic page, please also cite the underlying data sources. This topic page can be cited as:
BibTeX citation
Reuse this work freely
All visualizations, data, and code produced by Our World in Data are completely open access under the Creative Commons BY license . You have the permission to use, distribute, and reproduce these in any medium, provided the source and authors are credited.
The data produced by third parties and made available by Our World in Data is subject to the license terms from the original third-party authors. We will always indicate the original source of the data in our documentation, so you should always check the license of any such third-party data before use and redistribution.
All of our charts can be embedded in any site.
Our World in Data is free and accessible for everyone.
Help us do this work by making a donation.

- Compound Interest
- Compound Interest (Daily)
- Amortization Calculator
- APY Calculator
- Boat Loan Calculator
- CAGR Calculator
- Car Loan Calculator
- Credit Card Repayment
- Currency Converter
- Forex Compounding
- How Long to Save
- How Long Will Money Last
- Interest Rate Calculator
- IRR Calculator
- Loan Calculator
- Loan Payoff Calculator
- Margin Calculator
- Million to Billion Converter
- Money Counter
- Mortgage Calculator
- Mortgage Refinance
- Price Per Square Foot
- Retirement Planning
- Savings Calculators
- Savings Goals
- Simple Interest Calculator
- SIP Calculator
- Hourly to Salary Calc
- Overtime Calculator
- Pay Raise Calculator
- Salary to Hourly Calc
- Time and a Half Calculator
- Centimeters to feet
- Centimeters to inches
- Feet to inches
- Feet to meters
- Inches to centimeters
- Inches to feet
- Meters to feet & inches
- mm to inches
- Grams to pounds
- Kilos to stone & lb
- Kilos to pounds
- Micrograms to mg
- Micrograms to grams
- Milligrams to grams
- Ounces to pounds
- Stone to pounds
- Cubic feet to gallons
- Gallons to ounces
- Liters to gallons
- Liters to ounces
- Cubic yards to tons
- Gallons to pounds
- Liters to tons
- Inch-pounds to ft-lb
- Newton-Meters to ft lb
- Square ft and acres
- Square meters to square ft
- Square feet to cubic feet
- Square feet to cubic yds
- Amps to watts
- Hertz to seconds
- Lumens to Watts
- Watts to amps
- Acceleration
- Data Storage
- Data Transfer Rate
- Fuel Consumption
- Gold Weight
- Length and Distance
- Liquid Volume
- Mass and Weight
- Temperature
- Water Weight
- Weight to Volume
- Cubic Feet Calculator
- Cubic Meters Calculator
- Cubic Yards Calculator
- Electricity Cost Calculator
- Gravel Calculator
- How Much Flooring
- LED Savings Calculator
- MPGe Calculator
- Mulch Calculator
- Square Footage
- Birthday Calculator
- Roman Numerals
- Scientific Calculator
- Final Grade Calculator
- Uni Grade Calculator
- Age Calculator
- Age Difference Calculator
- Chronological Age
- Date Calculator
- Days Between Dates
- Days From Today
- Days Until...
- Generation Calculator
- Decimal to Fraction
- Density Calculator
- Fractions Calculators
- Hex to Decimal
- Percentage Calculator
- Percentage Change
- Baking Conversions
- Butter Converter
- Cooking Converter
- Cups to Grams
- Cups to Ounces
- Cups to Tablespoons
- Grams to Cups
- Grams to Ounces
- Grams to Tablespoons
- Grams to Teaspoons
- mL to Grams
- Ounces to mL
- Ounces to Grams
- Oven Temperatures
- Pints to Cups
- Pounds and Cups
- Quarts to Cups
- Tablespoons to Teaspoons
- Teaspoons to Grams
- Teaspoons to mL
- BMI Calculator
- BMR Calculator
- How Long to Walk a Mile
- How Many Steps in a Mile
- Kilojoules to Calories
- Miles to Steps
- Pregnancy Calculator
- Sobriety Calculator
- Steps to Km
- Steps to Miles
- WHR Calculator
Fuel Consumption Converter
Disclaimer: Whilst every effort has been made in building our calculator tools, we are not to be held liable for any damages or monetary losses arising out of or in connection with their use. Full disclaimer .
Fuel economy conversions
The charts below show conversions for the most common units related to fuel economy . Whilst the majority of the world measures fuel economy in Liters Per 100km, the UK still uses the imperial Miles Per Gallon (MPG). MPG is also sometimes referenced in the United States. However, it's worth remembering that the US gallon is smaller than the UK gallon , meaning MPG measurements for the US unit and the imperial unit are different.
- L/100km to MPG
- MPG to L/100km
Tips for improving fuel economy
With the price of gasoline getting higher and higher, here are some tips for how you can help your own pocket, and the environment, by consuming less fuel when you drive.
- Steer clear of short trips when possible : cold engines can use 60% more gasoline than a warm engine (Energy Saving Trust).
- Check what you're carrying on your journey . Remove anything you don't need to take with you, such as roof racks, bicycle racks and items in your trunk. By saving on weight, you will save on gas consumption.
- Where possible, drive in the highest gear that you can without letting the engine labor . Driving a motor vehicle at 60 kilometers per hour in third gear can use 25 per cent more fuel than driving at the same speed in fifth gear (RAC, UK).
- Consider your speed . When travelling at 110 km/h you use approximately 30 per cent more gasoline than at 80 km/h, in the same gear. The most economical speed is said to be 65-80 km/h.
- Avoid heavy braking and apply the throttle pedal lightly . By braking heavily and accelerating quickly you waste fuel. Improving your driving in this area can save you up to 30% on fuel costs (RAC, UK).
- If you are stuck in a traffic jam for more than a few minutes, and it is safe to do so, switch off your engine . Modern cars now have a cut-off and restart mechanism for energy saving in these circumstances.
- If you don't really need to use your air conditioning, switch it off and open your air vents or windows. Switching off air conditioning can help decrease your gas consumption considerably.
- Get your motor car serviced regularly and ensure that you check tyre pressures at regular intervals and before long journeys. Incorrect tyre pressures can have an impact on fuel consumption, adding up to 2% to your fuel bill.
- Ask your garage to check your vehicle emissions and catalytic converter . According to the RAC (UK), 90% of badly polluting vehicles can be retuned by a garage within 15 minutes.
These fuel economy tips are here only a guide and you should consider your own circumstances before trying these ideas.
Conversion units for the Fuel Consumption Converter
Kilometers / Liter (km/L), Liters / 100 km (L/100 km), Miles / Gallon (UK) (mpg), Miles / Gallon (US) (mpg), Miles / Liter (mi/L),
To help with productivity, we now set a cookie to store the last units you have converted from and to. This means that when you re-visit this fuel consumption converter, the units will automatically be selected for you.
Unit features
- Cm and Feet Conversion
- Kilograms and Pounds Conversion
- Watts to Amps Calculator
- How Big is an Acre?
- How Much Does a Gallon of Water Weigh?
The History of the Calculator
From abacus to iPhones, learn how calculators developed over time.
Home & Garden
- What's My Car Worth?
- Buyer's Guide
The Longest-Range Hybrid Cars, Minivans, and SUVs We've Tested
All of these hybrid models can travel more than 500 miles on a full tank based on the results of our 75-mph highway fuel-economy test.
After ranking the list of longest-range plug-in hybrids , here we're tallying up the longest-range vehicles we've tested among hybrid models that can't be plugged in. These results are based on our real-world 75-mph highway fuel-economy test and use that efficiency figure to determine a range estimate by multiplying it by the vehicle's fuel-tank capacity.
Toyota Camry Hybrid: 520 Miles
Highway Fuel Economy: 40 mpg
The Camry Hybrid outperforms its closest rival, the Honda Accord Hybrid, in our fuel-economy testing, meaning it appears on this list and the Honda does not. That result is for the outgoing generation, but there's a new hybrid-only 2025 Camry on the way that could provide even better efficiency. The new Camry Hybrid also offers an all-wheel-drive option, a first for the gas-electric model; the outgoing model offered AWD only with its base nonhybrid 2.5-liter four-cylinder engine.
Hyundai Elantra Hybrid: 520 Miles
Highway Fuel Economy: 48 mpg
Hyundai's smallest hybrid is the Elantra sedan. While it couldn't quite match its EPA ratings in our real-world testing, its highway result of 48 mpg is still impressive and helps it achieve respectable range despite a relatively small gas tank. The Elantra received a freshening for 2024 that includes more aggressive looks and a few new features, but the hybrid powertrain hasn't changed and still consists of a 1.6-liter gas engine.
More on the Elantra
Kia Sorento Hybrid: 540 Miles
Highway Fuel Economy: 31 mpg
The Kia Sorento is one of only a handful of three-row SUVs that offer a hybrid option, and it's impressively efficient. That combined with its relatively large fuel tank means it can travel a long way between fill-ups. The Sorento Hybrid also receives tweaks inside and out for the 2025 model year , but its powertrain doesn't change.
It's worth noting that the closely related Hyundai Santa Fe Hybrid achieved an identical result in our testing, but we haven't yet tested the redesigned 2024 model, so we left it off this list for now.
More on the Sorento
Toyota Sienna: 550 Miles
Highway Fuel Ec onomy: 31 mpg
As the most spacious vehicle on this list, the Sienna proves that minivans are unbeatable when it comes to family-friendliness and space efficiency. The Sienna's standard hybrid powertrain makes it very fuel efficient too. It got 31 mpg on the highway during our test of an all-wheel-drive model. It's only natural that a great road-trip vehicle like this can go 550 miles between fuel stops, although you might have to stop in between for bathroom breaks.
More on the Sienna
Toyota Prius: 550 Miles
Highway Fuel Economy: 49 mpg
The name Prius is practically synonymous with hybrid at this point, so it's no surprise that it's an efficiency warrior. The newest Prius got 49 mpg in our highway fuel-economy test, which is particularly impressive when you consider it's considerably more powerful than before. The new hybrid setup makes between 194 and 196 horsepower, depending on whether you opt for front- or all-wheel drive, and the new model is several seconds quicker to 60 mph than before. That's a win-win.
More on the Prius
Lexus ES300h: 590 Miles
Highway Fuel Economy: 45 mpg
The Lexus ES has always been a relaxed, cushy cruiser of a luxury sedan, and that makes the hybrid version perhaps the clearest expression of that mission. The ES300h, which shares its powertrain with the Camry Hybrid that's also on this list, was impressively efficient in our testing. That gives it a highway range of nearly 590 miles, and you won't get easily fatigued on a long trip thanks to its quiet cabin and comfortable seats.
More on the ES
Toyota Crown: 600 Miles
Highway Fuel Economy: 42 mpg
The Crown, a strange mashup of crossover and sedan, is quickest if you opt for the more powerful Hybrid Max powertrain in the highest Platinum trim. But it's the standard 236-hp hybrid setup in the lesser XLE and Limited models that offers far better fuel economy. It got 42 mpg on the highway in our real-world test, an impressively high number for a vehicle with this much interior space. This plus a relatively large fuel tank makes the all-wheel-drive Crown a cushy highway cruiser with lots of range.
More on the Crown
Lexus LC500h: 660 Miles
Highway Fuel Economy: 30 mpg
What's a slinky-looking coupe like the Lexus LC doing on a list like this? This grand tourer has a few different tricks up its sleeve. The first is the hybrid powertrain in the LC500h (the other powertrain is a rip-roaring V-8 in the LC500), and the second is a staggeringly large fuel tank that holds just over 22 gallons of premium. So, even though the LC's highway fuel economy of 30 mpg isn't exactly spectacular, it still provides a whopping 660 miles of range. Grand Touring, indeed.
More on the LC
Lexus LS500h: 660 Miles
The LS flagship luxury sedan shares its available hybrid setup with the LC500h coupe, and its fuel tank is similarly large. The LS500h could be considered an even cushier road-trip companion than its two-door stablemate too, owing to its long wheelbase, hedonistic rear seat, and plush ride. The hybrid model also comes with a " Lexus Teammate " driver-assistance system that allows you to take your hands off the wheel under certain circumstances, which you can spot on the car pictured here due to its extra sensors and cameras in the grille and on the front fenders. The LS is not quite as stylish as the LC, though, but few cars are.
More on the LS
Hyundai Sonata Hybrid: 670 Miles
Highway Fuel Economy: 51 mpg
While many of the cars on this list owe their high range numbers to either parsimonious fuel economy or a large fuel tank, the Sonata hybrid tops the list because it has both. With a result of 51 mpg in our real-world test, it's among the most efficient cars we've ever tested.
Our test result is from a 2020 Sonata hybrid, but we think it applies to the updated 2024 model (pictured here) because the car's powertrain and EPA highway fuel-economy ratings have not changed.
More on the Sonata
Despite being raised on a steady diet of base-model Hondas and Toyotas—or perhaps because of it—Joey Capparella nonetheless cultivated an obsession for the automotive industry throughout his childhood in Nashville, Tennessee. He found a way to write about cars for the school newspaper during his college years at Rice University, which eventually led him to move to Ann Arbor, Michigan, for his first professional auto-writing gig at Automobile Magazine . He has been part of the Car and Driver team since 2016 and now lives in New York City.

.css-190qir1:before{background-color:#000000;color:#fff;left:0;width:50%;border:0 solid transparent;bottom:48%;height:0.125rem;content:'';position:absolute;z-index:-10;} Testing Hub .css-188buow:after{background-color:#000000;color:#fff;right:0;width:50%;border:0 solid transparent;bottom:48%;height:0.125rem;content:'';position:absolute;z-index:-10;}

Cybertruck's Closed Tonneau Adds 25 Miles of Range
Quickest EVs Tested: 60 MPH in under 3.5 Seconds

Video: 2024 Tesla Cybertruck Beast Suspension Test

Real-World Range Test: Cybertruck Goes 250 Miles

834-HP Cybertruck Blasts to 60 MPH in 2.6 Seconds
BEVs with the Longest Driving Range

The Longest-Range Plug-In Hybrids We've Tested
1234-HP Lucid Air Is the Quickest EV We've Tested

We Cut 3.1 Seconds off the BRZ’s VIR Lap Time

The Loudest Cars We've Ever Tested
Comparing the Prius and Prius Prime's Test Results

How to Get Better Gas Mileage Pulling a Travel Trailer
How much does pulling a trailer affect gas mileage.
In a truck, that energy is your fuel, so a heavier load will mean you are getting a lower fuel economy. Estimates say that every 100lbs of extra weight in a truck decreases its fuel economy by two percent. So, it’s not hard to imagine that towing a large trailer will create a much larger drop in your fuel economy. [1]
What gas mileage do you get pulling a travel trailer?
Travel Fuel Economy Fuel economy hovers around 10 miles per gallon. Pulling a trailer is considered more economical. It relies on the truck or SUV for its gas mileage, and this means getting an average of 20 miles per gallon. Even if it’s just 15 mpg, that’s a vast improvement at today’s prices. [2]
Do you get better gas mileage with tow haul on or off?
Will Tow/Haul save me gas? Using the tow/haul option increases the RPMs of the engine, so it results in a higher usage of fuel. However, replacing a transmission because you didn’t use it would be much more expensive then the extra gas you may use while in this mode. [3]
Do you use more gas when towing?
In general, expect around a 30-percent drop in average MPG when towing with a gasoline engine, though that may vary significantly depending on terrain, weight and height of load, and the driver. [4]
How can you improve gas mileage?
Clear out the extra clutter. There are some items you should keep in your car, like an emergency kit. Limit idling. Keep your speed steady and within the speed limit. Check your tire pressure. Perform regular maintenance. [5]
Is gas or diesel better for towing?
Torque and Towing – Diesel trucks generate more torque than their gas-powered counterparts, and can often tow heavier loads compared to similarly-sized gas-powered engines. Fuel Economy – Diesel engines are more efficient than gas engines. [6]
What class B gets best gas mileage?
Roadtrek SS Agile (25 mpg). Winnebago Revel (18 mpg). Airstream Interstate 19 (17 mpg). Coachmen Nova (18 mpg). Carado Banff 2018 (15 mpg). Ogavans (18 mpg). Fleetwood Irok (15 mpg). Winnebago Travato (22 mpg). [7]
How does weight affect MPG?
The heavier the vehicle is, the more energy it needs to get moving. Heavier vehicles have greater inertia and greater rolling resistance, which both contribute to increased fuel consumption. [8]
How far can an RV go on a tank of gas?
What is this? Most Class A RVs get around 9 miles per gallon which will take you around 810 miles. The smaller Class B’s have the best mile-per-gallon at 19 miles per gallon which means a full take should take you around 456 miles. [9]
Should you always use tow haul mode?
When driving in hilly areas, towing a trailer, carrying a heavy load, etc., and frequent transmission shifting occurs, push the TOW/HAUL switch to activate TOW/HAUL mode. This will improve performance and reduce the potential for transmission overheating or failure due to excessive shifting. [10]
Can you switch to tow mode while driving?
Yes, you can turn on tow haul while driving; however, it might not be necessary. Anytime you turn on your car’s tow haul feature, it essentially shifts your engine to a lower gear, meaning that it will make it easier for you to stop or brake if needed. [11]
Should you tow mode with empty trailer?
No, even with older trucks tow mode is not needed unless the terrain is up and down or you’re towing up a long grade. If the transmission is frequently shifting up or down or is hunting for a better gear you should engage tow mode. [12]
Related posts:
- How Often Should You Grease Travel Trailer Wheel Bearings
- When is Best Time to Buy Travel Trailer
- Does My Travel Trailer Need Inspection
- How Much Are Grand Design Travel Trailers
Leave a Comment Cancel reply
Save my name, email, and website in this browser for the next time I comment.
Fuel Distance Calculator
How do i calculate the fuel distance, how do i use the fuel distance calculator, how do i calculate cost in the fuel distance calculator, other related calculators.
Using the fuel distance calculator, you would be able to answer questions such as "How far can I go using the fuel I have?", "How much would this trip cost me?", etc. This tool enables you to calculate the cost and the fuel distance, when the quantity and efficiency of the fuel are known.
If you own a Tesla or a hybrid vehicle, we also have Tesla charging cost calculator or plug-in hybrid economy calculator .
To calculate the fuel distance, you need to know the fuel quantity and the efficiency. Once you get the values of these two values, you can calculate the fuel distance using the following formula:
For example, if you have 10 gallons of gas with an efficiency of 25 miles per gallon, then distance = 10 × 25 = 250 miles
So you can travel a distance of 250 miles with this amount of fuel.
To find the distance using the fuel distance calculator, do the following:
- Enter the value of the fuel efficiency .
- Enter the fuel consumption or fuel quantity .
- Tada! The fuel distance calculator will show you the distance you can cover with that fuel!
To calculate the cost using the fuel distance calculator, do the following:
- Key in the fuel efficiency value.
- Also key in the quantity of fuel used.
- The fuel distance calculator will display the total distance covered.
- In the advanced mode , enter the fuel price .
- Voila! You can now see the total cost of the trip!
If you found the fuel distance calculator tool useful, you may also want to check out some additional calculators surrounding the same topic, a few of which are listed below:
- Fuel cost calculator ;
- Fuel consumption calculator ; and
- Fuel mileage calculator .
How do I calculate fuel consumption based on distance?
To calculate fuel consumption based on distance, do the following:
- Note down the efficiency of the fuel.
- Get the total distance traveled.
- Divide the distance by the efficiency, to find the fuel consumption.
For example, if the efficiency is 26 miles per gallon , and the distance is 13 miles , then Fuel consumption = 13/26 = 0.5 gallons .
How many miles do you get out of 1 gallon of gas?
20 to 30 miles . The efficiency of gas ranges between 20 and 30 miles per gallon. Additionally, it is not advisable to drive when the tank is near-empty, so you may want to plan filling adequate fuel to avoid issues.
Decimal time conversion
Nautical mile, significant figures.
- Biology (100)
- Chemistry (100)
- Construction (144)
- Conversion (292)
- Ecology (30)
- Everyday life (261)
- Finance (569)
- Health (440)
- Physics (509)
- Sports (104)
- Statistics (182)
- Other (181)
- Discover Omni (40)
Travel could be a good deal this summer. Here's when plane ticket prices will peak.
Spring is springing and according to Hopper, it’s time to start thinking about your summer vacation plans.
New data from the online booking site shows some favorable trends for travelers in the next few months, including slightly lower airfares compared to 2023, and hotel and car rental prices that are more or less flat year-over-year.
Here’s what you need to know as you prepare to book, whether you’re looking to take a domestic getaway or go on an overseas adventure. It’s also not too late to take advantage of deals on some last-minute trips.
How much are spring and summer plane tickets?
According to Hopper, the best deals right now are on domestic airline tickets. Round-trip flights within the U.S. are averaging $290 in April, but prices are expected to rise in the months ahead.
Hopper’s data shows prices for domestic flights will peak between May and June at $315 on average, and then will gradually fall through the summer, reaching a low of $264 on average in September.
On a call with investors discussing first-quarter earnings Wednesday, Delta Air Lines CEO Ed Bastian said summer travel demand has been pushed forward in recent years due in part to schools, especially in the South, finishing their summer breaks earlier in the year.
Is airport Wi-Fi safe to use? How to keep your information safe while traveling.
Short vs. long cruises: Which one is right for you? Here's how they compare.
This summer will also be a good time to travel internationally, with Hopper data showing fares to most destinations abroad down compared to last year.
“Airfare to international destinations continues to improve following two years of bloated prices due to quickly recovering demand, high fuel prices and supply constraints. Airfare to most major regions of the world has dropped compared to last year with the exception of trips to Canada,” Hayley Berg, Hopper’s chief economist, said in the report. “International fares remain higher than pre-pandemic levels to most regions, as higher fuel prices persist and airlines continue to rebuild capacity to many regions.”
How much will a hotel room for the spring and summer cost?
Hotel prices remain more or less flat compared to the same time last year. Rooms in the U.S. are averaging $206 per night currently, with even better deals available in some trending international destinations like Osaka, Japan and Istanbul, Turkey.
According to Hopper, Las Vegas, New York and Chicago remain popular destinations in the U.S.
Will car rental prices go up this summer?
Car rental prices also haven’t gone up much since last year, averaging $42 per day currently, according to Hopper.
The report shows that most travelers rent a car for about four days and warm weather destinations like Orlando and Los Angeles remain popular pickup points.
Zach Wichter is a travel reporter for USA TODAY based in New York. You can reach him at [email protected].

Fuel Economy Home Page

Find & Compare Cars

- Compare Side-by-Side
- Power Search
- Find-a-Car App

- Calculate or Share Your MPG
- Estimates from Drivers Like You

- Gas Mileage Tips
- Fuel Cost Calculator
- Find the Cheapest Gas
Hybrids & Electrics

- Plug-in Hybrids
- All-Electric Vehicles
Calculators and Other Tools
- Fuel Savings Calculator
- Trip Calculator
- Used Car Label Tool
- Developer Tools
- Find a Car Widget
- GHG Emissions Calculator
- Can a Hybrid Save Me Money?
- My Plug-in Hybrid Calculator
New on fueleconomy.gov…
- 2024 Fuel Economy Guide
- 2024 Best and Worst Fuel Economy
- 2024 Top Ten Vehicle Lists
- 2024–25 Fuel Economy Data
- New federal tax credits for clean vehicles
Quick Picks
- Top 10 - Most Efficient Vehicles
- Compare Old vs. New EPA MPG
- Find a SmartWay Vehicle
- Extreme MPG
- Find a Car App
Related Links
- VW, Bentley, Audi and Porsche MPG Estimates Revised
- Clean Cities and Communities
- Vehicle Cost Calculator
- Station Locator
- EV Explorer
This website is administered by Oak Ridge National Laboratory for the U.S. Department of Energy and the U.S. Environmental Protection Agency.
This website is administered by Oak Ridge National Laboratory for the U.S. DOE and the U.S. EPA.
Site modified: Tuesday March 19 2024
Data-driven rolling eco-speed optimization for autonomous vehicles
- Research Article
- Open access
- Published: 12 April 2024
Cite this article
You have full access to this open access article
- Ying Yang 1 ,
- Kun Gao 2 ,
- Shaohua Cui 2 ,
- Yongjie Xue 3 ,
- Arsalan Najafi 2 &
- Jelena Andric 2 , 4
In urban settings, fluctuating traffic conditions and closely spaced signalized intersections lead to frequent emergency acceleration, deceleration, and idling in vehicles. These maneuvers contribute to elevated energy use and emissions. Advances in vehicle-to-vehicle and vehicle-to-infrastructure communication technologies allow autonomous vehicles (AVs) to perceive signals over long distances and coordinate with other vehicles, thereby mitigating environmentally harmful maneuvers. This paper introduces a data-driven algorithm for rolling eco-speed optimization in AVs aimed at enhancing vehicle operation. The algorithm integrates a deep belief network with a back propagation neural network to formulate a traffic state perception mechanism for predicting feasible speed ranges. Fuel consumption data from the Argonne National Laboratory in the United States serves as the basis for establishing the quantitative correlation between the fuel consumption rate and speed. A spatiotemporal network is subsequently developed to achieve eco-speed optimization for AVs within the projected speed limits. The proposed algorithm results in a 12.2% reduction in energy consumption relative to standard driving practices, without a significant extension in travel time.
Article PDF
Download to read the full article text
Avoid common mistakes on your manuscript.
Ali Y, Zheng Z, Haque M M (2021). Modelling lane-changing execution behaviour in a connected environment: A grouped random parameters with heterogeneity-in-means approach. Communications in Transportation Research, 1: 100009
Article Google Scholar
Almannaa M H, Chen H, Rakha H A, Loulizi A, El-Shawarby I (2019). Field implementation and testing of an automated eco-cooperative adaptive cruise control system in the vicinity of signalized intersections. Transportation Research Part D: Transport and Environment, 67: 244–262
Argonne National Laboratory (2023). Publicly available testing data for advanced technology vehicles
Asadi B, Vahidi A (2011). Predictive cruise control: Utilizing upcoming traffic signal information for improving fuel economy and reducing trip time. IEEE Transactions on Control Systems Technology, 19(3): 707–714
Barth M, Boriboonsomsin K (2009). Energy and emissions impacts of a freeway-based dynamic eco-driving system. Transportation Research Part D: Transport and Environment, 14(6): 400–410
Chen X, Qian L, Wang Q (2022). Eco-driving at signalized intersections under uncertain traffic conditions. Proceedings of the Institution of Mechanical Engineers, Part D: Journal of Automobile Engineering, in press, doi: https://doi.org/10.1177/09544070221128181
Cui S H, Cao F, Yu B, Yao B Z (2022a). Modeling heterogeneous traffic mixing regular, connected and connected-autonomous vehicles under connected environment. IEEE Transactions on Intelligent Transportation Systems, 23(7): 8579–8594
Cui S H, Xue Y J, Gao K, Lv M L, Yu B (2023). Adaptive collision-free trajectory tracking control for string stable bidirectional platoons. IEEE Transactions on Intelligent Transportation Systems, 24(11): 12141–12153
Cui S H, Xue Y J, Lv M L, Yao B Z, Yu B (2022b). Cooperative constrained control of autonomous vehicles with nonuniform input quantization. IEEE Transactions on Vehicular Technology, 71(11): 11431–11442
de Nunzio G, de Wit C C, Moulin P, Di Domenico D (2016). Eco-driving in urban traffic networks using traffic signals information. International Journal of Robust and Nonlinear Control, 26(6): 1307–1324
Article MathSciNet Google Scholar
Dong S, Chen H, Gao B, Guo L, Liu Q (2022). Hierarchical energy-efficient control for CAVs at multiple signalized intersections considering queue effects. IEEE Transactions on Intelligent Transportation Systems, 23(8): 11643–11653
Goldmann K, Sieg G (2020). Economic implications of phantom traffic jams: Evidence from traffic experiments. Transportation Letters, 12(6): 386–390
Guo G, Wang Q (2019). Fuel-efficient en route speed planning and tracking control of truck platoons. IEEE Transactions on Intelligent Transportation Systems, 20(8): 3091–3103
Guo X Y, Zhang G, Jia A F (2023). Study on mixed traffic of autonomous vehicles and human-driven vehicles with different cyber interaction approaches. Vehicular Communications, 39: 100550
Hu L, Zhong Y X, Hao W, Moghimi B, Huang J, Zhang X, Du R H (2018). Optimal route algorithm considering traffic light and energy consumption. IEEE Access, 6: 59695–59704
Jafaripournimchahi A, Cai Y F, Wang H, Sun L, Tang Y L, Babadi A A (2023). A viscous continuum traffic flow model based on the cooperative car-following behaviour of connected and autonomous vehicles. IET Intelligent Transport Systems, 17(5): 973–991
Jia L M, Shi R F, Ji L, Wu P (2022). Road transportation and energy integration strategy in China. Strategic Study of CAE, 24(3): 163–172 (in Chinese)
Jiang N, Yu B, Cao F, Dang P F, Cui S H (2021). An extended visual angle car-following model considering the vehicle types in the adjacent lane. Physica A, 566: 125665
Kabir R, Remias S M, Waddell J, Zhu D X (2023). Time-Series fuel consumption prediction assessing delay impacts on energy using vehicular trajectory. Transportation Research Part D: Transport and Environment, 117: 103678
Kamal M A S, Mukai M, Murata J, Kawabe T (2010). Ecological driver assistance system using model-based anticipation of vehicle-road-traffic information. IET Intelligent Transport Systems, 4(4): 244–251
Larsson J, Keskin M F, Peng B, Kulcsár B, Wymeersch H (2021). Prosocial control of connected automated vehicles in mixed-autonomy multi-lane highway traffic. Communications in Transportation Research, 1: 100019
Li M, Wu X K, He X Z, Yu G Z, Wang Y P (2018). An eco-driving system for electric vehicles with signal control under V2X environment. Transportation Research Part C: Emerging Technologies, 93: 335–350
Li T, Gopalswamy S (2021). A spatial searching method for planning under time-dependent constraints for eco-driving in signalized traffic intersection. IEEE Robotics and Automation Letters, 6(2): 2525–2532
Liu B, Sun C, Wang B, Sun F (2022). Adaptive speed planning of connected and automated vehicles using multi-light trained deep reinforcement learning. IEEE Transactions on Vehicular Technology, 71(4): 3533–3546
Liu J, Wang Z, Hou Y, Qu C, Hong J, Lin N (2021). Data-driven energy management and velocity prediction for four-wheel-independent driving electric vehicles. eTransportation, 9: 100119
Liu J Z, Wang Z P, Zhang L (2023). Efficient eco-driving control for EV platoons in mixed urban traffic scenarios considering regenerative braking. IEEE Transactions on Transportation Electrification, in press, doi: https://doi.org/10.1109/TTE.2023.3305773
Luo Y, Li S, Zhang S, Qin Z, Li K (2017). Green light optimal speed advisory for hybrid electric vehicles. Mechanical Systems and Signal Processing, 87: 30–44
Ma F W, Yang Y, Wang J W, Li X C, Wu G P, Zhao Y, Wu L, Aksun-Guvenc B, Guvenc L (2021). Eco-driving-based cooperative adaptive cruise control of connected vehicles platoon at signalized intersections. Transportation Research Part D: Transport and Environment, 92: 102746
Munoz-Organero M, Magana V C (2013). Validating the impact on reducing fuel consumption by using an eco-driving assistant based on traffic sign detection and optimal deceleration patterns. IEEE Transactions on Intelligent Transportation Systems, 14(2): 1023–1028
Pi D, Xue P, Xie B, Wang H, Tang X, Hu X (2022). A platoon control method based on DMPC for connected energy-saving electric vehicles. IEEE Transactions on Transportation Electrification, 8(3): 3219–3235
Reza Amini M, Feng Y H, Yang Z, Kolmanovsky I, Sun J (2020). Long-term vehicle speed prediction via historical traffic data analysis for improved energy efficiency of connected electric vehicles. Transportation Research Record: Journal of the Transportation Research Board, 2674(11): 17–29
Shi J, Qiao F, Li Q, Yu L, Hu Y (2018). Application and evaluation of the reinforcement learning approach to eco-driving at intersections under Infrastructure-to-Vehicle communications. Transportation Research Record: Journal of the Transportation Research Board, 2672(25): 89–98
Wang Z, Wu G, Hao P, Boriboonsomsin K, Barth M (2017). Developing a platoon-wide eco-cooperative adaptive cruise control (CACC) system. In: IEEE Intelligent Vehicles Symposium (IV). Los Angeles, CA: IEEE, 1256–1261
Google Scholar
Wu C, Zhao G, Ou B (2011). A fuel economy optimization system with applications in vehicles with human drivers and autonomous vehicles. Transportation Research Part D: Transport and Environment, 16(7): 515–524
Wu G, Hao P, Wang Z, Jiang Y, Boriboonsomsin K, Barth M, McConnel M, Qiang S W, Stark J (2021). Eco-approach and departure along signalized corridors considering powertrain characteristics. SAE International Journal of Sustainable Transportation, Energy, Environment, & Policy, 2(1): 25–40
Wu S M, Chen Z, Shen S Q, Shen J W, Guo F X, Liu Y G, Zhang Y J (2023). Hierarchical cooperative eco-driving control for connected autonomous vehicle platoon at signalized intersections. IET Intelligent Transport Systems, 17(8): 1560–1574
Xia H, Boriboonsomsin K, Barth M (2013). Dynamic eco-driving for signalized arterial corridors and its indirect network-wide energy/emissions benefits. Journal of Intelligent Transport Systems, 17(1): 31–41
Yang H, Rakha H, Ala M V (2016). Eco-cooperative adaptive cruise control at signalized intersections considering queue effects. IEEE Transactions on Intelligent Transportation Systems, 18(6): 1575–1585
Yang Z, Feng Y H, Liu H X (2021). A cooperative driving framework for urban arterials in mixed traffic conditions. Transportation Research Part C: Emerging Technologies, 124: 102918
Yu B, Zhou H X, Wang L, Wang Z R, Cui S H (2021). An extended two-lane car-following model considering the influence of heterogeneous speed information on drivers with different characteristics under honk environment. Physica A, 578: 126022
Zhang X, Zhang T, Zou Y, Du G, Guo N (2020). Predictive eco-driving application considering real-world traffic flow. IEEE Access, 8: 82187–82200
Zhang X Z, Fang S C, Shen Y P, Yuan X F, Lu Z Y (2023). Hierarchical velocity optimization for connected automated vehicles with cellular vehicle-to-everything communication at continuous signalized intersections. IEEE Transactions on Intelligent Transportation Systems, in press, doi: https://doi.org/10.1109/TITS.2023.3274580
Zhu J, Easa S, Gao K (2022). Merging control strategies of connected and autonomous vehicles at freeway on-ramps: A comprehensive review. Journal of Intelligent and Connected Vehicles, 5(2): 99–111
Download references
Author information
Authors and affiliations.
School of Management, Shanghai University, Shanghai, 200444, China
Department of Architecture and Civil Engineering, Chalmers University of Technology, Gothenburg, 41296, Sweden
Kun Gao, Shaohua Cui, Arsalan Najafi & Jelena Andric
School of Transportation Science and Engineering, Beihang University, Beijing, 100191, China
Yongjie Xue
Volvo Group Trucks Technology, Gothenburg, 40508, Sweden
Jelena Andric
You can also search for this author in PubMed Google Scholar
Corresponding author
Correspondence to Shaohua Cui .
Ethics declarations
Competing Interests The authors declare that they have no competing interests.
Additional information
This research was supported by VINNOVA (ICV-safe, 2019-03418), Energimyndigheten and JPI Urban Europe through e-MATS project (P2023-00029), and AI Center (CHAIR) at Chalmers University of Technology (CHAIR-CO-EAIVMS-2021-009).
Open access funding provided by Chalmers University of Technology.
Rights and permissions
Open Access This article is licensed under a Creative Commons Attribution 4.0 International License, which permits use, sharing, adaptation, distribution and reproduction in any medium or format, as long as you give appropriate credit to the original author(s) and the source, provide a link to the Creative Commons licence, and indicate if changes were made.
The images or other third party material in this article are included in the article’s Creative Commons licence, unless indicated otherwise in a credit line to the material. If material is not included in the article’s Creative Commons licence and your intended use is not permitted by statutory regulation or exceeds the permitted use, you will need to obtain permission directly from the copyright holder. To view a copy of this licence, visit http://creativecommons.org/licenses/by/4.0/ .
Reprints and permissions
About this article
Yang, Y., Gao, K., Cui, S. et al. Data-driven rolling eco-speed optimization for autonomous vehicles. Front. Eng. Manag. (2024). https://doi.org/10.1007/s42524-023-0284-y
Download citation
Received : 15 September 2023
Revised : 19 October 2023
Accepted : 22 October 2023
Published : 12 April 2024
DOI : https://doi.org/10.1007/s42524-023-0284-y
Share this article
Anyone you share the following link with will be able to read this content:
Sorry, a shareable link is not currently available for this article.
Provided by the Springer Nature SharedIt content-sharing initiative
- data-driven learning
- speed optimization
- autonomous vehicles
- energy saving
- Find a journal
- Publish with us
- Track your research

IMAGES
COMMENTS
In Step 2, you will enter the trip details including starting point, intermediate stops, and destination. Enter the Trip. You will be able to modify the route by dragging the route line on the map. The Trip Vehicles section above will be updated with the cost of fuel for the trip.
MPG = D / F. where ' D ' or distance is in miles and ' F ' or fuel is in gallons. To calculate KMPL, the following equation is used: KMPL = D / F. where ' D ' or distance is in kilometers and ' F ' or fuel is in liters. If you want to convert MPG as measured in US gallons into KMPL, the following equations are used: MPG = 2.352145836 × KMPL.
When we travel by land using a fuel-powered vehicle, we either spend too much on fuel or don't really care about it (talk about life goals). However, for most of us who want to budget our travels, knowing our vehicle's fuel or gas consumption from a recent long trip can help us plan our future rides better.. Fuel consumption is a measure of how efficiently a vehicle uses up fuel, comparable to ...
Find out what's your fuel economy. Let's use 8 l/100 km. To work out how much fuel you will use in total, divide your distance by 100 (because we are looking at the fuel use every 100 km), so: 295 / 100 = 2.95 and then multiply it by your combustion, so by 8: 2.95 × 8 = 23.6. Now you know that you will use 23.6 liters of fuel.
If you are using mpg (miles per gallon), then the formula for calculating the total amount of gas needed is: Fuel = Distance / Consumptionmpg. For example, if the distance is 500 miles and consumption is 20 miles per gallon, then the fuel you will need for the entire distance is 500 / 20 = 25 gallons. If you are using gallons per 100 mi to ...
The formula for calculating fuel consumption used in this online fuel consumption calculator is: Fuel consumption = Fuel used / Distance travelled. The result depends on the metrics used as input: miles per gallon if the input was in miles and gallons, and km per liter if the input was in kilometers and liters.
The fuel efficiency calculator estimates gas mileage based on the number of kilometers covered and the average fuel consumption of your car. All you need to do is input: Distance - how far you plan to travel. Fuel economy - the average fuel use of your car. In the Fuel price and trip cost section of the calculator, you can also enter: Price ...
Fuel consumption calculation. We calculate the total fuel required to cover the distance with your vehicles fuel economy number and then multiply that with the gas price to find the total fuel cost for the trip. Select the fuel economy unit used in your country from the options provided viz., miles per gallon (mpg), kilometers per liter (kmpl ...
This free fuel consumption calculator estimates the fuel cost of your trip based on average fuel consumption, trip distance, and fuel price! ... Carpooling, also known as car-sharing, is where two or more people share a vehicle and travel to the same destination. Even though a heavier car uses slightly more fuel, it's usually more efficient ...
The term fuel economy is used when speaking about miles per gallon or kilometers per liter (mpg, km/l). The term fuel efficiency is used when speaking about gallons per mile or gallons per 1,000 miles, and liters per kilometer or liters per 100 km. The first is mostly used in the U.S., U.K., India, Japan, South Korea, Latin America, Denmark ...
This free fuel cost calculator estimates the fuel cost of a trip based on fuel efficiency, distance, and gas price using various units of measurement. ... carpooling is the arrangement between two or more people to travel to a shared destination in a single vehicle. ... Properly inflated tires can reduce fuel consumption by up to 3 percent ...
Calculator Use. Calculate fuel economy in automobiles in US or Metric units. Calculate vehicle fuel economy in mpg US (miles per US gallon), mpg Imp (miles per Imperial gallon), km/l (kilometers per liter) or fuel consumption in l/100km (liters per 100 kilometers). Equivalent fuel economy/efficiency ratings are converted and shown for all units, mpg US, mpg Imp, km/l and l/100km.
1. The formula for fuel consumption is Distance Driven ÷ Fuel Used. A car's fuel consumption is a measure of the miles or kilometers driven per gallon or liter of fuel. If you know the distance you drove and how much fuel fits in your tank, simply divide the distance you drove by the amount of fuel you used to get your miles per gallon, or ...
There is also a fuel calculator, that enables drivers to work out their fuel usage in terms of consumption, fuel cost in terms of pence per litre or gallon, and mileage rate. ... If you're thinking of travelling in Europe, find out more about our European breakdown cover, travel insurance and car hire excess insurance.
Average jet fuel consumption in the United States so far in 2022 has been consistently below 2019, ... As travel restrictions and other responses to the COVID-19 pandemic eased in the latter part of 2020 and especially into 2021, consumption of jet fuel gradually increased. In the second half of 2021, U.S. consumption grew to 1.5 million b/d ...
Fuel economy of new passenger vehicles. ... [we look at the role that air travel plays in climate change in more detail in an upcoming article]. International shipping contributes a similar amount, at 10.6%. Rail travel and freight emits very little - only 1% of transport emissions. Other transport - which is mainly the movement of ...
You can travel a distance of around 8 miles (12.875 km) with a liter of fuel if your car runs at least 30 miles per US gallon (12.75 kilometers per liter). If you have a more efficient vehicle, say with a fuel mileage of 35 miles per US gallon, you can reach up to 9.25 miles (14.8 kilometers) with it.
You can gain access to insider knowledge to save money by using the GasBuddy gas calculator. Find the cheapest gas stations on your route with this easy-to-use gas estimator for your trip. Discover how this simple tool can estimate your total trip cost, gas mileage, gallons used, and the savings you'll experience today. All you have to do is ...
SUVs. Pickups. Hybrid. Plug-in Hybrid. All-Electric. Diesel. Flex-Fuel. Fuel Cell. Find and compare the fuel economy, fuel costs, and safety ratings of new and used cars and trucks.
Driving a motor vehicle at 60 kilometers per hour in third gear can use 25 per cent more fuel than driving at the same speed in fifth gear (RAC, UK). Consider your speed. When travelling at 110 km/h you use approximately 30 per cent more gasoline than at 80 km/h, in the same gear. The most economical speed is said to be 65-80 km/h.
Hyundai Sonata Hybrid: 670 Miles. Hyundai. Highway Fuel Economy: 51 mpg. While many of the cars on this list owe their high range numbers to either parsimonious fuel economy or a large fuel tank ...
Travel Fuel Economy Fuel economy hovers around 10 miles per gallon. Pulling a trailer is considered more economical. It relies on the truck or SUV for its gas mileage, and this means getting an average of 20 miles per gallon. Even if it's just 15 mpg, that's a vast improvement at today's prices. [2]
Fuel Economy. Electric vehicles can reduce fuel costs dramatically because of the high efficiency of electric-drive components. Because all-electric vehicles and PHEVs rely in whole or part on electric power, their fuel economy is measured differently than that of conventional vehicles. Miles per gallon of gasoline equivalent (MPGe) and ...
To calculate fuel consumption based on distance, do the following: Note down the efficiency of the fuel. Get the total distance traveled. Divide the distance by the efficiency, to find the fuel consumption. For example, if the efficiency is 26 miles per gallon, and the distance is 13 miles, then Fuel consumption = 13/26 = 0.5 gallons.
Round-trip flights within the U.S. are averaging $290 in April, but prices are expected to rise in the months ahead. Hopper's data shows prices for domestic flights will peak between May and ...
VW, Bentley, Audi and Porsche MPG Estimates Revised. Clean Cities and Communities. Alternative Fuels Data Center. EV Explorer. EPA gas mileage, safety, air pollution, and greenhouse gas estimates for new and used cars and trucks. Improve the MPG of your vehicle with our gas mileage tips.
Fuel consumption data from the Argonne National Laboratory in the United States serves as the basis for establishing the quantitative correlation between the fuel consumption rate and speed. ... without a significant extension in travel time. In urban settings, fluctuating traffic conditions and closely spaced signalized intersections lead to ...
Additionally, the V2V communication system revealed that traffic control parameters, specifically the safety time (t s ) between two cars, significantly affect vehicle performance and fuel consumption. In the FTP-72 cycle, an increase in t s led to an increase in the car's travel range and a decrease in battery usage.