How to Calculate Admits Per 1000
by Victoria Lee Blackstone
Published on 8 Nov 2018
"Admits per 1,000" is a term that represents how many patients are admitted to a hospital, healthcare facility or treatment center for every 1,000 people who seek help there. Many patients enter through the emergency department or in-patient admissions at regional hospitals, but other types of medical providers also are included, such as psychiatric and chemical-dependency facilities. Regardless of the type of medical facility, admits per 1,000 is a ratio that's calculated using a simple math equation.
You can calculate the number of admits per 1,000 visits by taking the number of admits over a given time, multiplying it by 1,000, and then dividing it by the total number of people who visited the facility during that identical duration of time.

How to Calculate Admits Per Thousand
In order to calculate the number of admits per thousand, you must first determine the number of patients admitted to a hospital, healthcare facility or treatment center in a given time period. Next, multiply this number by 1,000. Lastly, divide the result by the total number of people who visited that medical provider, including those who were not ultimately admitted to the facility.
By using the calculation above, if a hospital admits 500 patients from a total of 800 people who visited the hospital, the number of admits per thousand is 625 (500 x 1,000 divided by 800 = 625).
Why Is This Calculation Important?
Hospitals and other in-house medical facilities face ongoing challenges as they prepare budgets and cost estimates for future years. Admits per 1,000 is one way they can project a future year's financial needs based on the past year's actual patient statistics. This simple equation can help healthcare centers find solutions to minimize their costs, manage their supplies, modify their medical practices and adjust their budgets.
Benchmarking to Compare Standards
Admits per 1,000 also provides a benchmark, or point of reference, from which one hospital may measure its performance based on one or more other hospitals. Benchmarking can compare one hospital's statistics to other hospitals, which may be in the same community/county, state or national database. Hospitals may use the benchmarking tool to help them identify areas that need improvement toward their ongoing goal of providing the best patient care at the best costs.
Identifying Proactive Benefits
Although monitoring expenses is a primary focus of calculating admits per 1,000, hospitals can also use this calculation to help identify industry trends as they begin to emerge. This proactive management tool allows hospitals to stay on the forefront of subtle shifts in patient care so they can quickly identify and eliminate wasteful spending and unnecessary supply costs and other expenses. With a total of 140-plus million hospital visits each year just to emergency departments, according to a 2014 Centers for Disease Control and Prevention report, the data collected from a hospital's admits-per-1,000 calculations have significant potential to reduce national healthcare costs.
- HEDIS Measures and Technical Resources
- Emergency Department Utilization
Emergency Department Utilization (EDU)
Assesses emergency department (ED) utilization among commercial (18 and older) and Medicare (18 and older) health plan members. Plans report observed rates of ED use and a predicted rate of ED use based on the health of the member population. The observed and expected rates are used to calculate a calibrated observed-to-expected ratio that assesses whether plans had more, the same or less emergency department visits than expected, while accounting for incremental improvements across all plans over time. The observed-to-expected ratio is multiplied by the emergency department visit rate across all health plans to produce a risk-standardized rate which allows for national comparison.
Why It Matters
ED visits are a high-intensity service and a cost burden on the health care system, as well as on patients. Some ED events may be attributed to preventable or treatable conditions . A high rate of ED utilization may indicate poor care management, inadequate access to care or poor patient choices, resulting in ED visits that could be prevented. 1,2 Plans can ensure that members receive appropriate, coordinated primary care to address preventable ED visits.
Results – National Averages
Emergency department utilization total rate.
*Lower rates signify better performance.
§ Not available due to CMS suspension of data reporting during COVID-19 pandemic.
This State of Healthcare Quality Report classifies health plans differently than NCQA’s Quality Compass. HMO corresponds to All LOBs (excluding PPO and EPO) within Quality Compass. PPO corresponds to PPO and EPO within Quality Compass.
Figures do not account for changes in the underlying measure that could break trending. Contact Information Products via my.ncqa.org for analysis that accounts for trend breaks.
- Dowd, B., M. Karmarker, T. Swenson, et al. 2014. “Emergency department utilization as a measure of physician performance.” American Journal of Medical Quality 29 (2), 135–43. http://ajm.sagepub.com/content/29/2/135.long
- Agency for Healthcare Research and Quality. 2015. Measures of Care Coordination: Preventable Emergency Department Visits. Accessed at https://www.ahrq.gov/research/findings/nhqrdr/chartbooks/carecoordination/measure2.html
Save your favorite pages and receive notifications whenever they’re updated.
You will be prompted to log in to your NCQA account.
Share this page with a friend or colleague by Email.
We do not share your information with third parties.
Print this page.
- Email Us

- Channels ►
- Executive Moves
- Transaction & Valuation
- Health Equity
- Patient Experience
- Care Coordination
- Legal & Regulatory
- Compensation
- Specialties ►
- Orthopedics
- Surgery Centers
- Dental / DSO
- Becker's Healthcare Websites ►
- Dental + DSO
- Behavioral Health
- Physician Leadership
- Newsletters ►
- Sign Up For Our Free E-Newsletters
- Hospital Review
- Hospital CEO Report
- Hospital CFO Report
- Health IT & CIO Report
- Clinical Leadership
- Revenue Cycle Management
- Digital Innovation Report
- Supply Chain
- Payer Issues
- Pharmacy Report
- Women's Leadership
- Laboratory Review
- Cardiology Report
- Oncology Report
- HR + Talent Review
- Post Acute Report
- Life Sciences Report
- Behavioral Health Report
- Marketing Report
- Events ►
- Upcoming Conferences and Events
- 21st Annual Spine, Orthopedic and Pain Management-Driven ASC + The Future of Spine Conference
- Spring Future of Dentistry Roundtable
- 9th Annual Health IT + Digital Health + RCM Annual Meeting: The Future of Business and Clinical Technologies
- Becker's ASC 30th Annual Meeting: The Business and Operations of ASCs
- Fall Future of Dentistry Roundtable
- Fall Payer Issues Roundtable
- 12th Annual CEO + CFO Roundtable
- 15th Annual Meeting
- Exhibiting & Sponsoring
- Call for Speakers
- Virtual Events ►
- Upcoming Virtual Events
- Payer Issues Virtual Event
- CMO + CNO Virtual Event
- Transform Hospital Operations Virtual Summit
- Infusion Center Operations Virtual Summit
- CEO + CFO Virtual Forum
- Oncology Virtual Forum
- AI + Digital Health Virtual Event
- Digital Innovation + Patient Experience and Marketing Virtual Event
- Dental + DSO Virtual Event
- Human Resources + Talent Virtual Event
- Past Virtual Events
- Webinars ►
- Upcoming Webinars
- OnDemand Webinars
- Partner Content ►
- Current Partner Content
- Podcasts ►
- Our Podcasts
- Becker's Healthcare Podcast Episodes
- Becker’s Digital Health + Health IT Podcast
- Becker’s Payer Issues Podcast
- Podcast Summaries
- Becker's Behavioral Health Podcast
- Becker's Ambulatory Surgery Centers Podcast
- Becker's Spine and Orthopedics Podcast
- Becker's Dental + DSO Review Podcast
- Becker’s Clinical Leadership Podcast
- Becker’s Pediatric Leadership Podcast
- Becker's Cardiology + Heart Surgery Podcast
- Becker's Women's Leadership Podcast
- Lists ►
- Nominations
- Sign up for list nomination updates
- Print ►
- Current Issue
- Past Issues
- Current Issue - Becker's Clinical Leadership
- Past Issues - Becker's Clinical Leadership
- Multimedia ►
- Intuitive + Becker's Content Hub
- NRC Health Content Hub
- Now is the Time
- LeanTaaS AI Solutions
- Healthcare Upside/Down Podcast Series
- Featured Content
- Career Center
- Mass General Brigham
- AMN Healthcare
- About Us ►
- About Becker's Hospital Review
- Careers at Becker's
- Request Media Kit
- Content Specifications
- Most Read ►
- UPMC to lay off around 1,000 employees
- Hospitals slam FTC's noncompete ban
- Jackson Health lays off hospital CEO, staff amid financial woes
- UnitedHealth paid ransom for patient data
- Joint Commission unveils new accreditation
- Optum shutting down telehealth business
- Why nurses are protesting AI
- Male vs. female nurses by the numbers
- California hospital to lay off 191 workers as it faces loss of Medicare contract
- 25 most expensive hospital drugs
- Top 40 Articles ►
- 6 hospitals seeking CEOs
- 32 recent hospital, health system executive moves
- 23 hospitals, health systems cutting jobs
- Catholic health system to replace all crucifixes
- 150+ top places to work in healthcare | 2024
- California system gave $100,000 bonuses to nurses for retention. Did it work?
- UnitedHealth suspects 'nation-state' behind Change outage: 7 things to know
- Jury ups Johns Hopkins hospital damages to $261M in Netflix case
- Experts scramble to understand rising cancer rates in young adults
- Jury rules against Johns Hopkins in case made famous by Netflix
- Meet the 24-year-old running a Colorado hospital
- Former Kaiser nurse awarded $41M in retaliation lawsuit
- 15 'overpaid' CEOs in healthcare
- Mark Cuban: CEOs 'waste a sh-tload of money' on healthcare
- 5 hospitals seeking CEOs
- Optum enacts layoffs, workers say
- Walmart names 1st health system partner
- 16 women making moves in healthcare
- 12 healthcare trends and issues we are following for 2024
- From -6.8% to 12.2%: 43 health systems ranked by operating margins
- Amazon launches One Medical for Prime
- 100 largest hospitals and health systems in the US | 2023
- 11 recent hospital, health system CEO moves
- Hackers leak Change Healthcare contracts, patient data
- As Steward's finances stumble, spotlight turns to CEO's yachts
- 'An attack on the entire sector': Fallout from Change Healthcare hack continues
- Best healthcare jobs in 2024: US News
- Healthgrades' 50 top hospitals for 2024
- UChicago sued for negligence in death of Silver Cross Hospital CEO
- 418 rural hospitals at risk of closure, breakdown by state
- 15 health systems with strong finances
- Ransomware group leader told hackers to attack hospitals, FBI, HHS say
- The No. 1 problem still keeping hospital CEOs up at night
- Where are Leapfrog's 18 straight-'A' hospitals?
- 10 health systems moving to Epic
- HHS intervenes in Change Healthcare hack
- Mark Cuban's drug company partners with 1st health system
- The layoff runway lengthens
States ranked by ER visit rate
The District of Columbia has the highest rate of emergency room visits in the U.S., according to the most recently available data from the Kaiser Family Foundation.
The Kaiser Family Foundation analyzed data from the 1999-2017 American Hospital Association Annual Survey.
Here are ER visit per 1,000 population in all 50 states and the District of Columbia in 2017 (the most recent data available):
Note: The list includes ties and results in a numerical listing of 45.
1. District of Columbia: 698
2. West Virginia: 648
3. Louisiana: 618
4. Ohio: 611
5. Mississippi: 604
6. Kentucky: 580
7. Alaska: 551
8. North Dakota: 538
9. Tennessee: 519
10. Indiana: 514
Pennsylvania: 514
Vermont: 514
11. South Carolina: 513
12. Michigan: 511
13. Missouri: 504
14. New Hampshire: 498
15. Arkansas: 496
16. Oklahoma: 492
17. Maine: 486
18. Massachusetts: 485
19. Connecticut: 480
Montana: 480
20. Alabama: 479
21. New Mexico: 475
22. North Carolina: 473
23. Delaware: 467
24. Georgia: 455
25. Illinois: 448
26. Florida: 438
Wyoming: 438
25. Iowa: 436
26. New York: 433
27. New Jersey: 431
28. Wisconsin: 429
29. Virginia: 423
30. Texas: 422
31. Nebraska: 420
32. Kansas: 418
33. Washington: 398
34. Idaho: 394
35. Maryland: 392
36. Rhode Island: 390
37. Oregon: 378
38. South Dakota: 375
39. Minnesota: 372
40. Utah: 358
41. Colorado: 355
42. California: 341
43. Nevada: 323
44. Arizona: 319
45. Hawaii: 317
More articles on rankings and ratings: States ranked by annual healthcare cost per smoker States ranked by adults with fair, poor health How 29 physician specialties rank on happiness outside of work
Copyright © 2024 Becker's Healthcare. All Rights Reserved. Privacy Policy . Cookie Policy . Linking and Reprinting Policy .
Featured Learning Opportunities
- Whitepapers
- Process Improvement Whitepapers
- Health IT Whitepapers
- Finance Whitepapers
- Clinical Whitepapers
- Payer Whitepapers
- Other Learning Opportunities
- Process Improvement Webinars
- Health IT Webinars
- Finance Webinars
- Clinical Webinars
- Payer Webinars
- Virtual Events
- ASC/Spine Whitepapers
- Dental Whitepapers
- ASC/Spine Webinars
- Dental Webinars
- Hospital Review Virtual Events
- ASC/Spine Virtual Events
- Dental Virtual Events
Featured Whitepapers
Featured webinars, 10 most-read articles.
Becker's Websites
Virtual Learning
Conferences
- 14th Annual Meeting
- Spring Payer Issues Roundtable
- 9th Annual Health IT + Digital Health + RCM Meeting: The Future of Business and Clinical Technologies
- 1.800.417.2035
- [email protected]

An official website of the United States government
The .gov means it’s official. Federal government websites often end in .gov or .mil. Before sharing sensitive information, make sure you’re on a federal government site.
The site is secure. The https:// ensures that you are connecting to the official website and that any information you provide is encrypted and transmitted securely.
- Publications
- Account settings
Preview improvements coming to the PMC website in October 2024. Learn More or Try it out now .
- Advanced Search
- Journal List
- J Med Internet Res
- v.21(10); 2019 Sep
Reduced Hospitalizations, Emergency Room Visits, and Costs Associated with a Web-Based Health Literacy, Aligned-Incentive Intervention: Mixed Methods Study
Jeffrey c greene.
1 MedEncentive, Oklahoma City, OK, United States
Jolie N Haun
2 College of Public Health, University of South Florida, Tampa, FL, United States
Dustin D French
3 Department of Ophthalmology, Feinberg School of Medicine, Northwestern University, Chicago, IL, United States
Susan L Chambers
4 Oklahoma City Gynecology & Obstetrics, Oklahoma City, OK, United States
Robert H Roswell
5 University of Oklahoma College of Medicine, Health Administration and Policy, University of Oklahoma College of Public Health, Oklahoma City, OK, United States
Associated Data
Patient’s diagnosis entered in the program’s website by the doctor.
Doctors select relevant education for their patients.
Patients are notified of their “opportunity” to earn a financial reward for participating in the program.
Patients read educational article specific to their health.
Patients answer questions to confirm their understanding of how to self-manage their health.
Patients declare their adherence with recommended treatments, or provide a reason for nonadherence.
Patients allow their physicians access to their knowledge assessment and adherence declaration.
Patients rate how consistent their physician’s care is to recommended treatments.
MAIT Program study flow diagram.
Patient and provider success rates.
Hospitalization and emergency room rates.
Economic outcomes of the health plan, pre- and post-MAIT Program implementation.
The association between health literacy and health care costs, particularly for hospitalizations and emergency room services, has been previously observed. Health information interventions aimed at addressing the negative impacts of inadequate health literacy are needed. The MedEncentive Mutual Accountability and Information Therapy (MAIT) Program is a Web-based system designed to improve health and lower costs by aligning patient-doctor incentives.
In this mixed methods study of a Web-based patient-doctor aligned-incentive, information therapy program conducted in an 1800-member employee health plan, we aimed to (1) determine the program’s quantitative impact on hospitalization and emergency room utilization and costs, and (2) assess survey responses about the program’s perceived value.
We used a mixed methods, single within-group, pre-post, descriptive study design. We analyzed quantitative data using pre-post mean utilization and cost differences and summarized the data using descriptive statistics. We used open-ended electronic survey items to collect descriptive data and analyzed them using thematic content analysis.
Hospitalizations and emergency room visits per 1000 decreased 32% (26.5/82.4) and 14% (31.3/219.9), respectively, after we implemented the program in 2015-2017, relative to 2013-2014. Correspondingly, the plan’s annual per capita expenditures declined US $675 (95% CI US $470-865), or 10.8% ($675/$6260), after program implementation in 2015-2017 (US $5585 in 2013-2014 dollars), relative to the baseline years of 2013-2014 (US $6260; P <.05). Qualitative findings suggested that respondents valued the program, benefiting from its educational and motivational aspects to better self-manage their health.
Conclusions
Analyses suggested that the reported reductions in hospitalizations, emergency room visits, and costs were associated with the program. Qualitative findings indicated that targeted users perceived value in participating in the MAIT Program. Further research with controls is needed to confirm these outcomes and more completely understand the health improvement and cost-containment capabilities of this Web-based health information, patient-doctor, aligned-incentive program.
Introduction
Health literacy is defined as the “degree to which individuals have the capacity to obtain, process, and understand basic health information and services needed to make appropriate health decisions” [ 1 ] and “the capacity of individuals to obtain, interpret, and understand basic health information and services and the competence to use such information and services in ways which enhance health” [ 1 ]. The association between patients’ health literacy levels and hospitalizations, preventable emergency room visits, and overall health care costs is established in the literature [ 2 - 7 ]. Not only is inadequate health literacy harmful and expensive, it is also prevalent. The 2003 National Assessment of Adult Literacy suggests that only 1 in 9 adults in the United States has proficient health literacy [ 6 ], contributing to billions of dollars in preventable expenditures per year [ 7 ]. Previous population-level studies have confirmed, when controlling for other person-level factors, that lower health literacy is a significant, independent factor associated with increased health care utilization and costs [ 2 , 3 , 5 , 8 - 10 ]. Specifically, inadequate health literacy has been associated with higher rates of hospitalizations and preventable emergency room visits [ 2 , 8 , 9 ]. Citing overwhelming empirical evidence, the US Department of Health & Human Services designated health literacy improvement as a top priority in 2010 [ 10 ]. Although inadequate health literacy is harmful, expensive, and prevalent, there have been few viable solutions to address the effects of inadequate health literacy in the general population and, much less, best practices to narrow the doctor-patient information asymmetry on a group level [ 5 ]. Best practices in the field of health literacy have recommended the need for universal precautions [ 11 ].
For decades, financial incentives to improve health care and health behaviors have been directed toward physicians and patients separately, with marginal success [ 12 , 13 ]. A recent study, in which a form of patient-doctor, aligned incentives was compared with traditional methods, found that the aligned-incentive approach produced superior outcomes [ 14 ]. Based on this finding, leading researchers in the field of behavioral economics concluded that “[aligned] financial incentives for patients and physicians could generate synergies that help patients, physicians, and health insurers achieve greater improvements in population health” [ 13 ]. Similar to health literacy, there are few, if any, viable patient-doctor, aligned-incentive solutions.
Information therapy is a term for “supplying patients with health information, enabling them to make informed decisions about their health and care, participate in their own well-being, and thus decrease the utilization of healthcare resources” [ 15 ]. It is further defined as providing patients with the right information, at the right time, in the right way, so patients can make informed decisions about their health [ 16 ]. Compensating physicians to provide an information therapy prescription to their patients as a reimbursable service is a concept suggested in the literature years ago but, heretofore, never attempted in a real-world setting [ 17 ]. Incentivizing patients to engage in information therapy and demonstrate assimilation of the information is a new concept, as is the idea of offering patient-doctor aligned incentives to empower and motivate patients with knowledge to self-manage their health. Reward-induced information therapy has the potential to offer a simple and sustainable solution to mitigating the debilitating effects of inadequate health literacy, in a manner that improves health and lowers per capita utilization and expenditures [ 17 , 18 ].
Prior research suggests that the majority of the general population have inadequate or marginal health literacy, requiring remediation when accessing the health care system [ 6 ]. Information therapy, as an established, systemwide practice, potentially provides a universal approach to support patients’ health information needs—a key contribution to health literacy. We contend that utilization and cost are established outcome proxies to assess effects associated with information therapy [ 2 , 7 ].
The purpose of this study was to evaluate the outcomes of an employee health plan over a 5-year period, before and after the introduction of a Web-based information therapy, patient-doctor, aligned-incentive program. More specifically we aimed to (1) determine the impact (quantitatively) of the program on inpatient and emergency room utilization and costs, which also are proxies for overall health status, before and after implementation; and (2) evaluate participants’ experiences using the program in correlation with the quantitative results.
The MedEncentive Mutual Accountability and Information Therapy Program
The MedEncentive Mutual Accountability and Information Therapy (MAIT) Program is a Web-based, mobile-enabled, information therapy, patient-doctor aligned-incentive program that promotes patient education and personal accountability, and supports health care cost containment [ 17 , 18 ]. MedEncentive’s customers are health insurance plans sponsored by self-insured employers, governments, health systems, and commercial insurers. The MedEncentive program augments the sponsor’s health plan ( plan ) as an additional benefit to the plan’s members ( beneficiaries ). In the case of self-insured employers, the plan’s summary plan description is modified to recognize the program as a benefit. As part of the service agreement, the plan sponsor directs its plan administrator (third-party administrator) to electronically transmit plan-member demographic enrollment and claims files to MedEncentive’s computer system, and receive reward files for payment to doctors and patients who participate in the program. These electronic data exchanges employ industry-standard transmission protocols and data formats, so that they are secure, automated, and maintenance-free.
Program Overview
The MAIT Program uses plan sponsor-supplied member enrollment data to send orientation letters and personalized membership identification cards to all adult plan members. A program opportunity , for both doctors and patients, is initiated when doctors access the program’s website, or as a result of MedEncentive’s receipt of a claim associated with a covered service. Covered services include any visit, consultation, or preventive examination rendered in-office to a covered member, by physicians (eg, doctor of medicine, doctor of osteopathy) of any medical specialty, or by licensed physician extenders (ie, nurse practitioners or physician assistants), for any medical condition or wellness examination.
The Provider’s Experience
MedEncentive uses the diagnosis from the transmitted office visit claim to notify physicians of program opportunities via fax and email. These notices direct physicians to the MedEncentive website, where they may elect to participate in the program in 2 ways: (1) on a point-of-service (POS)-initiated basis, or (2) on a claims-initiated basis. The POS-initiated version is typically accomplished when practice personnel assign an identifier in their in-office computer system to patients covered by the program. These systems automatically notify doctors to access the program’s website during or shortly after a covered office visit, to initiate an opportunity by entering the patient’s diagnosis (see Multimedia Appendix 1 ). The MAIT Program can be integrated with in-office systems, which was the case in this implementation.
The claims-initiated version serves as a safety net in case a POS-initiated opportunity is missed. In the claims-initiated version, the MedEncentive system monitors incoming insurance claims to see whether physicians have previously used the POS-initiated version of the program. If not, then the system uses claim information to preload the patient’s diagnosis and send the doctor the fax or email opportunity notice. When doctors choose to participate via the POS- or claims-initiated version, they access the program’s website to complete 2 tasks: (1) consider evidence-based medicine treatment guidelines, and (2) select a patient educational article that the program’s computer system lists in relevancy order to the patient’s diagnosis (see Multimedia Appendix 2 ). The POS-initiated version functions identically to the claims-initiated version, with the exception of diagnosis input, time limits, and level of compensation. Since the program places a premium on timeliness, doctors earn US $15.00 for completing a POS-initiated session and US $7.50 for completing a claims-initiated session.
When physicians do not participate within 4 days of a claims-initiated notification, patients select their own articles from the list in conjunction with their program opportunity. As a result of this accommodation, both doctors and patients can earn the program’s financial rewards independently of the other party’s participation.
The Patient’s Experience
Patient opportunities are initiated as a result of doctor participation, or as a result of office visit claims processing. Patients are notified of their opportunities to participate, by email notices or letters sent to their home, after each office visit (see Multimedia Appendix 3 ). Patients have 2 weeks to complete their information therapy sessions. For successfully completing a session, patients earn a financial reward, typically a refund of their office visit copay of US $15 or more. To earn their financial reward, patients access the program’s website to (1) read the prescribed or self-selected educational article (see Multimedia Appendix 4 ), (2) demonstrate their understanding of the health information by passing an open-book test or declaring their comprehension (see Multimedia Appendix 5 ), (3) declare their adherence or provide a reason for nonadherence (see Multimedia Appendix 6 ), (4) agree to allow their physician to review their knowledge and adherence assessments (see Multimedia Appendix 7 ), and (5) rate how consistent their physician’s care is to what they have just learned about recommended treatments (see Multimedia Appendix 8 ). Participation within required time frames is referred to as an information therapy success . When an opportunity expires without completion, this is referred to as a miss . Once a quarter, patients are given a second chance to complete the misses that occurred during the previous 90 days.
Patient Educational Content
While the program can be adapted to most Web-based educational content, MedEncentive used Healthwise articles in this implementation. Healthwise, Incorporated (Boise, ID, USA) is a conflict-free, nonprofit organization, nationally recognized for providing evidence-based, easy-to-understand health education at the fifth-grade reading level. They supply technology solutions that integrate with complex health information technology systems, with expert guidance on behavior change and shared decision making within the field of health care.
This study used a mixed methods, single within-group, pre-post, descriptive study design to evaluate the MedEncentive MAIT Program. We used open-ended electronic survey items to collect descriptive data. Multimedia Appendix 9 shows the program study flowchart.
The study involved the employee health plan of a not-for-profit, acute-care general hospital (health plan sponsor) located in a semirural community in the south-central United States. The hospital is staffed by more than 1400 employees, with more than 100 physicians representing more than 30 specialties.
The study sample comprised the plan sponsor’s employees and their covered dependents, to include spouses and children. The employees in the health plan were hospital and clinic personnel, including doctors, nurses, and other medical professionals, as well as administrative and support staff. No person in the covered population was excluded from this study or its analyses. We did not adjust to account for new hires or terminations.
Data Sources
The analysis of the program implementation relied on multiple sources of data and related background information. The health plan sponsor, its third-party administrator, and its pharmacy benefits manager were the primary sources of plan-member enrollment, medical claims, and pharmacy expenditure data, from 2013 through 2017. We compiled the provider and patient program activity data and survey responses from MedEncentive’s computer system.
Quantitative Procedures
Quantifying the impact of the MAIT Program involved a careful, step-by-step process of compiling and evaluating doctor and patient participation rates; the health plan’s 2013-2017 hospitalizations, emergency room visits, and total expenditures; and other demographic and comorbid condition variables, before and after the program was implemented.
Doctor and Patient Participation Rates
The MedEncentive computer system automatically calculates doctor and patient participation using a unit of measure called success rate . This metric is derived by dividing the number of program successes (successfully completed information therapy sessions) by the total number of opportunities (office visits) incurred by all covered plan members. While patients need to know their doctors have an opportunity to participate—thus making physician inclusion in the program essential—patient success rate is the metric most aligned with reductions in hospitalizations and per capita expenditures at a group level.
Hospitalizations, Emergency Room Visits, and Total Health Care Expenditures
Detailed claims data for medical services, excluding pharmacy, were transmitted to MedEncentive on a monthly basis by the plan sponsor and its third-party administrator. Each claim contained more than 200 data elements, such as type of service, diagnosis, rendering provider, service location, gross charges, and net payments. The claims data included physician compensation and patient rewards associated with the program.
We sorted these data by date of service (end date) to organize the medical activity into the year services were rendered, from 2013 through 2017. We observed a typical 90-day run-out period for each year to capture the incurred charges in the year they occurred. We removed dental and optometry claims, since these services are not covered or directly affected by the program. To account for total expenditures, we added the plan members’ direct out-of-pocket payments (copay amount, coinsurance, and deductible) to the amount paid by the plan sponsor. The clinical and economic analyses included all health plan enrollees, before and after implementation, regardless of program participation status.
Qualitative Procedures
We collected descriptive data about users’ experiences with the MAIT Program through open- and closed-item electronic surveys. Administered at the conclusion of every information therapy session, for both doctors and patients, the surveys were voluntary and had no effect on the participants’ financial rewards associated with the program. The open-ended items asked physicians and patients about their experience with the program and for their suggestions for improvement. Closed-ended survey items asked patients about (1) how helpful the educational article was for managing their diagnosis or in maintaining their health (2) how closely they were following the health recommendations contained in this article, (3) how much physician access to the program’s survey responses motivated them to improve their health literacy and health behaviors, (4) the importance of their physician’s awareness regarding the patient’s capacity for self-management, and (5) the importance of their physician’s awareness of the patient’s intention to accomplish health objectives.
Quantitative Analysis
Since voluntary participation in the program by doctors and patients can be associated with the intended clinical and economic outcomes, we began our quantitative analysis by examining the standard doctor and patient success rate reports generated by the MedEncentive computer system. We were particularly interested in determining whether we had achieved the 55% patient success rate threshold, since it is predictive of the clinical and economic group-level effectiveness of the program.
We analyzed clinical and economic outcomes by comparing annual hospitalizations per 1000 enrollees, emergency room visits per 1000 enrollees, total expenditures per capita, and other variables for 2015-2017 (the implementation period) versus the baseline years (2013-2014), prior to implementing the program. We conducted pre-post analysis of mean cost differences, with confidence intervals, for emergency room, hospitalization, and total care costs [ 19 - 22 ].
Since the program was designed to motivate adherence to recommended treatments and mitigate the effects of inadequate health literacy, which are associated in the literature with hospitalizations, emergency room visits, and total expenditures, these measures were the most effective means to measure program effectiveness [ 23 - 26 ]. To compare annual preimplementation versus postimplementation per capita expenditures, we multiplied the post period (2015-2017) annual episodes (units) of care (hospitalizations, emergency room visits, outpatient services, and pharmacy scripts) by the annual unit costs incurred during the baseline period (2013-2014). The normalization adjustments were made in consultation with the health plan sponsor (hospital) to adjust for known variables, such as pricing, coding, and charge capture. There were no significant benefit design changes over the 5-year period. We considered other health improvement and cost-containment initiatives and, upon analysis, ruled them out as significant contributors to the outcomes analyzed (hospitalizations and emergency room utilization, and total costs).
Qualitative Analysis
Structured, open-ended survey-item data were deidentified and cleaned, and prepared for analysis. We managed qualitative survey data responses using thematic content analysis, based on the topic addressed in the structured items and the response (eg, adherence, program satisfaction). We analyzed data in 2 stages to identify domains and taxonomies related to participant experiences [ 27 ]. The first round of coding included summarizing and reducing data into preliminary metadomains. Methods included deductive structural coding and inductive descriptive coding, based on themes that emerged from the surveys. In a second round of coding, we reduced coded data into meaningful domains. As we developed coding schemas to create domains, data samples were extracted and coded by at least two team members and evaluated for interrater reliability and validity.
Ultimately, we sorted open-ended survey data into program, provider (doctor), health status, and other categories. Comments pertaining to the program were coded as testimonials, suggestions and service requests, and complaints. Comments pertaining to providers were coded as testimonials and complaints. Comments related to the patient’s health status were coded as general medical condition, improving medical condition, and worsening medical condition. Other comments included insurance complaints.
Quantitative Sample-Based Findings
Table 1 presents the health plan’s total enrollees per annum, the mean annual enrollment, and the number of enrollees who received health care, as well as demographic variables, for the years 2013 through 2017. This study’s sample of patients comprised the plan sponsor’s employees and their covered dependents (ie, spouses and children), with a mean of 1803 per year over the 5-year study period ( Table 1 ). It is notable that the plan grew from a mean of 1660 enrollees in 2013 to 1960 enrollees in 2017. The number of plan members receiving care grew from 1560 in 2013 to 1863 in 2017, and the total number of plan members enrolled at any point during a calendar year grew from 1752 in 2013 to 2554 in 2017. This growth was due, in large part, to the expansion of the hospital’s services and acquisition of local medical clinics.
Demographic characteristics of patients from 2013-2014 (before program implementation) and 2015-2017 (after program implementation).
a Total members treated during the year.
b Total plan-member enrollees during the year.
c 2013 total enrollees extrapolated from members treated.
Patient Success (Participation) Rates
Patient participation exceeded the targeted 55% success rate threshold in the first year, reaching 68.67% (4245/6182) at the end of 2015. Patient success rate continued to climb to 74.23% (5108/6881) in the first quarter of 2018 (see Multimedia Appendix 1 0). This level of patient participation predicted, with a high probability, that the clinical and economic outcome objectives would be achieved.
As Table 2 shows, young adults (18-29 years) had the lowest patient success rate (1885/2969, 63.49%) over the 3-year intervention period, while senior adults (≥65 years) had the highest success rate (697/894, 78.0%). Also, the 60- to 65-year age group had the greatest improvement in success rate, climbing 18.4% from 2015 to 2017. This suggests that those with the greatest need participated in the program most frequently and dispels the notion that older adults may be technology challenged or averse to Web-based health literacy mechanisms. Also notable, males and females participated at essentially the same rate (4544/6463, 70.31% vs 8700/12,212, 71.24%, respectively), though females made far more office visits, and the number of office visits per capita remained consistent over the 3-year period (3.3-3.4 visits per annum).
Total patient success rate, total office visits, and overall success percentage (2015-2017), and 3-year trend by demographic characteristics.
Provider Success (Participation) Rates
The overall annual provider success rate started at 30.62% (1890/6173) at the end of 2015 and climbed to 45.41% (2619/5768) by the end of 2016 (see Multimedia Appendix 1 0). The providers employed by the hospital (health plan sponsor) achieved an even higher level of provider engagement, reaching 55.34% (1654/2989) by the end of 2016. This was due to two developments during the first 18 months of implementation. First, the hospital (plan sponsor) changed its policy of retaining the program’s compensation earned by its employed providers, agreeing to pass these payments on to their participating physicians. Second, the hospital integrated the program with the hospital’s electronic health record system, NextGen, a leading electronic health record supplier. This project was completed in 2016. As a result, doctors were able to access the program through the hospital’s electronic health record system, while having patient demographic and diagnosis information directly transmitted to the MedEncentive computer system. Providers were also automatically notified of covered patients before, during, and immediately after an office visit, offering physicians greater opportunity to use the more timely and higher-paying real-time version of the program.
Clinical and Economic Outcomes
Program effectiveness can, in part, be measured by an improvement in clinical outcomes, including overall hospitalization and emergency room visit rates. We compiled the total hospitalizations and emergency room visits from the claims data for the 2 years prior to program implementation (2013-2014), and the 3 years after deployment (2015-2017), as Table 3 shows. All members enrolled in the health plan were included in the totals. As Multimedia Appendix 11 illustrates, 2013 and 2014 hospitalizations per 1000, before the introduction of the program, were 87.3 and 82.4, respectively. In 2015, 2016, and 2017, after program implementation, the hospitalization rates were 57.2, 53.9, and 56.6, respectively ( P <.05). On average, this represents a 32% (26.5/82.4) decrease in admissions per 1000, relative to the baseline year of 2014. Emergency room visits per 1000 in 2013 and 2014 were 251.8 and 219.9, respectively, whereas in 2015, 2016, and 2017, emergency room visits per 1000 plan members decreased to 191.3, 187.5, and 187.3, respectively ( P <.05). In summary, hospitalizations and emergency room visit rates per 1000 decreased 32% (26.5/82.4) and 14% (31.3/219.9), respectively, in 2015-2017 after implementation of the program, relative to 2013-2014, prior to program implementation, inclusive of all enrollees (participants and nonparticipants).
Hospitalizations and emergency room visits from 2013-2014 (before program implementation) and 2015-2017 (after program implementation).
a N/A: not applicable.
As Multimedia Appendix 12 illustrates, the plan’s annual per capita expenditures, inclusive of all program costs, declined US $675 (95% CI US $470-865), or 10.8% ($675/$6260), after program implementation in 2015-2017 (US $5585 in 2013-2014 dollars), relative to the baseline years of 2013-2014 (US $6260; P <.05), inclusive of all enrollees (participants and nonparticipants) (see Table 4 ).
Health care costs from 2013-2014 (before program implementation) and 2015-2017 (after program implementation).
a 2015-2017 amounts adjusted to 2013-2014 basis.
b N/A: not applicable.
c Total program costs for 2015-2017 include all patient rewards, physician compensation, and program administration fees.
d Gross savings for 2015-2017=2015-2017 average expenditures less program costs – 2013-2014 average expenditures.
e Net savings for 2015-2017=2015-2017 average expenditures with program costs – 2013-2014 average expenditures.
Quantitative Survey-Based Findings
During 2015-2017, the participating health plan members rated the helpfulness of the program’s educational content at 4.40 out of 5 (with 5 being most helpful), representing 15,260 responses. These ratings indicated there was a strong consensus among patients that the program’s educational content was helpful in managing their disease or condition, or in maintaining good health.
When patients were asked to report (to their doctors) their level of adherence with the health recommendations contained in the program’s educational content, on a scale of 1 to 5, with 1 meaning “not following recommendations” and 5 meaning “following recommendations closely,” the mean response was 4.70 (n=15,186) over the 2015-2017 time period. These self-assessments indicated a strong consensus among patients that they were, or intended to be, compliant with recommended treatments. Table 5 presents survey-item results.
Patient responses to 5-point Likert-type scale survey items.
The survey item reflecting physician influence on the patient’s motivation to gain health knowledge and improve health behaviors had a mean score of 8.80 out of 10, representing 13,401 responses, indicating a strong consensus that physicians positively influenced patients to improve their health literacy and health behaviors. When asked whether it was important for his or her physician to know of the patient’s competency to self-manage, patient responses had a mean score of 9.24 out of 10, representing 13,401 responses. This indicated that the majority of patients thought it important that their doctor was aware that they understood how to manage their health. Finally, when asked whether it was important that their physicians knew that they were accomplishing health objectives, patient responses had a mean score of 9.26 out of 10, representing 13,401 responses. This indicated that the majority of patients thought it important that their doctor was aware that they were trying to accomplish health objectives. Table 6 presents survey response distributions for these items.
Patient participant responses to 10-point Likert-type scale survey items.
Qualitative Survey-Based Findings
During 2016-2017, patients posted 555 comments, with 323 (58.2%) pertaining to the program, 183 (33.0%) pertaining to their provider, 31 (5.6%) pertaining to health-related topics, and 18 (3.2%) pertaining to other general topics. Of the program-related comments, the majority (210/323, 65.0%) were testimonials, 33.4% (n=108) were suggestions or requests to improve the program, and 1.6% (n=5) were complaints. Table 7 lists exemplar patient and provider comments about the program.
Exemplar patient and provider information therapy program-related comments.
Principal Findings
The MedEncentive MAIT Program is, to our knowledge, one of the first population-level solutions to use a Web-based approach, combining doctor and patient aligned incentives and information therapy, aimed at improving health and lower costs. Our analysis suggests that the MedEncentive MAIT Program was associated with meaningful reductions in health care utilization that were sustained into the third year of program implementation, through reductions in per capita expenditures and hospitalizations and emergency room use. These findings are in line with previous research on aligned-incentive program expenditure outcomes [ 18 ].
Our quantitative analysis found that, from 2015 through 2017, after the program was introduced, hospitalizations and emergency room visits per 1000 plan members, and per capita expenditures, declined relative to the 2013-2014 preimplementation period, by 32.1%, 14.2%, and 10.8%, respectively. Correspondingly, the qualitative survey items suggested that the majority of respondents found the program’s educational content to be very helpful in managing their disease or condition, and maintaining good health. Since patient adherence is such an important predictor of health status, service utilization, and costs [ 28 ], it is compelling that the surveys indicated that most patients intended to be compliant with recommended treatments. Furthermore, the surveys found that physicians positively influenced patients to improve their health literacy and health behaviors.
These findings indicated that it was important to patients for their doctor to be aware that they (1) understand how to self-manage their health, and (2) are trying to accomplish health objectives. These reported attitudes help explain the quantitative outcomes and set the stage for aligned-incentive programs to leverage information therapy as a means to mitigate the impact of inadequate health literacy. It is notable that other health improvement initiatives were launched by the plan sponsor, principally in the 2016-2017 time frame. However, the most significant improvement in hospitalizations and emergency room rates was temporally associated with the introduction of the program in 2015.
Programmatic Implications
Program adoption and retention are predicated on its ease of implementation and maintenance. Over the test period, the plan sponsor experienced continuous program access 99.8% of the time, with no reports of degradation in the program’s website performance due to scaling or spikes in activity. The plan sponsor integrated the program with its clinic electronic health record system to streamline the provider experience. This integration functioned without difficulty throughout program implementation.
The effectiveness of any wellness, prevention, or managed-care program relies on high levels of patient and medical provider engagement in aspects of the program designed to improve health and health care. As the program participation statistics indicate, this goal was achieved and sustained, aided by the collaborative efforts of the plan sponsor and MedEncentive.
Study Limitations
Study limitations should be considered when interpreting our findings. First, though these findings are compelling, they can only be generalized to not-for-profit, acute-care, general-hospital employee health plans, located in the south-central United States. Second, the primary limitation is the internal nature of the evaluation. Future research should focus on external review and validation. Third, while this study offers associated confirmation of the program’s effectiveness, it is not a randomized control trial and, therefore, falls short of the gold standard for determining causation; hence, further research is needed. Fourth, the conservative analysis may be considered a limitation, compared with more complex analyses (eg, quasi-experimental designs); however, this was prohibited so as to remain compliant with institutional review board standards. Fifth, this evaluation did not control for individual health literacy, but we contend that, statistically, the majority of the general population have inadequate or marginal health literacy and require health information support, such as information therapy; therefore, this program supports health literacy needs at the universal level and measures relevant and meaningful associated outcomes. Future research should control for health literacy. Sixth, we made adjustments to normalize postimplementation expenditures to baseline levels in consultation with the plan sponsor. These adjustments reflect known variances in medical services coding, pricing, charge capture, and benefit design. The precision of these adjustments is difficult to judge, which is further justification to test the program’s capabilities by means of randomized control trials. Finally, although this was an opt-in study design, loss to follow-up can be an issue in cohort studies. Our study, however, included patients who used care throughout the study time frame.
Use of the Web-based MedEncentive MAIT Program was associated with a reduction in hospitalizations (26.5/82.4, 32%) and emergency room visits (31.3/219.9, 14%) per 1000 members. The plan’s annual per capita expenditures declined US $675 (95% CI US $470-865), or 10.8% ($675/$6260), after program implementation in 2015-2017 (US $5585 in 2013-2014 dollars), relative to the baseline year of 2014 (US $6260; P <.05). Our qualitative analysis of participant survey responses corroborated these findings. Therefore, it is reasonable to conclude that the effectiveness of the program was evident in this study. Findings warrant investment in larger, longer-running randomized control trials to further examine and validate these results.
Acknowledgments
The authors would like to acknowledge Stillwater Medical Center, whose leadership and staff made this project possible. In particular, we extend our sincere appreciation to Keith Hufnagel, Vice President, Human Resources; Leva Swim, PhD, Vice President, Population Health; and Wendi Barrett, CBO Director, for their generosity of time and consultation throughout this project.
The Corresponding Author has the right to grant on behalf of all authors, and does grant on behalf of all authors, a nonexclusive worldwide license to the publishers and its licensees in perpetuity, in all forms, formats and media (whether known now or created in the future), to i) publish, reproduce, distribute, display and store the Contribution; ii) translate the Contribution into other languages, create adaptations, reprint, include within collections and create summaries, extracts and/or abstracts of the Contribution; iii) create any other derivative work(s) based on the Contribution; iv) exploit all subsidiary rights in the Contribution; v) include electronic links from the Contribution to third-party material wherever it may be located; and vi) license any third-party to do any or all of the above.
Abbreviations
Multimedia appendix 1, multimedia appendix 2, multimedia appendix 3, multimedia appendix 4, multimedia appendix 5, multimedia appendix 6, multimedia appendix 7, multimedia appendix 8, multimedia appendix 9, multimedia appendix 10, multimedia appendix 11, multimedia appendix 12.
Conflicts of Interest: The authors respectfully wish to report potential conflicts of interest represented by financial benefit. JCG is the cofounder, chief executive officer, and part owner of MedEncentive, LLC, and receives no compensation from MedEncentive except for supplemental health insurance, valued at less than US $1000 per month. JCG is the inventor of the MedEncentive Mutual Accountability and Information Therapy Program’s patented process, trademarked as the Trilateral Health Accountability Model, in which he holds a royalty interest. SLC is cofounder and part owner of MedEncentive, LLC. She is also a royalty holder in the Company’s inventions. Both JCG and SLC are board members of MedEncentive, but neither is compensated in this role. As part owners and royalty holders, and in their aforementioned roles with the Company, JCG and SLC could financially benefit from the publication of this paper.
JNH and DDF received a consultation fee to provide expertise and support in the analysis, interpretation of data findings, and development of this manuscript. JNH and DDF do not have equity in the Company, nor is their payment contingent on the success of the Company; they do not sit on board or committee for the Company.
The Latest Emergency Department Utilization Numbers Are In
T he Centers for Disease Control and Prevention (CDC) released its statistical survey of emergency department visits for 2016 on April 1. Called the National Hospital Ambulatory Medical Care Survey (NHAMCS), it is a wealth of information for emergency physicians and will guide the data and trends for the emergency services for which they are responsible. 1
You Might Also Like
- Emergency Department Volume Increase Trend Continues Into 2014
- Long-Term Trends in Emergency Department Visits, Patient Care Highlighted in National Reports
- 2015 Emergency Department Survey Shows Spike in Volume, Structural Changes, Patient Boarding Concerns
Explore This Issue
The numbers.
ED visit estimates increased from 136.9 million in 2015 to 145.6 million in 2016, a jump of 6.4 percent. The 10-year volume change is 24.7 percent, and for the past 20 years, the increase has totaled 61.2 percent (the 1996 ED visit estimate was 90.3 million). The past 15 years of volume estimates appear in Table 1.
These data may not match the experience in every emergency department and every community. First, the CDC typically estimates the lowest volume of ED visits, and the NHAMCS does not include visits to freestanding emergency departments. Second, there are changing patterns of ED use based on community sources of unscheduled care. Third, the patchwork of primary care systems in the country influences the number of ED visits locally.

(click for larger image) Table 1: Estimated Annual ED Visits
What is apparent from the CDC data is that the trend of emergency departments seeing older, sicker patients, combined with continued growth in retail clinics, telehealth, and other sources of care for nonemergent problems, will yield a net increase in the average severity and complexity of patients seen in full-service emergency departments.
Who Are the Patients?
ED visits increased from 369 to 458 visits per 1,000 people between 1995 and 2016. High utilizers continue to include infants, nursing home residents, the homeless, black persons, and people over age 75.
Infants under age 1 had 987 visits per 1,000 persons. This is relatively high utilization and represents an opportunity for parent education.
There were roughly 2.2 million visits for patients who reside in nursing homes, for a utilization of 1,594 visits per 1,000 residents. Approximately 33 percent of nursing home patient ED visits resulted in hospital admission (739,000), with an average length of hospital stay of 5.7 days.
Persons classified as homeless represented a larger visit load for EDs compared with prior years. In 2016, homeless persons accounted for an estimated 1,446,000 visits, a rate of 2,630 visits per 1,000 estimated number of homeless persons. Those visits equal roughly 1 percent of total ED visits.
The CDC also categorized visit rates for white, black, Hispanic, and other races/ethnicities. The visit rate was 435 visits per 1,000 white people, 404 visits per 1,000 Hispanics, and 804 visits per 1,000 black people. The visit rate was 172 visits per 1,000 persons of other races (ie, Asian, native Hawaiian or other Pacific Islander, American Indian or Alaska native, and persons with more than one race).
The ED population is aging in line with national demographics. Persons over age 65 accounted for 15.8 percent of ED visits, and persons age 75 and older had 605 visits per 1,000 in 2016. Thus, emergency departments must prepare for larger numbers of patients and develop processes tailored to older persons. In addition, older patients require more workup, treatment, and, thus, more time in the department.
Finally, because older patients are admitted to the hospital more often, they spend more time as ED boarders. Planning for new or renovating old emergency departments should account for these shifting demographics.
Pages: 1 2 3 | Single Page
Topics: Centers for Disease Control and Prevention Emergency Department Benchmarking Alliance Utilization

A Sobering Year for Emergency Departments and Their Patients

A First Look at Emergency Department Data for 2022

Emergency Department Patient Challenges to Come
Current issue.
ACEP Now: Vol 43 – No 04 – April 2024
Download PDF
About the Author

James J. Augustine, MD, FACEP
James J. Augustine, MD, FACEP, is national director of prehospital strategy for US Acute Care Solutions in Canton, Ohio; clinical professor of emergency medicine at Wright State University in Dayton, Ohio; and vice president of the Emergency Department Benchmarking Alliance.
View this author's posts »
No Responses to “The Latest Emergency Department Utilization Numbers Are In”
Leave a Reply Cancel Reply
Your email address will not be published. Required fields are marked *

Call for a Quote 833-567-4268
Emergency Department Visits Show How Divided Americans Are by Health Insurance
By Dan Grunebaum Data Journalist

Dan Grunebaum Data Journalist
Dan Grunebaum is a data journalist and visualization developer for HealthCare.com. Dan has experience with surprise medical bills and seeks to bring clarity to the healthcare conversation.
In this Article
We want to help you make educated healthcare decisions. While this post may have links to lead generation forms, this won’t influence our writing. We adhere to strict editorial standards to provide the most accurate and unbiased information.
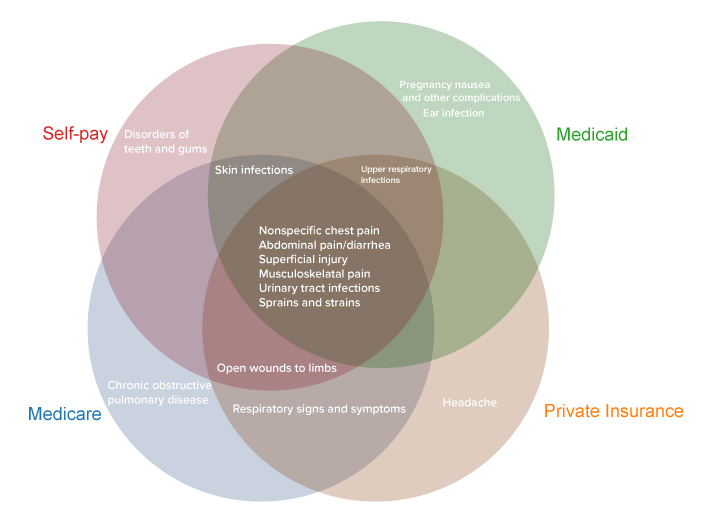
Top Diagnoses by Payer Among Emergency Department Visits (Treat-and-Release)
Key takeaways
- Americans made 143.5 million visits to emergency departments in 2018, 439 visits per 1,000 people
- The most common treat-and-release ED visits were for abdominal pain, respiratory infection, and chest pain
- Among the 15 top treat-and-release diagnoses, the 4 payer types (Medicare, Medicaid, private, self-pay) have in common just 6
- The average cost of an ED visit by payer is: $660 (Medicare), $560 (private insurance), ($460) self-pay, and $420 (Medicaid)
- Americans in the lowest income quartile visit EDs at a rate of 641 per 1000, compared to 281 per 1000 for the highest income quartile
- ED visits by privately insured and self-pay Americans declined over time (2009-2018), while visits by people with Medicare and Medicaid grew
Americans with different kinds of health insurance visit emergency departments for different reasons. A HealthCare.com analysis of federal data shows that, among the 15 top conditions behind treat-and-release visits, the four main payer types (private insurance, self-pay, Medicare, Medicaid) have in common just six conditions.
The above figure shows the six conditions are:
- Nonspecific chest pain
- Abdominal pain/diarrhea
- Superficial injury
- Musculoskeletal pain
- Urinary tract infections
- Sprains and strains
At the same time, five conditions behind treat-and-release ED visits are among the top 15 for only one payer type.
- Headaches are among the top 15 for people with private insurance
- Teeth and gum disorders are among the top 15 for self-payers
- Chronic obstructive pulmonary disease is among the top 15 for people on Medicare
- Pregnancy nausea and ear infections are among the top 15 for people on Medicaid
For all payers, abdominal pain was either the first (for private insurance and self-pay/no charge) or the second (for Medicare and Medicaid) most common condition.
The different attributes of each payer group account for the differing mix of conditions that bring them to emergency departments. Amy Faith Ho , an emergency medicine physician and nationally-published writer, says each group represents a different population. “For example, with Medicare, if you’re an older patient you’re going to come in more with diagnoses associated with getting older,” she explains. “You’re going to see a lot more strokes and urinary infections, but fewer motorcycle accidents and that sort of thing.”
Medicaid tends to represent younger groups and can be heavily pediatric, Ho says, “So you’ll see a lot of kid viruses, and pregnant mothers with pregnancy-related complaints.”
On the other hand, self-payers are often low-income, and may not have the wherewithal to visit dentists regularly. “Perhaps self-pay patients wait until they are really sick to go to the ER,” Ho says. “It makes sense that dental complaints would rank higher for self-paid emergency care visits.” Self-payers, who are mostly uninsured, may not be getting regular dental care.
Emergency Department Visits Nationwide
In 2018, U.S. hospitals saw 143.5 million emergency department (ED) visits, representing 439 visits per 1,000 population. 14% of ED visits resulted in hospital admission (61 per 1,000 population). The majority of ED visits (86%) resulted in treatment and release.
Among all diagnoses with the highest number of treat-and-release ED visits, the below figure shows the top 10.
Top 10 Treat-and-Release Emergency Department Visits (Millions)
Emergency department visits by cost and income level .
The cost of a trip to the emergency department differs significantly depending on what kind of health insurance a person has.
At $420, Medicaid recipients’ ED visits have the lowest average cost, another government brief shows.
Self-payers are next at $460, followed by people on private insurance at $560 per emergency department visit.
At an average of $660, Medicare recipients’ ED visits are the most pricey.
Low-income people, many of whom are Medicaid recipients, are much more likely to visit emergency departments than high-income people.
Americans in the lowest income quartile visit EDs at a rate of 641 per 1000 people, compared to just 281 per 1000 people for the highest income quartile.
The low cost of Medicaid and self-pay Americans’ ED visits may be linked to the higher likelihood of them visiting EDs for less serious conditions like earaches, pregnancy nausea, and dental issues.
It’s also the case, Ho says, that the cost of ED visits reflects the negotiating power of the payer. Large government programs like Medicare and Medicaid are known for negotiating lower prices with healthcare providers.
In terms of outcomes, research shows that emergency departments are an area where folks who don’t have insurance will be at greater risk for financial strain and for putting off critical care.
“We know that expanding health insurance leads to better health and financial security for families,” Ben Sommers, Deputy Assistant Secretary at the U.S. Department of Health and Human Services, told HealthCare.com.
“The emergency department is one area where disparities can show up prominently. That’s why the department’s focus has been making sure that we have as good coverage and access as we can, and we’ve seen that in near historic lows in the uninsured rate in the past year, and the record high of people enrolled in Affordable Care Act coverage and Medicaid. If you don’t have coverage you’ll face big bills and risk not getting the care you need.”
In peer countries with single-payer healthcare systems like Canada or Japan, such coverage and cost disparities do not exist, for the simple reason that there is only one payer.
“The emergency department is one area where disparities can show up prominently…If you don’t have coverage, you’ll face big bills and risk not getting the care you need.” Ben Sommers, Deputy Assistant Secretary, Department of Health and Human Services
Use the interactive data visualization below to search emergency department costs for your demographic.
The Cost of Emergency Department Visits
Emergency department visits over time.
Over the last decade for which data is available (2009-2018), emergency department visits by privately insured and uninsured (self-pay) people have declined, while visits by people with Medicare and Medicaid have risen.
This tracks with the overall growth of the Medicare and Medicaid programs during that timeframe.
In particular, the proportion of visits by self-payers dropped between 2013 and 2015, coinciding with the large reduction in the uninsured rate nationally under the Affordable Care Act during that period.
“The Medicaid expansion has shifted people away from being uninsured to being covered by Medicaid,” Sommers says. “So what you’re seeing is a result of the major changes brought by the Affordable Care Act over time.”
The rise of urgent care and retail clinics in recent years brought hopes for an easing of expensive emergency department visits. But the dividend hasn’t materialized. A Report to Congress says that “thus far, these care settings do not appear to have resulted in a reduction in the national rate of ED visits.”
Doctor Ho says that, after spiking during the early part of the covid pandemic, emergency departments are no longer jam-packed. “I don’t think EDs are overwhelmed anymore,” she says. “Nationally, volume is actually down a bit. There are a lot of places in the U.S. that are seeing very little covid, that are back to the usual mix of patients and diagnoses.”
For the foreseeable future, it looks like Americans will continue to utilize emergency departments for medical issues that could be resolved more cheaply by primary care physicians, or at urgent care centers. And the conditions for which they tend to visit EDs, and the cost and volume of their visits, will continue to break down along the lines of the nation’s Balkanized health insurance landscape.
Emergency Department Visits by Payer over Time
- Thanks for your feedback! | Sign up for our HealthCare newsletter, and receive useful Health Care related information.
- Hard To Understand
- Tell us a little bit more
- Enter your email
Share this article
About dan grunebaum, related articles.

Understanding Qualifying Life Events in Health Insurance
Life can throw you curveballs sometimes, but there’s a way to get...
April 11th, 2024

A Guide to Medicaid Eligibility for Non-U.S. Citizens
Living in the United States but not a citizen? Are you wondering...
April 4th, 2024

A Guide to Navigating Employer-Sponsored Health Insurance
Understanding Your Job’s Health Insurance Choosing health insurance can be tricky, especially...
We do not sell insurance products, but there may be forms that will connect you with partners of healthcare.com who do sell insurance products. You may submit your information through this form, or call 855-617-1871 to speak directly with licensed enrollers who will provide advice specific to your situation. Read about your data and privacy .
Our mission is to provide information that will help everyday people make better decisions about buying and keeping their health coverage. Our editorial staff is comprised of industry professionals and experts on the ACA, private health insurance markets, and government policy. Learn more about our content .
The independent source for health policy research, polling, and news.
Providers & Service Use
This category includes data on health care facilities, including hospitals, nursing homes, community health centers, and rural health centers, and the health care workforce, such as physicians, nurse practitioners, physician assistants, and dentists. Data on access to care and health professional shortage areas are also included in this category.
Select an indicator below to view state data. Results will be shown as a table, map, or trend graph, as available. To compile data from multiple indicators for one or more states, build a Custom State Report.
Refine Results
Categories& subcategories, hospital utilization, nursing facilities, nurse practitioners and physician assistants, critical care workforce, access to care, substance use and mental health treatment facilities, rural health clinics, community health centers, health professional shortage areas, health care employment, medical school graduates, providers & service use indicators.
- Total Hospitals
- Hospitals by Ownership Type
- Total Hospital Beds
- Hospital Beds per 1,000 Population by Ownership Type
- Hospital Admissions per 1,000 Population by Ownership Type
- Hospital Emergency Room Visits per 1,000 Population by Ownership Type
- Hospital Inpatient Days per 1,000 Population by Ownership Type
- Hospital Outpatient Visits per 1,000 Population by Ownership Type
- Total Number of Certified Nursing Facilities
- Total Number of Residents in Certified Nursing Facilities
- Average Number of Certified Nursing Facility Beds
- Average Reported Nurse Hours per Resident Day in All Certified Nursing Facilities
- Distribution of Certified Nursing Facilities by Ownership Type
- Distribution of Certified Nursing Facilities by Certification Type
- Distribution of Certified Nursing Facility Residents by Primary Payer Source
- Distribution of Certified Nursing Facilities by Chain-Owned Affiliation
- Distribution of Certified Nursing Facilities by Hospital-Based Status
- Certified Nursing Facility Occupancy Rate
- Percent of Certified Nursing Facilities with Resident Groups and Family Groups
- Average Number of Deficiencies per Certified Nursing Facility
- Percent of Certified Nursing Facilities Receiving a Deficiency for Actual Harm or Jeopardy
- Percent of Certified Nursing Facilities with Civil Monetary Penalties
- Percent of Certified Nursing Facilities with Deficiencies
- Percent of Certified Nursing Facilities with Top Ten Deficiencies
- Professionally Active Physicians
- Professionally Active Physicians by Gender
- Professionally Active Primary Care Physicians by Field
- Professionally Active Specialist Physicians by Field
- Total Number of Nurse Practitioners
- Total Number of Nurse Practitioners, by Gender
- Total Number of Physician Assistants
- Total Number of Physician Assistants, by Gender
- Nurse Practitioner Scope of Practice Laws
- Physician Assistant Scope of Practice Laws
- Intensivist Physicians, Critical Care Nurses, and Second-line Critical Care Physicians per 10,000 Adults
- Professionally Active Dentists
- Professionally Active Dentists by Gender
- Professionally Active Dentists by Specialty Field
- Adults Who Report Not Seeing a Doctor in the Past 12 Months Because of Cost by Sex
- Adults Who Report Not Seeing a Doctor in the Past 12 Months Because of Cost by Race/Ethnicity
- Adults Who Report Not Having a Personal Doctor/Health Care Provider by Sex
- Adults Who Report Not Having a Personal Doctor/Health Care Provider by Race/Ethnicity
- Adults Reporting Unmet Need for Mental Health Treatment in the Past Year
- Percent of Children with a Medical Home
- Percent of Children Whose Family Members Avoiding Changing Jobs Due to Concerns About Maintaining Health Insurance in Past 12 Months
- Percent of Children Whose Families Had Trouble Paying Bills for Child’s Medical or Health Care Bills in Past 12 Months
- Percent of Children Who Needed Health Care but Did Not Receive it in Past 12 Months
- Percent of Children (Ages 3-17) Who Faced Difficulties Obtaining Mental Health Care
- Percent of Children (ages 3-17) Who Received Any Treatment or Counseling from a Mental Health Professional
- Percent of Children (ages 0-17) Who had Both a Medical and Dental Preventive Care Visit in the Past 12 Months
- Number of Substance Use Treatment Facilities, By Type of Care
- Count and Rate per 100,000 of Substance Use Treatment Facility Beds, By Type
- Percent of Substance Use Treatment Facilities Reporting Participation with Insurers
- Distribution of Substance Use Treatment Facilities, By Ownership Type
- Number of Mental Health Treatment Facilities, By Type of Care
- Count and Rate per 100,000 of Mental Health Treatment Facility Beds, By Type
- Percent of Mental Health Treatment Facilities Reporting Participation with Insurers
- Distribution of Mental Health Treatment Facilities, By Ownership Type
- Number of Medicare Certified Rural Health Clinics
- Community Health Center Delivery Sites and Patient Visits
- Community Health Center Patients by Payer Source
- Community Health Center Revenues by Payer Source
- Primary Care Health Professional Shortage Areas (HPSAs)
- Dental Care Health Professional Shortage Areas (HPSAs)
- Mental Health Care Health Professional Shortage Areas (HPSAs)
- Total Health Care Employment
- Health Care Employment as a Percent of Total Employment
- Total Number of Medical School Graduates
- Distribution of Allopathic Medical School Graduates by Gender
- Distribution of Osteopathic Medical School Graduates by Gender
- Distribution of Allopathic Medical School Graduates by Race/Ethnicity
- Distribution of Osteopathic Medical School Graduates by Race/Ethnicity
- Collections
- Recent Additions
- Coming Soon
- Content and Copyright
- Public Access Policy
- home CDC Stacks
Emergency department visit rates by adults with diabetes : United States, 2020–2021
Search our Collections & Repository
- Advanced Search
- Custom Query
All these words:
For very narrow results
This exact word or phrase:
When looking for a specific result
Any of these words:
Best used for discovery & interchangable words
None of these words:
Recommended to be used in conjunction with other fields
Publication Date Range:
Document Type:
Collection:
Query Builder
For additional assistance using the Custom Query please check out our Help Page
- Series: NCHS data brief ; no 487
- Personal Author: Santo, Loredana ; Schappert, Susan M. ; Ashman, Jill J. Santo, Loredana ; Schappert, Susan M. ; Ashman, Jill J. Less -
- Corporate Authors: National Center for Health Statistics (U.S.)
- Description: In 2021, diabetes was the eighth leading cause of death in the United States (1). Over 37 million Americans have diabetes (2). While it most often develops in people older than age 45 (3), its frequency is increasing in young adults (4). Among people with diabetes, increasing age is a risk factor for hospitalization (5). Emergency department (ED) visits by people with diabetes have been used to monitor access to care and healthcare use (6). This report describes ED visits made by adults with diabetes, and presents selected characteristics by age. Key findings Data from the National Hospital Ambulatory Medical Care Survey ● In 2020–2021, the emergency department visit rate by adults with diabetes was 72.2 visits per 1,000 adults, and the rate increased with age. ● Emergency department visit rates by adults with diabetes were highest among Black non-Hispanic people (136.6 visits per 1,000 adults per year) and higher among White non-Hispanic people (69.9) compared with Hispanic people (52.3). ● In 2020–2021, the emergency department visit rate by adults with diabetes and two to four other chronic conditions was 541.4 per 1,000 adults per year and increased with age. ● Emergency department visit rates by adults with diabetes increased from 48.6 visits per 1,000 adults in 2012 to 74.9 visits per 1,000 adults in 2021. More ▼ -->
- Subjects: [+] Diabetes Mellitus/epidemiology Emergency Room Visits Emergency Service, Hospital Humans Middle Aged Risk Factors Young Adult
- Document Type: Journal Issue
- Name as Subject: National Hospital Ambulatory Medical Care Survey (U.S.)
- Place as Subject: United States
- Collection(s): Stephen B. Thacker CDC Library collection
- Main Document Checksum: [+] urn:sha256:408b7208f88c7adf2027584570e4dea2cfaffa95bebba2885ef4137ce6304f91
- Download URL: https://stacks.cdc.gov/view/cdc/134505/cdc_134505_DS1.pdf
Supporting Files
You may also like.
Checkout today's featured content at stacks.cdc.gov
Exit Notification/Disclaimer Policy
- The Centers for Disease Control and Prevention (CDC) cannot attest to the accuracy of a non-federal website.
- Linking to a non-federal Website does not constitute an endorsement by CDC or any of its employees of the sponsors or the information and products presented on the website.
- You will be subject to the destination website's privacy policy when you follow the link.
- CDC is not responsible for Section 508 compliance (accessibility) on other federal or private websites.
Have Questions?
Call 800-232-4636
CDC INFORMATION
- File Viewers & Players
- Other Languages
- No Fear Act
- Nondiscrimination
- Accessibility
- Vulnerability Disclosure Policy
CONNECT WITH CDC
- Alzheimer's disease & dementia
- Arthritis & Rheumatism
- Attention deficit disorders
- Autism spectrum disorders
- Biomedical technology
- Diseases, Conditions, Syndromes
- Endocrinology & Metabolism
- Gastroenterology
- Gerontology & Geriatrics
- Health informatics
- Inflammatory disorders
- Medical economics
- Medical research
- Medications
- Neuroscience
- Obstetrics & gynaecology
- Oncology & Cancer
- Ophthalmology
- Overweight & Obesity
- Parkinson's & Movement disorders
- Psychology & Psychiatry
- Radiology & Imaging
- Sleep disorders
- Sports medicine & Kinesiology
- Vaccination
- Breast cancer
- Cardiovascular disease
- Chronic obstructive pulmonary disease
- Colon cancer
- Coronary artery disease
- Heart attack
- Heart disease
- High blood pressure
- Kidney disease
- Lung cancer
- Multiple sclerosis
- Myocardial infarction
- Ovarian cancer
- Post traumatic stress disorder
- Rheumatoid arthritis
- Schizophrenia
- Skin cancer
- Type 2 diabetes
- Full List »
share this!
October 13, 2023
This article has been reviewed according to Science X's editorial process and policies . Editors have highlighted the following attributes while ensuring the content's credibility:
fact-checked
reputable news agency
Emergency department visit rate for assault, 4.5 visits per 1,000 people per year
by Elana Gotkine

The emergency department visit rate for assault was 4.5 visits per 1,000 people per year during 2019 to 2021, according to an October data brief published by the U.S. Centers for Disease Control and Prevention National Center for Health Statistics.
Danielle Davis, M.P.H., and Loredana Santo, M.D., M.P.H., from the National Center for Health Statistics in Hyattsville, Maryland, present assault-related emergency department visit (excluding sexual assault ) rates by selected demographic and hospital characteristics using data from the National Hospital Ambulatory Medical Care Survey (NHAMCS).
The researchers found that the overall emergency department visit rate for assault was 4.5 visits per 1,000 people per year during 2019 to 2021, with the highest rates seen for those aged 18 to 24 and 25 to 44 years (9.2 and 7.7, respectively), which declined with age.
Compared with all other race and ethnicity groups, the emergency department visit rate for assault was highest for Black non-Hispanic people. For people injured by assault, Medicaid, Children's Health Insurance Program, or other state-based program was the most common primary expected source of payment for emergency department visits. People who visited hospitals in metropolitan statistical areas had a higher emergency department visit rate for assault than nonmetropolitan statistical areas (4.9 versus 2.0).
"This report, based on the most recent estimates from NHAMCS on emergency department visits made by people with injuries related to assault , highlights differences in emergency department use by demographic and hospital characteristics," the authors write.
Copyright © 2023 HealthDay . All rights reserved.
Explore further
Feedback to editors

Researchers identify targets in the brain to modulate heart rate and treat depressive disorders
3 hours ago

Robotic nerve 'cuffs' could help treat a range of neurological conditions

Many children with symptoms of brain injuries and concussions are missing out on vital checks, national study finds
8 hours ago

Living at higher altitudes in India linked to increased risk of childhood stunting
14 hours ago

Study confirms effectiveness of bivalent COVID-19 vaccine
16 hours ago

How does aging start? Scientists explain how IgG antibodies are a driving factor

Study reveals emotional turmoil experienced after dog-theft is like that of a caregiver losing a child

Targeting specific protein regions offers a new treatment approach in medulloblastoma
17 hours ago

Study recommends exposing deaf children to sign language before and after cochlear implantation

Study reveals racial disparities in COVID-19 testing delays among health care workers
Related stories.

Young adults, Black Americans most likely to visit ER for assault injuries
Oct 12, 2023

Rate of opioid Rx at discharge from emergency department declining
Jan 20, 2023

Non-hispanic blacks have highest rate of mental health emergency visits
Mar 3, 2023

2019 to 2020 saw decrease in pediatric emergency visit rate
Jun 7, 2023

More emergency visits for assault, self-harm reported for incarcerated adults
Mar 17, 2023

Analysis of assault-related injury visits to emergency departments
May 12, 2022
Recommended for you

Using AI to improve diagnosis of rare genetic disorders
23 hours ago

Researchers create an AI-powered digital imaging system to speed up cancer biopsy results
22 hours ago

Research identifies pitfalls and opportunities for generative AI in patient messaging systems
Apr 24, 2024

New algorithm could provide early warning for asthma attacks

Study finds AI can develop treatments to prevent 'superbugs'

New study uses AI to predict malaria outbreaks in South Asia
Let us know if there is a problem with our content.
Use this form if you have come across a typo, inaccuracy or would like to send an edit request for the content on this page. For general inquiries, please use our contact form . For general feedback, use the public comments section below (please adhere to guidelines ).
Please select the most appropriate category to facilitate processing of your request
Thank you for taking time to provide your feedback to the editors.
Your feedback is important to us. However, we do not guarantee individual replies due to the high volume of messages.
E-mail the story
Your email address is used only to let the recipient know who sent the email. Neither your address nor the recipient's address will be used for any other purpose. The information you enter will appear in your e-mail message and is not retained by Medical Xpress in any form.
Newsletter sign up
Get weekly and/or daily updates delivered to your inbox. You can unsubscribe at any time and we'll never share your details to third parties.
More information Privacy policy
Donate and enjoy an ad-free experience
We keep our content available to everyone. Consider supporting Science X's mission by getting a premium account.
E-mail newsletter
- Share full article
Advertisement
Supported by
Heat-Related E.R. Visits Rose in 2023, C.D.C. Study Finds

By Noah Weiland
Reporting from Washington
The rate of emergency room visits caused by heat illness increased significantly last year in large swaths of the country compared with the previous five years, according to a study published on Thursday by the Centers for Disease Control and Prevention.
The research, which analyzed visits during the warmer months of the year, offers new insight into the medical consequences of the record-breaking heat recorded across the country in 2023 as sweltering temperatures stretched late into the year.

What the Numbers Say: People in the South were especially affected by serious heat illness.
The researchers used data on emergency room visits from an electronic surveillance program used by states and the federal government to detect the spread of diseases. They compiled the number of heat-related emergency room visits in different regions of the country and compared them to data from the previous five years.
Nearly 120,000 heat-related emergency room visits were recorded in the surveillance program last year, with more than 90 percent of them occurring between May and September, the researchers found.
The highest rate of visits occurred in a region encompassing Arkansas, Louisiana, New Mexico, Oklahoma and Texas. Overall, the study also found that men and people between the ages of 18 and 64 had higher rates of visits.
How It Happens: Heat can be a silent killer, experts and health providers say.
Last year was the warmest on Earth in a century and a half, with the hottest summer on record . Climate scientists have attributed the trend in part to greenhouse gas emissions and their effects on global warming, and they have warned that the timing of a shift in tropical weather patterns last year could foreshadow an even hotter 2024.
Heat illness often occurs gradually over the course of hours, and it can cause major damage to the body’s organs . Early symptoms of heat illness can include fatigue, dehydration, nausea, headache, increased heart rate and muscle spasms.
People do not typically think of themselves as at high risk of succumbing to heat or at greater risk than they once were, causing them to underestimate how a heat wave could lead them to the emergency room, said Kristie L. Ebi, a professor at the University of Washington who is an expert on the health risks of extreme heat.
“The heat you were asked to manage 10 years ago is not the heat you’re being asked to manage today,” she said. One of the first symptoms of heat illness can be confusion, she added, making it harder for someone to respond without help from others.
What Happens Next: States and hospitals are gearing up for another summer of extreme heat.
Dr. Srikanth Paladugu, an epidemiologist at the New Mexico Department of Health, said the state had nearly 450 heat-related emergency room visits in July last year alone and over 900 between April and September, more than double the number recorded during that stretch in 2019.
In preparation for this year’s warmer months, state officials are working to coordinate cooling shelters and areas where people can be splashed by water, Dr. Paladugu said.
Dr. Aneesh Narang, an emergency medicine physician at Banner-University Medical Center in Phoenix, said he often saw roughly half a dozen heat stroke cases a day last summer, including patients with body temperatures of 106 or 107 degrees. Heat illness patients require enormous resources, he added, including ice packs, fans, misters and cooling blankets.
“There’s so much that has to happen in the first few minutes to give that patient a chance for survival,” he said.
Dr. Narang said hospital employees had already begun evaluating protocols and working to ensure that there are enough supplies to contend with the expected number of heat illness patients this year.
“Every year now we’re doing this earlier and earlier,” he said. “We know that the chances are it’s going to be the same or worse.”
Noah Weiland writes about health care for The Times. More about Noah Weiland
Explore Our Weather Coverage
Extreme Weather Maps: Track the possibility of extreme weather in the places that are important to you .
Tornado Alerts: A tornado warning demands instant action. Here’s what to do if one comes your way .
Climate Change: What’s causing global warming? How can we fix it? Our F.A.Q. tackles your climate questions big and small .
Evacuating Pets: When disaster strikes, household pets’ lives are among the most vulnerable. You can avoid the worst by planning ahead .
IMAGES
VIDEO
COMMENTS
Providers & Service Use. Hospital Utilization. Hospital Emergency Room Visits per 1,000….
Number of visits per 100 persons: 42.7. Number of emergency department visits resulting in hospital admission: 18.3 million. Number of emergency department visits resulting in admission to critical care unit: 2.8 million. Percent of visits with patient seen in fewer than 15 minutes: 41.8%. Percent of visits resulting in hospital admission: 13.1%.
This visualization depicts both counts and rates of emergency department visits from 2016-2021 for the 10 leading primary diagnoses and reasons for visit, stratified by selected patient and hospital characteristics. Rankings for the 10 leading categories were identified using weighted data from 2021 and were then assessed in prior years ...
The total ED visit rate was 43 visits per 100 people in 2021 (Figure 1). The ED visit rate was highest for infants under age 1 year (103 visits per 100 infants), followed by adults aged 75 and over (66 visits per 100 people). These rates were higher than for all other age groups. 1Significantly different from all other age groups.
Admits per 1,000 is a calculation that multiplies the number of patients admitted to a hospital by 1,000 and divides that total by the number of people who visited the hospital. This data point carries significant implications for modern healthcare providers and is widely utilized today. ... With a total of 140-plus million hospital visits each ...
Assesses emergency department (ED) utilization among commercial (18 and older) and Medicare (18 and older) health plan members. Plans report observed rates of ED use and a predicted rate of ED use based on the health of the member population. The observed and expected rates are used to calculate a calibrated observed-to-expected ratio that ...
Highlights. In 2018, there were 143.5 million emergency department (ED) visits, representing 439 visits per 1,000 population. Fourteen percent of ED visits resulted in hospital admission (61 per 1,000 population). Circulatory and digestive system conditions were the most common reasons for these visits. The majority of ED visits (86 percent ...
Here are ER visit per 1,000 population in all 50 states and the District of Columbia in 2017 (the most recent data available): Note: The list includes ties and results in a numerical listing of 45. 1.
Emergency room visits per 1000 in 2013 and 2014 were 251.8 and 219.9, respectively, whereas in 2015, 2016, and 2017, emergency room visits per 1000 plan members decreased to 191.3, 187.5, and 187.3, respectively (P<.05). In summary, hospitalizations and emergency room visit rates per 1000 decreased 32% (26.5/82.4) and 14% (31.3/219.9 ...
The Numbers. ED visit estimates increased from 136.9 million in 2015 to 145.6 million in 2016, a jump of 6.4 percent. The 10-year volume change is 24.7 percent, and for the past 20 years, the increase has totaled 61.2 percent (the 1996 ED visit estimate was 90.3 million). The past 15 years of volume estimates appear in Table 1.
The majority of ED visits (86 percent) resulted in treatment and release (378 per 1,000 population). The two most common general reasons for these visits were (1) injuries and poisonings and (2) symptoms, signs, and abnormal findings. The most common specific reasons for treat-and-release ED visits were abdominal pain, acute upper respiratory ...
In both 2006 and 2014, patients aged 65 years and older had the highest rate of ED visits (543.7 and 538.3 per 1,000 population, respectively). However, patients aged 45-64 years had the largest increase in rate of ED visits, from 330.4 visits per 1,000 population in 2006 to 387.9 visits per 1,000 population in 2014—an increase of 17.4 percent.
Avoidable emergency department visits were lower in value-based care than in fee-for-service as well, with 21 visits per 1,000 beneficiaries in the former models and 26.8 in the second model.
NCHS Data Brief No. 452 November 2022 2 The ED visit rates for infants under age 1 year (68 visits per 100 infants) and adults aged 75 and over (63 visits per 100 people) were higher compared with all other age groups. The ED visit rate for children aged 1-17 years (29 visits per 100 children) was lower than the rates for all adult age groups.
Americans made 143.5 million visits to emergency departments in 2018, 439 visits per 1,000 people. The most common treat-and-release ED visits were for abdominal pain, respiratory infection, and chest pain. Among the 15 top treat-and-release diagnoses, the 4 payer types (Medicare, Medicaid, private, self-pay) have in common just 6.
Hospital Emergency Room Visits per 1,000 Population by Ownership Type; Hospital Inpatient Days per 1,000 Population by Ownership Type; Hospital Outpatient Visits per 1,000 Population by Ownership Type
ED visits per 1000 member months Focus: Concentrate on ambulatory management of chronic disease, right care at the right place, right time, and connected to care ... to the emergency room but visit to your primary care doctor. As an added benefit, we now provide you with year -round 24/7 access to doctors and
The rate fluctuated between 53,537 and 55,092 from 2006 to 2014, and in 2015, the rate reached 56,803. For patients aged 18-44 years, the ED visit rate per 100,000 population was the second highest of all age groups each year. It increased by 9 percent, from 43,252 in 2006 to 47,022 in 2015.
In 2020-2021, the emergency department visit rate by adults with diabetes and two to four other chronic conditions was 541.4 per 1,000 adults per year and increased with age. Emergency department visit rates by adults with diabetes increased from 48.6 visits per 1,000 adults in 2012 to 74.9 visits per 1,000 adults in 2021.
was 541.4 per 1,000 adults per year and increased with age. Emergency department visit rates by adults with diabetes increased from 48.6 visits per 1,000 adults in 2012 to 74.9 visits per 1,000 adults in 2021. In 2021, diabetes was the eighth leading cause of death in the United States (1). Over 37 million Americans have diabetes (2). While it ...
The researchers found that the emergency department visit rate by adults with diabetes was 72.2 per 1,000 adults in 2020 to 2021, and the rate increased with age. The highest emergency department ...
The researchers found that the overall emergency department visit rate for assault was 4.5 visits per 1,000 people per year during 2019 to 2021, with the highest rates seen for those aged 18 to 24 ...
In 2011, rates of ED visits varied by the patient's sex, age group, residence, and hospital region (Figure 1). Highlights. In 2011, there were about 421 visits to the emergency department (ED) for every 1,000 individuals in the population. More than five times as many individuals who visited an ED were discharged as were admitted to the same ...
Dr. Srikanth Paladugu, an epidemiologist at the New Mexico Department of Health, said the state had nearly 450 heat-related emergency room visits in July last year alone and over 900 between April ...