- For Small Business

What is the Average Time Spent on a Website in 2024? A Deep Dive into User Engagement
- November 26, 2023
- by Tom Wells

As a consultant dedicated to helping small businesses succeed online, website engagement metrics are vital indicators I analyze. The average time spent on a website offers a goldmine of insights into user behavior and website performance. This data reveals what‘s working and what‘s not, guiding impactful optimization.
In this article, we‘ll explore the latest time spent statistics that I reference in 2024 when consulting small business clients on strategies to boost their website engagement.
The Magic Number: 45-54 Seconds
Industry research conducted in 2024 reveals that the average time spent on a website is 45-54 seconds. For small business owners getting started with their digital presence, this core statistic highlights the delicate balance between grabbing user attention fast while still providing a satisfying experience.
Moreover, this number varies based on the website type, device used, and other elements we will cover in this article. As a consultant, I always emphasize to clients that the time spent metric offers a snapshot, not an absolute value. Optimization should focus on understanding user behavior patterns, not just increasing this average duration.
Average Time Spent Across Industries
While 45-54 seconds is the aggregate average, duration fluctuates across industries. Based on studies by SimilarWeb Pro in 2024, here are some variations:
- Retail sites: 1 min 20 sec
- Finance sites: 1 min 15 sec
- Travel sites: 2 min 30 sec
- Gaming sites: 4 min
As evidenced, shopping, banking, and travel sites demand more time for browsing and decision-making. Gaming sites unsurprisingly lead with extended engagement.
For small business owners, benchmarking against their industry average provides an indicative goal to aim for. The more niche their content, the longer users need to absorb information.
E-Commerce Sites Have 3 Min 44 Sec Average
Based on research by Littledata, e-commerce websites have a substantially higher average time spent of 3 minutes 44 seconds. Online shopping requires extended browsing across products, detailed comparisons, reading descriptions, and considered purchase decisions.
For small e-commerce business owners, this average pinpoints the need to optimize user experience for sustained engagement during the shopping journey. Easy navigation, intuitive categorization, zoom and rotate functions for products, high-res imagery, detailed specs, seamless checkout, and personalized recommendations are some of the features that can enhance and extend shopping time.
Time Spent Varies Across Website Types
While e-commerce leads for obvious reasons, visit duration also fluctuates across other website categories:
- News sites : 2 min 30 sec
- Blogs : 2 min 15 sec
- Social media : Over 10 min
As a consultant, I point out to clients that the in-depth, constantly updated content on news and blog sites naturally leads to higher engagement. For social platforms, the personalized, interactive nature keeps users hooked.
These benchmarks help small business owners set targets for their own sites based on their niche and purpose. For example, a travel blog would aim higher than an attorney‘s website.
6 Crucial Factors That Impact Time on Site
Many elements influence the time visitors spend on a website. Based on my consulting experience, these six factors have proven to be most crucial:
1. Site Design and User Experience
An intuitive, user-friendly site layout and seamless UX results in longer visits. Easy navigation, visual appeal, mobile responsiveness, fast page loads under 3 seconds, and accessibility features enhance user experience.
2. Quality and Relevance of Content
High-quality content tailored to audience needs drives engagement. Well-researched, insightful content establishes subject matter expertise.
3. Website Speed and Performance
Faster page load speeds consistently lead to longer time on site and lower bounce rates. Quick-loading sites minimize user frustration.
4. Use of Videos
Pages with videos average 6 minutes in visit duration – 88% more than pages without video. Interactive content like video boosts engagement.
5. Clear Value Proposition
Conveying core value upfront aligns user expectations, prompting extended site exploration.
6. Compelling Call-to-Action (CTA)
Strategic CTAs motivate desired actions, further engaging visitors. Ensure they stand out and offer value.
Recommendations for Small Business Owners
For my small business clients, I map their current website performance against these six factors to identify optimization areas. The priorities are fixing technical issues like site speed and maximizing content quality and relevance. Small tweaks can collectively amplify engagement.
More Revealing Website Engagement Stats
Along with average visit duration, other metrics provide insights into user interactions. Here are some key ones I analyze:
- 15% : Average conversion rate for email collection forms (HubSpot)
- 3.5% : E-commerce conversion rate from mobile visits (Statista)
- 40% : Visitors who will abandon a site taking over 3 seconds to load (Forbes)
- 10x : Increase in time spent by adding videos to pages (Forbes)
These benchmarks help set targets for lead generation, mobile optimization, site speed, and content strategy.
Social Media Outperforms on Engagement
Users spend an average of over 10 minutes on social platforms, making them prime avenues for engagement.
- Facebook leads social media usage, making it the #1 channel for content distribution.
- Instagram follows as the second best platform for marketers with high engagement levels.
- Twitter has 319 million active monthly users.
For small businesses with limited resources, I advise focusing on one or two social platforms that best reach their audience and deliver ROI. Compelling social content that redirects visitors to the website or email list can amplify engagement.
Key Takeaways for Small Business Owners
To wrap up, these are my key recommendations for small business owners looking to optimize their website‘s average time spent:
- Set clear goals for increasing duration based on your business model and audience.
- Identify weak points across the 6 key factors discussed and tackle them systematically.
- Regularly study analytics to detect shifts in engagement and user behavior.
- Benchmark against competitors in your niche to compare performance.
- Allot time and resources towards high-quality content creation and UX optimization.
- Leverage social media synergistically to drive traffic and engagement.
Understanding metrics empowers smart optimization. The average time spent on your website is an invaluable indicator of user experience and content effectiveness. Turn insights into action to boost engagement on your small business website in 2024.
Home » Building Online Stores » The Average Time Spent On a Website: Increase Visitor Engagement
The Average Time Spent On a Website: Increase Visitor Engagement
Our independent research projects and impartial reviews are funded in part by affiliate commissions, at no extra cost to our readers. Learn more
Written and researched by:
The average time spent on a website by website visitors is an awesome clue into how your visitors are responding to your site. It’s believed that the longer time they spend, the more they love your content, the better your website will rank in organic search. But according to SEO experts, that’s actually not true!
High bounce rate, on the other hand, is not what you want. This is when your visitors go to your page and quickly leave again because your website doesn’t have what they’re looking for.
Adobe stated that 38% of people won’t engage with a website due to an unattractive layout or content, highlighting the importance of having a visually appealing website . So, let’s look at average time spent, how it is measured, and how to increase your visitor engagement.
")
Session Duration: What Is The Average Time Spent On a Website?
The average time spent on a web page ranges depending on the type of web page. For example, ecommerce pages can range from 44 seconds to 1 minute and 22 seconds. While blog posts can range between 2 to 5 minutes.
But the general sweet spot for good average time on a page, across industries, is around 53 seconds.
According to Gary Illyes, Google’s Trend Analyst, “Dwell time, CTR, whatever Fishkin’s new theory is, those are generally made up crap.” Our in-house SEO experts also said that average time spent on a web page isn’t a ranking factor, stating “Time Spent on Page can be an imperfect metric too, as a ‘Bounce’ will trigger a Time Spent on Page as 0, yet there are a lot of legitimate reasons why a user may only visit one page on a website and therefore be recorded as a ‘Bounce’ when leaving.”
So why is it important? Well it is an important factor for measuring visitor engagement — which can lead you to understanding and reducing your bounce rates.
The average time spent on a website changes due to certain factors that influence a visitor’s behavior , and factors on your web page will either have them scrolling through or clicking away.
Website visitors already have an idea of what they are looking for when they get to your website. Elements like how professional your website looks , how informative it is, and how quickly it loads up are all things that can increase time spent on a website if done right.
Looking at the time spent on your page can lead to discovering what visitors are really looking for, and help you improve your site for them.
Average Time Spent Per Industry
Not only does the average time spent change per website but by industry too. A clothes ecommerce store has an average time on page of around 45 seconds, while a B2B website has over 80 seconds.
Those who come to spend money, like to buy clothing or groceries, will usually know what they want and spend less time on site. Whereas, in industries where visitors come to learn something, they’ll tend to spend more time on your website.
Unlock Expert Advice, Industry News, and More
Get help with building your online presence with our newsletter, where we send news, advice, and recommendations directly to your inbox.
By signing up to receive our newsletter, you agree to our Privacy Policy . You can unsubscribe at any time.
How Time Spent On a Page Is Measured
The best way to discover how much time people are spending on your web page is through Google Analytics .
But a fun way to start is by downloading a web activity time tracker extension on Chrome, to see where you spend your time most each day — to first understand your own activity online.
How Google Analytics Calculates Time
When someone loads up a web page, data is sent to Google Analytics, and if they move through your website to other pages that time is also sent.
Then navigating through Google Analytics to “Site Content,” and “All Pages” you’ll be able to see an overview of all the times logged on every page. Then, looking at “Avg. Time on Page” shows you how engaging each page is for visitors.
Website Factors That Affect a Page’s Visits
So, you may wonder, what is it that causes a potential lead or reader to leave your website. Here are some of the reasons for high bounce rates we’ve discovered:
- Your site takes too long to load
- Your page is difficult to navigate
- Your content is not what they were looking for
- The content is too overwhelming and not easily digestible
- CTA (Call To Action) buttons are not obvious.
- Pop-ups and ads are irritating for the user
- The site doesn’t seem trustworthy or professional enough
- Font and layout make it hard to read
These are among the main reasons people exit a page quickly. It’s a great plan to look through your competitors’ websites and see what aspects make you want to keep reading or exit altogether.
Best Ways to Increase the Time Spent On Your Page
Increasing time spent on your website can be easily done once you know what’s keeping your particular audience engaged. Each audience is different, and want different information — but here are some ideas to get you going.
Know What Your Audience Needs
Before you can begin to make your website more engaging it’s best practice to get clear on your target market wants and needs. What information do they come to your website for? What has previously gotten good engagement? What articles have the most comments or which products sell well?
Once you know what they want, it makes the rest a lot easier! But even if you’re just starting out and don’t even know how long your website visitors are sticking around, putting the rest of these into practice will give a good chance right from the start.
Add Value In The First Paragraph
When you website visitor arrives at the web page, the two things they likely look at first are your heading and your first chunk of text. This is make or break: if your heading and first paragraph aren’t right, visitors may bounce off the page right away. Make it incredibly clear what value you’re offering, or what question you’re answering if it’s a blog post — and think of it as a trust building exercise.
If you’re able to give them valuable information right away, they’ll likely trust you and stay for more.
Make Content Easily Scannable
This is key in keeping visitors engaged. If they see a blob of text without headings, bolded key information , or a sidebar menu to easily access sections, then you might lose out on potential customers or readers.
Be careful not to bold out all of your text though, as Google’s algorithm won’t see that as being helpful for your visitors. Instead aim to make it as practical as possible for people who arrive on site.
Use Bullet Pointed Lists
Website visitors value chunks of information that is presented in bullet points, since it’s easier to read. And Google will also notice your efforts to make information more digestible, rewarding you with higher ranking.
Make It Easily Digestible With Video, Images & Graphics
Especially for blogs, ecommerce stores, and most websites really, images and videos are essential for engagement. Just adding video to a blog can see a 4x lift to most engagement metrics.
We recommend hiring a creative team to handle your video production, but if you don’t have the budget yet you can create quick product explainer videos using a good phone these days. Then you can test to see if the video increases your engagement on the page.
In our research testing newsletter templates, we found a reduction in bounce rate of 34.09% just by adding images and icons, to help visualize our points. Plus people were reading through to the bottom of our emails where they hadn’t before.
The best way to add images or graphics to your website is to get a graphic designer to create custom images, icons, and graphics in your branded colors for your site.
But if you’re just starting you can always use free stock images you can find online at sites like Unsplash , just remember to check the copyrights to the image you use and give credit where credit is due.
Follow A Set Structure
Depending on what kind of website you have, the structure of a web page changes — even the same website’s different pages will change. Before that gets too confusing let us explain.
Say you have a fitness website where you sell fitness products, and you have a blog on fitness topics too. A blog article page will be different from your products pages. A blog article typically follows a format like:
- Title (or H1)
- Introductory paragraph
- Heading (H2)
- Paragraph expanding on the heading
And that continues, sometimes adding smaller headings to get more in-depth on the topic. While a product page will usually have a large image on one side of the product, and only a small description paragraph of the product, and a price.
The best thing to do if you’re unsure of how to structure your page, is to do some competitor analysis , and scope out what they do well, and see how you might apply your findings to your page.
Optimize Your Web Page for Load Speed & SEO
LoadStorm and Econsultancy noted 1 in 4 visitors abandon a web page when it takes over 4 seconds to load. There’s a lot that goes into optimizing for speed and SEO, from image file sizes, to video formatting, to choosing the right hosting provider. We will put the links to take you through everything below but first, here’s a quick checklist.
- Make headers and footers smaller
- Keep form fields short
- Use a photo resizer to make image file size smaller
- Use JPG or PNG format for photos
- Choose the right format for video
- Opt for a variable bitrate video (lower quality but higher speed)
- Pick a hosting plan that offers plenty of storage, bandwidth, and a high CPU count
If this isn’t making any sense, it’s worth going through the list of articles on the topic we’ve written, as it will explain it fully.
Further Information
- Image Optimization Guide — need to know how to optimize images for your website? We can help!
- Video Optimization Guide — want your videos to load fast on your website? This is the guide for you.
- Checkout Page Optimization Tips — want guidance on how to optimize your checkout page for customers?
- Best Web Hosting Providers — need to know what hosting provider will give you the most speed?
Mobile Optimization
Plenty of website builders offer templates that are mobile optimized, like Wix for example. Learning to make your website mobile friendly is more important than ever. Last year, people spent 39.3% more time on mobile devices in the US than three years ago.
Remove Unnecessary Ads & Forms
Have you ever opened a website and been bombarded with ads, forms, and other pop-ups . It rarely inspires trust or a willingness to explore the website. In some cases you’ll need to run ads to make money from your website, but it’s about insuring they don’t interfere with the visitors search.
It’s good to keep in mind Core Web Vitals CLS (cumulative layout shift) where basically Google penalizes pages when the content jumps around while the page is loading. Have you ever started reading an article and then suddenly an ad appears and the content jumps down and you lose your where you were reading? This not only annoys users but flags negatively for SEO too!
According to SERP Watch, 155% of customers that have seen display ads are more likely to search for brand-specific terms. So they are important in building brand awareness, but around 70% to 80% of people ignore digital ads — so ensure they’re placed in a way that doesn’t cause your bounce rate to increase.
Conclusion: The Average Time Spent On a Website
The general average time spent on a website is 53 seconds, and hopefully now you have some idea of how to improve your website visitor engagement. Here’s a quick recap of what we’ve gone over:
- Use Google Analytics to see your average time spent
- Optimize site loading speed
- Know your target market and what they’re looking for
- Add value straight away in your title and first paragraph
- Create easily scannable content
- Add videos, images, and graphics
- Follow the right structure for your web page
- Get a fast and roomy hosting provider
- Keep it mobile optimized
- Remove any unnecessary ads or forms
Although average time spent on a website isn’t a ranking factor for Google or other search engines, by continuously working to improve these on your website your visitors will thank you! And ultimately SEO is all about making your website as user friendly as possible, so it’s always a good idea to put the user first.
Let us know if you agree or have any of your own time spent optimizations, in the comments below!
Average Time Spent On a Website FAQs
What is a good average session duration, how many visitors to a website is good, what is the average time spent on an app, written by:, found this article helpful.
Share this article or comment below!
Leave a comment
The HubSpot Blog’s 2023 Web Traffic & Analytics Report [New Data]
Discover the latest web traffic benchmarks, trends, and analytics insights from our survey of 400 web professionals.

THE STATE OF MARKETING: REPORT
Access data and insights from 1,600+ marketers from around the world.

Updated: 07/24/23
Published: 07/24/23
Congrats! Your site's up and running, connecting your business with customers searching for what you have to offer.
But is your site performing well? With a long list of metrics to track, you’re probably wondering which will help you determine how your site's performing against competitors – or what you'll need to do to grow.
To help you take your website to the next level, I surveyed over 400 web analysts in the U.S. (including web marketers who track site growth) to learn how they measure performance and the top strategies they use to rank on search engine results pages (SERPs).

Lastly, it wouldn’t be a trends report without a mention of AI. So, we also asked about their early predictions about how this tech will shift SERPs in the future.
In a rush? Click through the slides below for a peek at what you'll learn in this post.
2023 Website & SEO Benchmarks
- The median website gets 20,000 unique visitors per month, while the average is over 300K (However, the average is easily skewed by a handful of extremely high-traffic sites.)
- The average website gets 7 page views per visit.
- The average website has a bounce rate of 37%.
- The average site has an SEO click-through rate of 13%, while the median comes in at 8%.
Remember, these numbers are self-reported, and many factors play into your performance, including the size and age of your website, how big the team managing it is, and how often you publish content on it.
When it comes to ranking on search results, just 40% of websites rank on the first page, and only 23% rank in the top 1-3 results of the first page.

With 60% ranking on pages 2 and beyond, SEO is definitely a challenge for less established websites or brands that are building their web presence. While the data above demonstrates that ranking highly on SERPs is an attainable goal, this likely didn't happen for our high-ranking participants overnight -- and it won't happen that quickly for you either.
You’ll need to establish your blog or website as a credible and helpful source in the eyes of a search engine, for it to rank you highly. That means consistently publishing quality content that is relevant to those who choose to click on your website after searching up a question or phrase.
Another crucial component is doing your keyword research - 79% of SEOs say the monthly search volume (MSV) for the keywords they target is high. With that, let’s take a look at which SEO strategies are most effective.
HubSpot uses the information you provide to us to contact you about our relevant content, products, and services. HubSpot will share the information you provide to us with the following partners, who will use your information for similar purposes: Search Engine Journal, Litmus, Rock Content. You can unsubscribe from communications from HubSpot at any time. For more information, check out HubSpot's Privacy Policy . To unsubscribe from Search Engine Journal's communications, see Search Engine Journal's Privacy Policy . To unsubscribe from Litmus's communications, see Litmus's Privacy Policy . To unsubscribe from Rock Content's communications, see Rock Content's Privacy Policy .
The State of Marketing in 2024
HubSpot's Annual Inbound Marketing Trends Report
- Top Marketing Channels
- AI in Marketing
- Managing Privacy
- The Future of Marketing
You're all set!
Click this link to access this resource at any time.
2023 Website & SEO Trends to Know:
1. ai will shake things up in search, but respondents are optimistic..
AI is coming to search results, and while it will definitely shake things up, bloggers predict it could give users a better experience on search platforms, offering more relevant results faster than before. This in turn could result in more people using search.
75% of blog professionals we surveyed believe AI-enabled search engines would have a positive impact on their blog, and 68% predict that their site would get more traffic than before.

But some are worried that their website will get overlooked.
One concern is that AI in search could negatively impact your traffic if content focuses on answering straightforward questions, like “ How to Enable Macros in Excel ,” since AI can answer those questions without users having to visit your website. As people get their questions answered by AI, they might not need to go to these site pages, so monitoring your traffic during this period of change is key.
Another way Google is shifting is by changing the way it prioritizes standard link-based search results and rankings with its new E-E-A-T (expertise, authoritativeness, trustworthiness) framework.
Key Focus Areas of E-E-A-T
- One notable "E" in the framework rewards "experience" -- something that AI is incapable of having. It measures whether content “was produced with some degree of experience, such as with actual use of a product, having actually visited a place or communicating what a person experienced.”
- AI also can’t leverage expertise to express a unique point of view or opinion, nor does it have an engaging personality. Content that leverages these will continue to perform well, as it incentivizes searchers to go beyond the AI result and click on your site.
For example, content featuring original data and perspectives from experts could do well in the evolving Google landscape, as it can be difficult to know when generative AI is giving you wrong information about data or expert quotes, a.k.a “hallucinating.”
Students, professionals, and even consumers in the research stages of the buyer's journey might wish to get data or expert insights from direct sources beyond the search page so they can vet legitimacy and trustworthiness.
2. 50% of writers use AI tools to boost content performance.
Not only do half of bloggers use AI to make content, but 74% of web analysts whose writers use AI for content creation say it makes their content perform better and 65% say it makes their pages rank higher on SERPs.

58% of web analysts/SEOs are also incorporating AI tools into their workflow.
Some are gradually testing it and comparing results to performance without AI, while others use AI for specific things, like keyword research, automating tedious tasks, optimizing their website, and idea generation. Some are also building brand-new teams to leverage AI.
Check out the full State of AI Report for more use cases.
3. Blogging for SEO is still highly effective, but social search shouldn't be ignored.
75% of web analysts say their web strategy has been effective for reaching their business goals this year, and almost half of websites saw their traffic grow YoY, while just 13% saw a drop.

Still, 79% of Gen Z and Millennials say they use the search function on social apps. On top of that, 29% of Gen Z and Millennials actually prefer using social media to search for answers to questions online over search engines, though a majority (58%) still favor search.

Search engines are actively being disrupted by both social search and AI, meaning it's more important than ever to monitor your web performance and adapt your strategy accordingly.
4. Most SEOs have seen positive impacts from Google’s 2023 algorithm updates.
65% say the update had a positive impact, including increased web traffic and SERP ranking. 48% saw an increase in traffic since the update, while just 3% saw a drop.

As mentioned, the update added an “E” for experience to Google’s “E-E-A-T” framework for determining search rankings.
Professionals in our survey ranked each of these in order of importance for ranking highly on SERPs, with Trustworthiness and Expertise taking the top spots, followed by Experience and Authoritativeness.
Trustworthiness is all about showing that your website and the content on it is credible. The Expertise and Experience metrics focus on whether or not you are a subject matter expert and have personal experience with the topic at hand - these will all be increasingly important as AI enters the mix.
For a better idea of the changes to come, check out our article on How Generative AI Will Change Search and SEO.
5. The Top SEO Strategies are All About Optimization
We asked web analysts about the most effective strategies they use for ranking on SERPs, and as you can see below, the top three revolve around optimization.
Optimizing your content around target keywords, optimizing for search intent, optimizing images for SEO, and conducting keyword research are all highly effective strategies.

Despite all of Google's ongoing changes, these results are similar to our 2022 survey where the top three strategies were optimizing content for search intent (61%), optimizing on-page content around target keywords (58%), and writing compelling title tags and meta descriptions (20%). But, one place we're seeing new attention is in multimedia.
Adding visual content to your blog posts, like videos or infographics is another strategy that can increase the time users spend on your page, which lets search algorithms know your content is valuable and potentially increases your ranking.
The last tactic we want to call out is using AI tools to SEO-optimize your website. 58% of web analysts/SEO are already looking for ways to incorporate AI into their workflow - this can help save you time and supercharge everything from keyword research to content creation.
6. Mobile optimization is more important than ever.
Our consumer trends survey found that 54% of consumers use their phones most often when looking up a question on a search engine. This jumps to 80% for Gen Z and around 60% for Millennials and Gen X.

Chances are, your site is being visited by mobile more often than by laptop/desktop computers, making prioritizing the mobile experience key to success.
7. When it Comes to Tracking Performance, Web Analysts Focus on the Bottom Line.
Sales, leads, and conversions are the most important metrics web analysts track, followed by total monthly visitors, click-through rate, search traffic, and bounce rate.

Other HubSpot Research
While SERPs and site performance trends are always evolving, a lot has stayed the same year-over-year. Here are some stats we still think are important to keep in mind from the Web Strategy Survey we ran in 2022:
Web & SEO Performance
- Half of websites receive 15,000 unique visitors or less per month. Meanwhile:
- 31% of websites average over 50,000 unique visitors per month
- Only 15% of websites average over 100,000 unique visitors per month.
- Nearly 1 in 4 websites have an average SEO click-through rate between 10-19%.
- Just 14% of websites have an average SEO click-through rate over 40%.
Visitor Behavior
- Almost 50% of websites get 4-6 page views per visit.
- 35% of websites get 7-10 page views from each visit.
- Just 17% of websites get one to three page views per visit.
- Nearly 2 in 3 websites have an average bounce rate under 40%
- Just 11% of websites have an average bounce rate over 60%
Other High-Traffic Channels
- Mobile devices were responsible for nearly half of all web traffic. Continuous research done by HubSpot and many other publications shows that this trend is only increasing.
- Nearly one-fourth of web professionals surveyed in 2022 said direct traffic was their top source.
- Following direct was organic search (17%), social (16%) and email (14%)

Don't forget to share this post!
Related articles.

Too Many Redirects: What This Error Means & How to Fix It

What Is Latency & How Do You Improve It?

Top Website Optimization Tips, from SEOs Driving Millions of Views Per Month

Lazy Loading: How It Decreases Load Time and Increases Engagement

How to Test Your Website Speed

How to Resize an Image without Losing Quality

How to Monitor the Uptime of Your Website (+Tools)

Hotlinking: What Is It & How Can You Prevent It?

What are AI Content Writing Tools? (And Should You Use One?)

How to Use Google PageSpeed Insights: A Starter Guide
Speed Up Your Website with HubSpot's Built-In CDN
CMS Hub is flexible for marketers, powerful for developers, and gives customers a personalized, secure experience
Learn / Guides / GA glossary (A-Z)
Back to guides
Average session duration in Google Analytics
Average session duration in Google Analytics 4 (GA4) is a user engagement metric that tells you the average length of engaged sessions on your website or app.
Last updated
Reading time.

GA4 starts calculating a session (whether engaged or unengaged) when a visitor opens your app in the foreground or views a page or screen—and no previous session is currently active. If they stay active for a certain length of time (the default is at least ten seconds), it’s considered an engaged session.
There’s no limit to how long a single session can last. But a session automatically expires after 30 minutes of inactivity.
Checking how long visitors stay on your site or app helps you gauge their interaction with and interest in your brand, products, or services.
For example, let’s say you see new users spending around five minutes on your site. If the average session duration for this segment used to be far shorter, it could indicate that your landing pages and campaigns are now piquing their interest. The increase could prompt you to dig into what’s really happening and make more of the same effective optimizations.
Discover what really happens on your app or website
Get the insight you need: use Hotjar Recordings and launch on-site surveys to learn more about your users and optimize your site or app.
How does Google Analytics 4 calculate average session duration?
The GA4 average session duration refers to the length of all engaged sessions* divided by the number of all sessions on your site or app. Here’s how to write the formula:
Avg session duration = total engaged sessions within a certain time period / total sessions in the same time period
Of course, Google Analytics already makes this data available to you—although with a few extra steps compared to Universal Analytics (UA). Keep scrolling to learn where and how to look for it.
* Again, a session is ‘engaged’ if it goes beyond a single pageview or screenview or triggers a conversion event and lasts longer than your preferred limit (you can set it between ten and 60 seconds).
How to find average session duration in Google Analytics 4
Unlike in UA, which stopped processing data on July 1, 2023 , average session duration isn't included in GA4 reports by default. But it only takes minutes to add it to your standard reports. Track this metric in GA4 and analyze it alongside other engagement metrics with these steps:
Step 1: first, you need Admin or Editor permission for the Google account or property on which you're generating a report. Or ask the teammate who has the appropriate permission to take it from here.
Step 2: click on ‘Reports’ in the left-hand menu. Choose any report. In this case, we’ll use ‘Traffic acquisition: Session default channel group’.

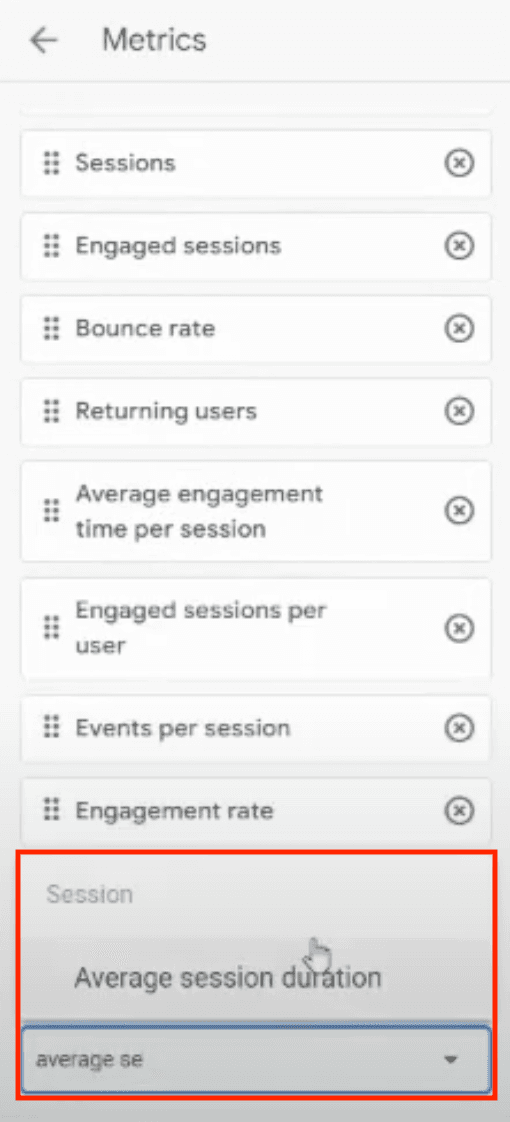
Step 3: click on the pencil icon at the top-right corner and select 'Metrics'. In the bottom search box that says 'Add metric', type 'average session duration' to find it immediately. Hit the 'Apply' button.
Step 4: now drag the metric above or below relevant metrics so they appear side-by-side when viewed in a report table.

Step 5: once you’re happy with its placement, hit ‘Apply + Save + Save changes to current report’ to the left of the ‘Metrics’ pane. A prompt will confirm which current report you want to update with the changes.

🔥 Pro tip: try GA4’s exploration reports if you prefer advanced reporting and further customization. Explorations provides data access and analytical techniques that aren't available in reports, allowing you to
Focus on the most relevant data
Find out if users encounter blockers in their buying journey
Uncover user experience issues and website bugs
Google shares some Explorations starter tips so your company or team can take advantage of this feature.
What the average session duration in Google Analytics 4 tells you (and what it doesn’t)
Observing how much time visitors spend on your site or app on average offers some vital business insights.
For example, average session duration and 'average engagement time' tell you how long a user might take to get through a sales funnel . A sales funnel includes interactions across multiple pages, such as: homepage > category page > product page > shopping cart > checkout.
If it takes users an unrealistically short or unusually long amount of time to get through the funnel, the data's erratic trend might push you to investigate potential problems. However, you can't know what's wrong without looking past the numbers (more on this later).
Let's look into the four things you should be wary of when checking average session duration in GA4—and some bonus tips on what to do to understand the user experience better.
1. Average session duration raises more questions than it answers
As much as this metric gives you quantitative data—which is good enough if you want to know what's happening on your site —it doesn't offer context to help you learn why users behave a certain way .
Identifying the reasons users experience issues in the customer journey is more meaningful if you plan to fix them fast and avoid costly do-overs. Meanwhile, the lack of context only leads to more questions, such as
How did particular users get through the sales funnel so fast? Did they miss any important page elements or details?
Why did those users take so long to get through the sales funnel? Was there information missing? Did they encounter a website bug? Or were the next steps not clear?
🔥 Recordings gives you a glimpse of how users experience your app or website
Use session recordings to get into your users’ headspace: how they engage with your app or site from page to page, up to the point of exit. This front-row view helps you think beyond session duration and consider drivers of user behavior.
For example, you can see if an area or element causes them to repeatedly click or tap, leading to a series of rage clicks that indicate frustration. Tap into these replays of real, anonymized users clicking and moving around pages to identify pain points or blockers and optimize your app or site accordingly.
Session recordings shed light on situations, such as the user
Encountering broken links, missing elements, or website bugs
Exhibiting frustration through rage clicks or u-turns (when a user opens a new page and returns quickly to the previous page)
Getting distracted by pop-ups or other elements and becoming inactive on a page
2. Session duration now accounts for users navigating away, but it still doesn’t uncover the behavioral cause
GA4 accounts for when a user leaves a page open and returns to continue browsing a second page. For instance, imagine someone scrolls through your homepage for one minute and then checks another site (say a competitor's). Before the 30 minutes of inactivity elapses, they go back, navigate to a second page, and stay there for six minutes . Their entire session lasts seven minutes .
If the other page was a product page, and the user left without buying anything, you'd want to know what actually happened. Were they just browsing options? Or did something on your app or site turn them off, like a broken checkout button or a confusing product description?
Average session duration provides an incomplete picture if treated as a standalone indicator.
3. Average session duration is not the best indicator of engagement
As we said, solely looking at the average length of engaged sessions won't give you an accurate understanding of the user journey. You should include average engagement time—that is, the total time active users engaged with a web page.
Analyzing pages with the highest average engagement time lets you determine what you're doing right. On the other hand, those at the bottom drive you to dig deeper into what makes users leave—is it because your content doesn't meet their expectations, or there are too many errors on the checkout page? Perhaps they're not sure what to do next after reaching your landing page.
🔥 Launch a user-friendly survey on high-exit pages

The last page of a session is called the exit page. You can track high-exit pages by creating a custom report or 'Exploration'. Consequently, place a well-timed, on-site survey to ask real users directly why they leave a page, so you can learn about what they're looking for and are hoping to see improved on your app or site.
Ask your visitors a combination of open- and closed-ended questions , like
Will you be making a purchase today? [Yes/No]
What's stopping you from buying today?
How can we make this page better?
Not sure what type of survey to launch and what to ask? Create a survey matching your goals using our AI or one of our pre-built templates (see: exit-intent survey )—with a comprehensive bank of survey questions to boot.
4. Session duration can be ‘fixed’ or altered
One case in which this can happen is when you change your timeout setting in GA4. As mentioned earlier, a session expires by default after 30 minutes of inactivity. Make it too short, and you get a high number of sessions but low engagement time; make it too long, and you artificially extend how long users stay on your app or site.
Either way, you end up collecting inaccurate data. And this doesn't help you gauge how much your pages pique people's interest or discover their actual experience on your app or website.
🔥 Ask users for feedback on high-exit pages
Get to the bottom of people's likes and dislikes by hearing from them directly as they experience your app or website. Roll out our nifty Feedback widget and ask them to rate their experience.
Having feedback scores on each page reveals what users love and hate, and enables you to spot problems as they develop. From there, you can make a data-driven decision and avoid deploying improvements people didn't ask for.
Easily go beyond average session duration to optimize your site brilliantly
Complement the average session duration metric with user behavior and visualization tools to better understand how people experience your website or app. This opens you up to more valuable insights, which you can use to optimize website performance and delight your customers.
Ready to get started? The Hotjar and Google Analytics integration facilitates a seamless switch between extensive app and web analytics and eye-opening digital experience insights. It's time to get the best of both worlds.
Get the insight you need: use Hotjar Recordings and on-site surveys to learn more about your users and optimize your site.
FAQs about average session duration in Google Analytics
What is average session duration in google analytics 4.
Average session duration in GA4 refers to the average length of engaged sessions on your website or app. Here's how it's calculated:
Avg session duration = total engaged sessions / total sessions
Knowing how long visitors stay on your app or site on average can help you gauge people’s interest in your brand, products, or services.
What is a good average session duration?
Some reports say an excellent benchmark for average session duration falls between 2 and 4 minutes. Others maintain that the total time depends on the device people use. Typically, users stay longer on a page viewed via mobile than on a computer.
What’s the difference between ‘average session duration’ and ‘average engagement time’ in GA4?
As we said, average session duration is the duration of all engaged sessions (in seconds) divided by the number of sessions. Meanwhile, average engagement time per session pertains to the length of time a user actively uses your site or app (it is the sole focus on their screen).
Previous chapter
Transactions
Next chapter
- Web Support Request
7 Website Analytics That Matter Most
Published by Spinutech on October 13, 2015

If you have a Google Analytics account or web metric reporting of any kind, you probably know how easy it is to feel overwhelmed by all the data provided. Sure, there’s lots of information, but is all of it meaningful? And how can you tell if your website is successful? In this post, I’ve outlined 7 universal key performance indicators, their benchmarks, and how to use them to turn your analytics reports into an analytics story you can attribute meaningful and actionable information to.
There are many other metrics that you should be using for in-depth analysis, but for now I recommend starting with these for evaluating initial site performance. Please note, average based metrics can be very dangerous. For meaningful analytics, segmentation is necessary, and I encourage you to view the following metrics by traffic source.
The number of visits and visitors to your website, reported as sessions and users. Most often referencing the number of visits (sessions) to your site.
Traffic, specifically number of visits, is a fundamental measurement of site reach and growth. It’s helpful at gauging how well your marketing efforts are working, and helps to give a great overall snapshot of site performance. You spend all this time figuring out how to get traffic to your website, but the key is to make sure it’s the right traffic.
How Much Traffic Should Your Website Get?
That depends. Unfortunately, there isn’t a magic number or range for website visits.
Site goals based on a number or range of visits should not be used as an indication of success. Your only goal should be to do better than you did this time last year.
When setting your blog or website traffic goals, start by asking yourself why you want to grow your traffic to begin with and what you intend to do for that audience. Your goal shouldn’t be to grow the number of visits simply for the sake of growth or based on arbitrary numbers, but to grow a dedicated audience that supports your digital business goals. Although I don’t recommend setting goals based on traffic, it is important to know healthy ranges to expect and how you stack up to other similar sites in your industry and region. For a general benchmark, you can find comparisons in the benchmarking report in Google Analytics.
At a general site level, there’s very little value in measuring / pursuing goals in overall site traffic without context from traffic channels and location (if you’re a regionally based business). Additionally, although I do recommend monitoring your month over month traffic performance to look for trends and changes, this isn’t an accurate measure of success due to seasonal traffic fluctuations and other factors. The best measurement of success when it comes to traffic is a year over year performance comparison and growth progression.
2. Bounce Rate
The percentage of single-page site visits.
At the site level, bounce rate is useful as a general signal of user engagement and the state of content quality, and helps to identify when problems exist on your site. However, bounce rate is very dependent on the site, and unreliable on its own, and must be used alongside other engagement metrics such as average session duration and pages per visit.
What is a Good Bounce Rate?
This will honestly depend, as there’s no hard and fast rule. 50% is an industry indicator, but this number should always be taken into consideration with other metrics, the nature of your business and industry. I often see bounce rates that range from 25% - 65% across different industries.
An abnormally high bounce rate is generally a warning that people are leaving your site, and aren’t willing to stick around to explore the rest of your website.
Bounce rate is often unfairly flagged as a ‘bad’ metric, but it’s not inherently good or bad. It simply states how often site visits stay on the same page from their initial entry. Standard bounce rate (in Google Analytics) has nothing to do with time on site or how quickly a user leaves the site, so if you’re judging the success of your site on a high bounce rate, you’re missing key information about how users are actually interacting. For instance, consider a user that clicked on your site from a search result, spent 5 minutes reading the content on your landing page, then leaves or completes an off-site call to action. In Google Analytics, that’s technically considered a bounce, even though it lead to an interaction.
A number of factors can be responsible for high bounce rates. Anything from the ease of navigation, slow page loads, poor aesthetics, low or irrelevant quality content. Once you can identify there’s an issue, dig a little further with segmentation to determine why your visitors are leaving.
3. Pages / Session
An average of the number of pages viewed during a visit on your site.
Pages per session broadly gauges how compelling users find your content and the ease of access.
How Many Pages Per Session Should I Aim For?
The unofficial industry standard is 2 pages per session.
For most sites, the goal is keep users engaged, nurture their interest, and get them to take the next step. More pages per session often indicates that your users are highly engaged and willing to explore more of your site. This is an excellent way of measuring interest and curiosity about your company. Use the behavior user flow reports to follow their click trail.
Additionally, while some would suggest that the greater the number of pages per session, the better, this isn’t always the case. Again, I must stress the importance of considering metrics together to avoid making inaccurate judgements. Consider the average time on site and bounce rate to piece together a better idea of what’s happening at large. A site with a high number of pages per session, low session duration, and a high bounce rate can indicate page flipping behavior due to irrelevant content, poor accessibility, or disinterest. Similarly, a site struggling with low number of pages per session coupled with low session duration, and a high bounce rate can indicate low quality content or user engagement. However, it’s best to always consider your goals. In some instances, this might be exactly what you want for your marketing campaign.
4. Average Session Duration
The average length of all site visits combined.
Alongside bounce rate and pages per session, average session duration contributes to the user engagement story by illustrating how long users stay on your site. At the site level, it’s a helpful metric for indicating engagement the true value of your site content (time is money, right?).
What Should Your Average Time on Site Be?
For a good average session duration, the industry standard is 2 - 3 minutes.
What can happen in two minutes? Two minutes might not seem like much time, but it’s enough time for users to read content and interact with your website. And for this reason, longer sessions indicate more engaged visits. Time is the most precious resource we have as human beings, and this number shows us how much of their time users are willing to sacrifice for your content.
However, because this number is an average based metric, we must be careful at trusting this number without further context.This metric is most helpful when looking at segmented views, traffic sources and in consideration with other engagement metrics.
5. Conversions
The quantifiable measurement of expected or desired site outcomes, reported as goal completions and conversion rate.
When evaluating overall initial site performance, conversion rate tells us about the effectiveness of your site and marketing efforts. Used with other engagement metrics, goals also contribute to your site’s analytics story by highlighting value as they relate to your business goals.
What is a Good Conversion Rate?
Industry standard conversion rate is 2%.
Goal completions and conversion rate allow us to determine the events on your site that are most important to your business and should be connected in some way to your company’s objectives.
Not to be confused with events, conversions are the outcomes mentioned in the definition and signify the reason why your site exists. Although events are incredibly important to measuring engagement, events are could be classified as secondary site interactions that are not tied to business objectives.
This benchmark varies by industry and will completely depend your business goals and the the intention of your site. Generally, a lower than average conversion rate may indicate issues with accessibility, calls to actions, low quality content, and general disinterest. However, if your site engagement is suffering, it’s likely the case that your conversion rate will suffer as well.
Because this is one of the few digital marketing metrics that reflects your business goals most, conversions are truly most powerful in a segmented view to identify areas on the site that hold the greatest amount of value and where improvement is needed most.
6. Percent of New Sessions
An average percentage of first time visits to your site.
This metric measures how many of your site visits are from first-time visitors or returning visitors, and indicates the efficacy of your marketing efforts at driving new site traffic. However, this is an important KPI to for measuring the ‘stickiness’ of your site, or whether your site is worthy of multiple visits from users.
What Percentage is Ideal for New Sessions?
No benchmark. I often see a range of 45 - 75%, but maybe the 80/20 rule works for you.
A good site will have a healthy mix of new and returning site visitors, and this mix will vary depending on your site goals, business and industry. If your goal is to generate leads from your site, you’ll want a healthy number of returning visits as it often takes multiple interactions with your site for users to convert.
However, don’t get so lost in acquiring new visits that you neglect your existing audience base. Additionally, it’s important to note that not ALL site visitors are worthy of retention.
7. Click Through Rate
The percentage of clicks resulting from a search impression.
CTR is important for paid advertising and organic listings alike. However, in this post, I’m referring specifically to CTR from organic search.
Click through rate (CTR) helps us understand how well your site is performing from search engine results pages as it measures how many people click your site’s listings. This metric indicates how compelling and relevant your search results are, and the impact of your improvements to search results.
What is a Good Click Through Rate?
The industry average CTR for all sites is 2%. The average CTR will vary depending on the nature of the query and your industry.
Click through rate is a powerful metric that allows us to evaluate how well your indexed search result is driving users to click. If your site has a lower than average click through rate, it may indicate that your indexed results may need some work. This could be due to poor keyword targeting, irrelevant content for the user’s search, or you’re missing compelling descriptions or rich snippets.
Although rankings and impressions are important to understand to monitor overall growth in search results, click through rate offers a better measure of performance from organic search. When paired with bounce rate and other engagement metrics, this metric is also incredibly helpful for identifying issues content efficacy and user engagement. If you’d like to get into more detail, I suggest looking at CTR of the top queries for which your site appeared in search in Google Search Console. Because branded searches typically result in higher CTR than non-branded search, I would add that a true measure of effective marketing using click through rate would be to monitor CTR by non-branded search queries only.
What Metric Should I Use to Determine if My Site is Successful?
All of them. Not any one metric should be used alone to indicate performance success. Each metric presents only a piece of the puzzle, and the full situation can only truly be understood when used together. If you were to focus on only one metric, instead of letting them lend to the story together, you’re missing the bigger picture. This can lead to some dangerous judgments and decisions.
There are hundreds of ranking factors for which Google considers your website, and this post by no means even grazes measurement of these factors. However, as stated before, the seven areas highlighted above simply represent the overarching scope of your site performance and initial engagement with your site. Once you understand your general site metrics, by traffic source, I encourage you to dig further into behavior and page level analysis. Further, always consider your goals when reviewing these metrics, as this provides context for your site’s analytics story.
We value your privacy
We use cookies to enhance your browsing experience, serve personalized ads or content, and analyze our traffic. By clicking "Accept All", you consent to our use of cookies. Privacy Policy
Better Understanding Visit Duration and Conversion Rate
More than nine out of 10 marketers and businesses see content as a valuable business asset with 56 percent of businesses planning to spend more on content creation in the immediate future, according to 2020 survey by Siege Media.
The inherent value of creating content is well understood, but many organizations still struggle to fully understand how to value the success of an individual piece of content. Two of the most used website metrics – Visit Duration and Conversion Rate – provide valuable information to content creators but also require a nuanced understanding to fully grasp.
Let’s look more at these tools in more detail, in particular how to determine their value based on context.
Visit Duration
Visit Duration, also known as Session Duration, can be one of the most interesting and challenging visitor metrics to analyze. This is due to the fact that the relevance of session duration is so closely tied to the business objective and varies so widely across industries and segments.
For example, an online survey in 2017 of 181 companies revealed that visitors to business-to-consumer companies spend on average 42.3 percent more time on site than visitors to business-to-business companies.
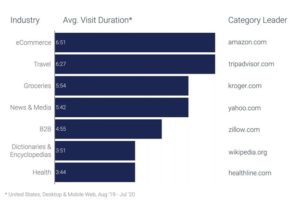
As you can see above, B2C categories such as eCommerce and travel command longer share of visitor attention than the B2B category. This is intuitive because B2B visitors typically expect vendors to “get to the point” and demand clear Information Architectures with crisp calls to action (CTAs) so they can quickly determine if the site they are visiting is appropriate for their immediate needs. By contrast, B2C visitors may linger and shop, compare pricing, read reviews and recommendations before making a purchase.
It’s easy to understand that the average session duration should decrease as customers proceed farther along their customer journey. Specifically, during the brand awareness phase, when a visitor is first being introduced to a brand, they may linger longer on pages, or visit multiple pages trying to learn more about a company, service or product.
However, as they enter the consideration and education phases of their customer journey, and their level of intent increases, they will desire to move more quickly through a site to achieve their intended goal. Thus, average session duration must not be “taken as a whole” with one aggregate value pertinent to every visit to the site, but rather leveraged to analyze whether customer journey-specific content is effectively moving visitors to our intended outcome.
This should be seen as true whether the company is selling sweaters or managed cybersecurity services.
If increasing the length of session duration is defined as a business objective (as there must be specific reasons to do so such as increases session duration directly correlates to increased conversions) then there are several tactics available to achieve this end.
- Include Videos. By leveraging video, you can present information more dynamically, allowing for more convenient multitasking.
- Break Up Text with Engaging Images. Content with custom graphics that help visualize statistics performs better in terms of session duration.
- Understand the Customer Journey. Think about where new content fits in the typical user journey—is it top-of-the-funnel content, or is it designed to convert returning visitors?
- Track the Right Metrics. Follow which pages have the lowest average time-on-page to identify the pages that need the most work.
- Make Sure Your Interface Is User-Friendly. A distraction-free experience focuses a reader’s attention on the article or web page instead of on closing pop-ups, ignoring ads or exploring a sidebar.
- Format Your Content so it’s Easy to Read. If it looks like it’s easy to scan through (descriptive subheads) visitors will spend a few seconds scrolling down.
- Link to Other Pages of Your Site. If people are interested in a topic, they will keep reading.
- Build a Library. Build a hub-and-spoke model that identifies a relevant, high-level topic then builds out articles on all related topics.
- Publish Content That’s Worth Reading. Provide on-point, exhaustive, accurate information that is easy to read and understand.
As with all web analytics metrics, there is no “one size fits all” session duration value. “Good” values will vary by industry, customer segment and even throughout the site itself.
Conversion Rate
Conversion Rate is a critical metric for web analytics because it is a representation of “where the rubber hits the road.” In other words, websites must exist to do something to further the needs of a business. And thus, conversion rates are the Key Performance Indicator most closely aligned with clearly defined business objectives. While many web metrics are technical in nature, indicative of site performance and so forth, conversion rates are indicative of the website’s ability (if not the entire digital ecosystem’s ability) to generate real business value.
Broadly defined, the website conversion rate shows the percentage of website visitors that take a desired action on your site. This action converts them from visitors to leads (or customers). The desired action might be downloading an ebook, signing up for a trial, completing a purchase, subscribing to a course, downloading a mobile app, booking a demo, or something else.
To properly understand conversion rates, one must properly understand what constitutes a conversion, which requires clear understanding and articulation of a goal, which can only be derived by clearly stated business objectives. For example, the very definition of a conversion rate “reads” like the business objective it is intended to convey:
“What percentage of visitors actually signed up for our newsletter after visiting the new services page?”
Conversion rate = newsletter signups / services page visitors
“What percentage of women ages 45-54 in Virginia bought wine after visiting from Facebook?”
Conversion rate = in-segment eCommerce transactions / Facebook referrals
Another critical aspect of “overall” conversion rates is the importance of “sub-conversion rates” and their ability to illustrate failed steps of the funnel path. For example, any overall conversion rate is the product of its stepwise conversion rates, as indicated below. Thus, not only must we have goals for the top-of-funnel to transaction conversion rate, but we must also have goals for each step of the way.

Typical conversion rates also vary widely by industry, and appropriate consideration must be paid when deriving strategy to ensure we are benchmarking against relevant competitive data sets.
Similarly, conversion rates will also vary widely depending on visitor state, for example new versus returning visitors. The way a first-time visitor interacts with a site is very different from how a returning visitor interacts.
To improve first-time visitors conversions, you have to isolate this metric from the conversion rates of your loyal or returning customers. See what they’re interested in when they visit the website for the first time and how you can improve that experience. When analyzing returning visitor conversion rates, there are two questions to be asked:
- Why did the person return?
- Did the person convert the first time around? And if not, how can you convert them the second time they visit your site?
Given the differences in conversion rates between new and returning visitors, conversion rate targets must be designed according to the customer journey. For example, many first-time visitors may be arriving at a site through brand awareness campaigns such as thought leadership pieces or organically finding blog articles, whereas returning visitors may have already progressed past brand awareness and are now in the consideration or education phase.
Many different techniques can be employed to engage these visitors with higher intent, possibly returning for their second, third or more visit, in order to drive conversions. Messaging with greater intensity and affinity must be deployed that urge a prospect to take action. Conversion rate analysis based on the same customer segment but identified to be at different stages of their journey can provide deep insight in content marketing and lead gen initiatives.
Google Analytics Key terms
What is visit duration in google analytics.

Published on Jan 20, 2023 and edited on Nov 21, 2023 by Iron Brands
Visit Duration, also known as Session Duration, in Google Analytics , is a metric that measures the amount of time visitors spend on your website during a single session. This metric is crucial for understanding user engagement and the effectiveness of your content.
Let's delve into what Visit Duration entails and its importance in web analytics.
What is Visit Duration?
- Definition : Visit Duration refers to the total amount of time a user spends on your site in a single session. It is calculated from the time the user enters the site until they leave or become inactive.
- Calculation Method : Google Analytics calculates Session Duration by taking the timestamps of the first and last activity in a session. It includes the time spent on all pages and interactions (like page views and events) during that session.
Importance of Visit Duration
- User Engagement : Longer visit durations often indicate higher engagement, suggesting that users find your content valuable and interesting.
- Content Effectiveness : This metric helps in assessing which content keeps users engaged and which may need improvement.
- Bounce Rate Context : When analyzed alongside the bounce rate, Visit Duration can provide context about user behavior. For instance, a high bounce rate with a long Visit Duration might suggest that users found what they needed on the first page.
Factors Influencing Visit Duration
- Content Quality : High-quality, relevant content can significantly increase the time users spend on your site.
- Website Design : User-friendly and appealing website design can encourage visitors to stay longer and explore more pages.
- Technical Performance : Fast loading times and smooth performance can positively affect Visit Duration.
Challenges in Measurement
- Last Page Dilemma : Google Analytics cannot track the time spent on the last page of a session unless the user performs some action. This can lead to underestimations of Visit Duration.
- Single-page Applications : For websites with single-page applications, additional setup in Google Analytics is required to accurately track interactions and thus Visit Duration.
Final Thoughts
Visit Duration is a valuable metric in Google Analytics for gauging user engagement and the effectiveness of your website's content. However, interpreting this data requires understanding its limitations and the context of your site's user experience.
While Google Analytics provides detailed insights, it can be complex for many users. At [Simple Analytics}( https://simpleanalytics.com/ ), we offer a more straightforward, privacy-focused approach to analytics, ensuring easier access to key insights. Check our live analytics dashboard to see for yourself.
GA4 is complex. Try Simple Analytics
GA4 is like sitting in an airplane cockpit without a pilot license
- Metric Library
- Integrations
Avg. Visit Duration

Avg. Visit Duration measures the average length of time users spend on your website during a session. This metric can help you understand user engagement and the effectiveness of your website content.
With Databox you can track all your metrics from various data sources in one place .

- Tech details
Visualizations

Used to show a simple Metric or to draw attention to one key number.
How to track Avg. Visit Duration in Databox?
Databox is a business analytics software that allows you to track and visualize your most important metrics from any data source in one centralized platform.
To track Avg. Visit Duration using Databox, follow these steps:
- 1 Connect Matomo that contains the metric you want to track
- 2 Select the metric you want to track from the list of available metrics
- 3 Drag and drop the selected metric onto your dashboard
- 4 Watch your dashboard populate in seconds
- 5 Put Avg. Visit Duration on the Performance screen
- 6 Get Avg. Visit Duration performance daily with Scorecards or as a weekly digest
- 7 Set Goals to track and improve performance of Avg. Visit Duration

Set Goals to track and improve your performance

Get your daily progress every morning with Scorecards

Receive detailed weekly performance updates

Built your own custom metrics with Metric Builder

Get instant insights into your top-performing metrics
- Description Avg. Visit Duration measures the average length of time users spend on your website during a session. This metric can help you understand user engagement and the effectiveness of your website content.
- Category Website Analytics
- Date Added 2022-08-08
- Default Format Duration
- Cumulative Support No
- Favorable Trend increasing
- Changing historical data No
- Forecast Support Yes
- Benchmark Support Yes
- Dimension N/A
- Metric Type general Learn more
- API Value Key
- API Dimension Key
- API Endpoint https://{domain_name}/https://{domain_name}
Related Metrics
Unique visitors by country.
The Unique Visitors by Country metric shows the number of individual visitors from each country who accessed a website during a specified time period.
Unique Visitors by Region
The Unique Visitors by Region metric in Matomo shows the number of distinct visitors your website has received from each geographical region, providing insights on your website's global reach and potential target markets.
Unique Visitors by City
The Unique Visitors by City metric shows the number of distinct visitors who accessed a website from a particular city.
Unique Visitors by Device Type
This metric provides information on the number of distinct visitors to a website, segmented by device type (desktop, mobile, tablet). It helps to understand which devices are popular among website visitors.
Unique Visitors by Device Model
This metric shows the number of individual visitors to a website, grouped by the make and model of the device they used to access the site.
Unique Visitors by Device Brand
The Unique Visitors by Device Brand metric in Matomo shows the number of distinct users who visited a website using a specific brand of device, such as Apple, Samsung, or Google. It can help identify which device brands are most popular among the website's visitors and inform decisions about optimizing the site for those devices.
Bounce Rate by Page
Bounce Rate by Page measures the percentage of visits to a specific page where visitors leave without interacting or viewing any other pages on the website.
Goal Conversion Rate
Goal Conversion Rate measures the percentage of website visitors who completed a specific goal on your site out of the total number of visitors. It helps you track how well your website is delivering on your desired actions and helps optimize your conversion funnel.
Track all of your key business metrics from one screen

Build your first dashboard in 5 minutes or less
Latest from our blog
- New in Databox: Analyze the Performance of Any Metric or KPI with Metric Insights April 22, 2024
- The Benefits of Hiring a Fractional Chief Marketing Officer (fCMO): Perspectives of Agencies, Buyers, and fCMOs April 18, 2024
- Metrics & KPIs
- vs. Tableau
- vs. Looker Studio
- vs. Klipfolio
- vs. Power BI
- vs. Whatagraph
- vs. AgencyAnalytics
- Product & Engineering
- Inside Databox
- Terms of Service
- Privacy Policy
- Talent Resources
- We're Hiring!
- Help Center
- API Documentation
Return on web site visit duration: Applying web analytics data
- Published: 30 September 2015
- Volume 17 , pages 54–70, ( 2015 )
Cite this article

- Jiyao Xun 1
4910 Accesses
4 Citations
Explore all metrics
Much research on internet marketing and e-commerce shares a great interest in a key performance metric for e-tailer success online: the shopper’s time spent on the web site, commonly known as ‘web site visit duration’. Visit duration has been used as a useful proxy to measure web‘stickiness’ because it enhances visitor-to-buyer conversion rate and often leads to online loyalty. The motivation of this study is the recognition of web site visit duration as an important metric to e-commerce success, and also the relative paucity of research on theoretical frameworks that explain visit duration. This study draws on the two-stage choice model literature and posits that shopper visitation to an e-commerce web site is a function of the choice decision processes. We construct a model to decompose online shoppers’ decision for visit duration into two choice stages. In Stage 1, shoppers are explorative with less effortful visitation behaviour (eg using search engine to reach a site). In Stage 2, shoppers engage in more effortful and depth visitation activities (eg viewing more Web pages). We empirically test our model using observed web analytics data from 94 UK e-stores to unveil the decision process mechanism for Stage 1 and Stage 2, respectively, and also the transition between the two stages (eg bounce from the web site), which is lacking in extant literature because of its unobservable nature.
Blazing the Trail: Considering Browsing Path Dependence in Online Service Response Strategy

Cross-visiting Behaviour of Online Consumers Across Retailers’ and Comparison Sites, a Macro-Study

Why Do Consumers Continue To Shop On The Internet?
Avoid common mistakes on your manuscript.
Introduction
Much research on Internet marketing and e-commerce is interested in a key construct for e-tailers’ success online: the shopper’s time spent on the web site (also called ‘visit duration’). Visit duration is measured by the amount of time a user is on a web site. 1 Although visit duration has received some criticism and involves some challenges, it nevertheless has been used as a useful proxy to measure web ‘stickiness’, which enhances visitor-to-buyer conversion rate, and even leads to online loyalty.
Web Site visit duration is important for several reasons. First, it positively contributes to maintaining user interest in a site, which leads to potential purchases. 2 These effects hold true for both short-term and long-term effects. 3 Second, web site visit duration is an extremely important factor to consider when online advertising decisions need to be made. Sites with longer visitor durations are more likely to be favoured for online banner advertising investments and even lead to stronger financial performances, measured by such indicators as higher monthly stock returns. 4
However, there are divergences in theories applied to explain web site visit durations. Some research has attributed visit duration to variables such as user demographics. 1 Another study explains web site visit duration as a function of task completion. 2 Overall, there is relatively little research on providing an underlying mechanism for explaining web site visit durations. Therefore, the motivation of this study is to fill this literature gap.
This study is organized as follows. We first review extant major Internet marketing studies that examine visit duration as their dependent variable or key construct in their research. Then we draw on the two-stage choice model literature 5 , 6 , 7 , 8 to propose a plausible web site visitation decision-making model that integrates a Stage 1 choice process and a Stage 2 choice process. We present and discuss our proposed model and empirically model results by applying real web analytics data from 94 e-stores in the United Kingdom as representations of real business web sites. These results are instrumental for validating our theorized model for explaining e-store shoppers’ behaviour.
Literature review and conceptual background
Visit duration is an important web site performance indicator 9 and a measure for depth of web visit. 10 Technically, web site visit duration is the estimated daily visit duration (mm: ss) for a target web site under investigation. Therefore, visit duration is a standard industry measure for web ‘stickiness’, repeat visits and enhanced firm stock returns. 1
Overall, there is a consensus that web site visit behaviour typically follows a sequential process 11 where consumers go through a sequence of web pages, detailed browsing and navigation among pages. However, divergences occur among researchers when attributing the underlying mechanism for this process. One study 1 found that web site visitor demographics can be a key driving factor. Specifically, female and older users typically visit web sites for longer, based on 50 web sites sampled. A potential limitation of the study is perhaps that there was only one retail web site represented ( Amazon.com ), with the remaining sites mostly featuring portal, search and entertainment sites. This drastically narrows our understanding of visit duration for e-commerce web sites, particularly business-to-consumer retail web sites.
Other schools of thought drawing from behavioural underpinnings appear to be more compelling. Sismeiro and Bucklin 12 , for example, find that web site visitors’ different motivations determine their web site visit duration. Some visitors simply browse the web site for purposes such as knowledge building without any purchase intentions; others perform onsite search functions for more detailed product information, typically not just on the product category, but on even more detailed product specifications. Moe’s study 3 finds that, the more prepared the user and the more purposeful and effortful behaviour the web visitor exerts in engaging with this web site through completing a series of tasks, the more their search and engaging behaviour online exhibits sequential behaviour or activity, such that users with a task in mind are more likely to make purchase decisions on a site. It becomes critical to understand the other alternative underlying processes that lead to shoppers’ visit duration on an e-tailer’s web site.
Exploring information on the web by way of clicks or time spent are indicators of users’ cognitive effort in processing information for assisting their decision making. 13 In this study, the web site visit is posited as a decision-making process, where the web site per se is the object of the consumer’s visitation choice. The choice to visit an e-tailer’s branded web site can be decomposed into two stages (which is in line with the two-stage choice model), namely, a first stage of less effortful process, where web sites that are less interesting are eliminated, and a second stage, where shoppers engage in a more effortful viewing process (eg measured by page views per user as depth visitation behaviour) where they eventually spend quality time on the site.
Choice behaviour and choice models
In the consumer choice behaviour literature, a two-stage choice model generally serves as a base model where the consumer uses a non-compensatory screening rule to reduce the number of alternatives first (a process called Stage 1), followed by a more effortful compensatory process to arrive at a final choice decision (a process called Stage 2). 6 , 7 , 8 For example, consumers often apply non-compensatory decision rules to eliminate all options that do not meet some basic standards (eg they only buy well-known brands); they then give the remaining products a chance to make up for their shortcomings and balance out. In the literature, this decision-making model is commonly referred to as ‘consideration stage plus choice stage’ 14 or ‘consider-then-choose model’. 15
For instance, the purchase decision for ‘Ford’, ‘Dodge’ or ‘Chevrolet’ is a function of a consumer’s series of assessments of car attributes, such as price, size and fuel economy. 16 Gensch 5 proposes a two-stage choice model where Stage 1 is for attribute processing to screen alternatives down to a few choices; and Stage 2 is for brand processing, where a smaller set of choices are reassessed by comparing their attributes simultaneously. A body of literature is then built upon this notion and a general consensus is reached, where a two-stage choice model captures the consumer decision process well. 5 , 7
However, for the two-stage choice model, some challenges remain. First, because of data availability, consumers’ Stage 1 behaviour is typically latent, where their alternative elimination processes are unobservable. Research development, therefore, has been devoted to drawing on observed data to fill this knowledge gap. For instance, observed data could be consumer purchasing data 17 and online clickstream data for online purchases. 18 Other types of observed data are needed to conquer the latent process for Stage 1, the success of which could contribute to our understanding of consumers’ choice behaviour in Stage 1. Second, an often neglected area is that the transition from Stage 1 to Stage 2 is also latent, because of the fact that Stage 1 itself is unobservable, therefore rendering the boundary between Stages 1 and 2 unclear to marketing researchers — this would be a crucial limitation of the two-stage choice model, when the boundary of the stages could not even be empirically delineated, potentially undermining the theoretical value of the theory it represents.
In this study, we posit that e-shoppers’ decisions to visit an e-store follow a decision-making process where they deliberate and make further decisions to spend quality time on the site. To this end, we summarize our discussions in Figure 1 . Our conceptual model puts forward that consumer brand ratings (online) have a direct impact on decision-making stages (Stage 1 and Stage 2). With readily available web analytics data, the transition from Stage 1 to Stage 2 could be addressed by using analytics data on bounce from the web site, overcoming its traditional shortcomings as constrained by its unobservable nature. In the following section, we will discuss the hypotheses development and the model more specifically as presented in Figure 1 .

Brand ratings and their impact on decision making
Research model and hypotheses development
Figure 1 presents the specific constructs used to address our research questions. In this figure, the front half of the model (linkages between reach and bounce from site and linkage between search engine and bounce from site) explains the link between e-shoppers’ Stage 1 decision-making process by way of visiting these web sites. In line with these theories, we posit that web site reach is one of the most commonly used and important web site performance metrics. It is a success indicator for accessibility and popularity, which pertains to the number of unique visits to a web site. 19
Technically, the reach of a brand’s web site is calculated as the estimated percentage of global internet users who visit the target web site (eg Alexa.com ). An internet-specific metric, web site reach reflects consumers’ interests and trust in the utility of this product/service. Web site reach also accommodates the possibility that some consumers arrive at the target site by using search engine(s) because there are multiple ways of accessing a web site. Indeed, the use of online ratings for decision support reduces users’ decision time and also increases search behaviour to acquire more detailed and thorough information. 20 Some users keep a short-term memory of a brand’s site name or keywords and then use search engines to locate the web site address more specifically and accurately. Consistent with information systems literature and terminology used in web analytics, this paper defines the use of search engines to locate the brand’s web site as the estimated percentage of visits to the target web site that came from a search engine.
Web site visit behaviour is suggested to be increasingly captured by a sequential process. 11 One of the natural consequences for web site reach, however, is bounce from the web site. Bounce from the brand’s web site is defined as the estimated percentage of visits to the target web site that consist of a single page view. The break of such a search sequence, therefore, is captured by bounce from the web site, which is an observable measurement. Theoretically, bounce from a brand’s web site closely relates to consumers’ web visit intention for an intended goal.
In Figure 1 , we use a bold circle to highlight our latent variable called ‘bounce from site’ since bounce serves as a natural threshold for decision-making stages, in that people who view only one page of a brand web site terminate this visit as they eliminate this web site from their consideration set. Our argument is in line with Chimera and Shneiderman, 21 who state that the impact of web stimulus on keeping users’ attention is contingent on its web saliency relative to its context. Online optimal search literature explains that consumers stop their online search once their marginal cost of searching is larger than their expected marginal benefit of searching. 11 The consideration set draws to an end on the web site when consumers choose to leave the web site after viewing its first webpage — this is true whether consumers are those who reach the web site naturally or those who performed a search.
To e-marketers, consumer bounces away from the web site result in online customer attrition 22 and eventually reduce their visitor-to-buyer conversion rate and retention. 23 Plaza 24 maintains that a lower bounce rate is a positive signal for web stickiness and higher rate of return visits. E-marketers have long recognized the benefits of leveraging search engines to boost their web site traffic. It is reasonable to postulate that web site reach either by natural reach or through search engines is proportionate to bounce rate from this web site. Research shows that consumer online search behaviour on firms’ web sites is critical to their final purchase decisions. 25
However, the signs for each are different: reach signifies more likely visit to a site, and therefore less likelihood of shoppers bouncing away from the site; use of search engine, by contrast, serves as a mental shortcut for elimination. Search engines cater for shoppers’ needs in searching for short-term memorized objectives. These objects are typically non-important and the switching costs for looking away from them are low. Specifically, for Stage 1 decision making, online search is an important step for consumers to explore the brands and products they are interested in.
Shoppers’ search engine usage behaviour can be seen as a proxy for elimination. Therefore, elimination using a search engine is positively related to bounce from site, as both processes reduce shopper interests in further engaging with web activities. Therefore, we hypothesize that:
Shoppers’ reach of e-store’s web site negatively relates to the bounces from this web site.
Shoppers’ use of search engines to locate the e-store’s web site positively relates to the bounces from this web site.
Consumers who do not bounce from the web site, but choose to further engage with the site, therefore enter a Stage 2 decision-making process. The remaining hypotheses relate to the Stage 2 decision-making process on an aggregate level (see ‘Stage 2 choice behaviour’ in Figure 1 ). Shoppers who stay in this decision stage have successfully completed their Stage 1 screening process, where a large volume of brand web sites are eliminated from their consideration set using non-compensatory rules. Prior studies indicate that the more purposefully consumers can perform certain online tasks (eg search, browse or sequential nominal user tasks), the more likely they are to make purchase decisions. 12
During this stage, therefore, consumers are typically involved in more effortful, compensatory decision behaviours, which is also true for online purchase decisions. 18 In line with the theory of web site visit sequential process, 11 consumers go through a sequence of web pages, detailed browsing and navigation among pages. Such customers’ web site visits are recorded as web site traffic data, which is an estimate of the brand’s web site’s popularity. Operationally, the site with the highest combination of visitors and page views is ranked number 1. Page view is an indicator of the success of a product web site. 26 Technically, it is the estimated percentage of global page views on a target web site (as provided in reports from web analytics software vendors, such as Alexa.com ).
The transition from Stage 1 entails a large number of brand web sites being reduced to a Stage 2 site choice — this requires a mechanism to stabilize consumers’ online choice behaviour. Theoretically, studies from Rodgers and Cannon 27 and Rodgers and Thorson 28 suggest that, during web site visits, participants who are originally information-seekers could potentially switch to a surfing motive while in pursuit of information. We posit that ‘page view per user’ and ‘web site traffic’ are two crucial mediators between web site bounce and our dependent variable, ‘visit duration’ (which is often used as a proxy for consumer online loyalty and retention in the literature).
Drawing on the strengths of web analytics data (a detailed discussion on data collection and validity follows in the Methods section), we found that the originally latent choice process became clearly observable and attainable to researchers. Added benefits lie in the fact that the transition from Stage 1 to Stage 2 could also be observed directly using the web site ‘bounce’ construct. Therefore, we hypothesize that:
(a) Bounce from an e-store’s web site negatively relates to consumers’ page view; (b) Bounce from an e-store’s web site negatively relates to the traffic of this e-store’s web site.
(a) Page views made by shoppers positively relate to shoppers’ traffic on this e-store’s web site.
Visit duration is another important web site performance indicator 9 and a measure for depth of web visit. 10 Visit duration is a standard industry measure for web ‘stickiness’, repeat visits and enhanced firm stock returns. 1 Technically, visit duration is the estimated daily visit duration (mm: ss) for the target web site. This is the dependent variable for our model that is to be used as a proxy for customer retention. Danaher et al. 1 report that, for the top 50 web sites they sampled, the overall visit duration, that is, the decision on reach and bounce from a brand web site, ranges from a minimum of 0.5 minutes to a maximum of 84 minutes. Intuitively — and particularly from an IS perspective — it appears that page view is proportionate to visit duration and traffic built on the same web site. However, as the underlying theoretical underpinning is that we link shoppers’ cognitive decision-making process with web analytics data/variables, we believe they strengthen the research model. Web information explorations by way of clicks or time spent are indicators of users’ cognitive processing information for decision making. 13 Therefore, we hypothesize that:
(b) Page views made by e-shoppers online positively relate to the time they spend on this web site.
Traffic on an e-store’s web site positively relates to the time e-shoppers spend on this web site.
Moderation effects
The number of external links to an e-tailer’s web site could alleviate the diminishing effect of web traffic caused by bounce from the site. 29 , 30 When there are a large number of external links, which bring more opportunities for a site to be visited, the speed of the causation of bouncing from site on web traffic is slower. When the number of external links to an e-tailer’s web site is low, the speed of attrition of web traffic is faster. Therefore, the impact of an e-tailer’s web traffic on visit duration can be moderated by its external links. 31 , 32 Such links bring extra resources to enhance the positive impact of web traffic, therefore contributing to the shopper’s visit duration on the e-tailer’s web site. Therefore, we hypothesize that:
(a) (Stage 1 Moderation): External links to e-tailer’s web site positively moderate the relationship between bounce from e-tailer’s site and web traffic built on this e-tailer’s web site.
(b) (Stage 2 Moderation): External links to e-tailer’s web site positively moderate the relationship between web traffic built on this e-tailer’s web site and customer’s visit duration.
Lastly, we have some sample-specific control variables in the model, which will be discussed in detail in the research design and data collection section.
Research design and method
We used web analytics data for this study. Web analytics data pertains to a generic categorization that usually includes, but is not restricted to clickstream data; search analytics (eg search traffic, top queries from search traffic, search queries with impact factor and advanced uses like search engine marketing); traffic statistics (eg traffic rank, reach per centage, page views percentage, page views/user, bounce per centage, visit duration and search percentage); and audience demographics for target web site (ie age, gender, education, has children and browsing location). Many firms now offer web analytics services with some selective data freely and publicly available. Although web analytics data measures web site traffic, its unit of analysis is at micro consumer level. This makes possible aggregate data for modelling individual choice behaviour. 33
Research on internet marketing increasingly draws on a large amount of objective user-generated and system-recorded data when users/consumers interact with the target web sites. It is a powerful theory development context where a new, computer-mediated environment and large-scale (national or global) data become available to researchers. Research applications of web analytics have been found in online advertising targeting, 34 e-commerce, web design, internet strategy and, more generally, online consumer behaviour, for instance online search and browse behaviour, 12 , 35 , 36 , 37 user-generated social shopping 38 and choice behaviour. 18 , 39 Sometimes researchers collect ad hoc web analytics data for their specific research purposes (eg URL web pages, web crawling). 11
Web analytics data also has important methodological implications. For the focus of this study, the consumers’ Stage 1 decision-making process has traditionally been latent, where their decision rules and choice process are unobservable arising from the ‘data challenge’. 18 Yet, with the advent of internet-based consumer data such as clickstream data, marketing researchers can now explicitly model Stage 1 using observed data. This paper continues to use observed data to unveil the Stage 1 choice process using more general web analytics data beyond clickstream data. 11 The use of web analytics data could also unveil the unobserved decision-making process transition point from Stage 1 to Stage 2, where we argue that an aided non-compensatory process is taking place.
Essentially, web analytics data are aggregated data, that is, not on an individual basis. This gives an advantage for consumer choice research, because recent literature criticizes the attribute-based consumer choice models by arguing that sometimes product attributes are simply too complex for consumers to evaluate and for researchers to observe and capture. 40 This criticism could also be valid for experience products such as movies. 40 In this study, we therefore use aggregate brand-level data to research consumers’ brand choice (ie web site visits).
The dataset for this study was composed of a list of online retailers that only have internet presences, without any physical stores at all. Internet marketing literature typically labels the latter category ‘pure play e-tailer’. 41 Pure-play firms only or mainly conduct their business online. We started data collection from several sources. Our sample must satisfy three conditions: first, these e-tailers must be pure play e-tailers without physical stores; second, they must have web analytic data freely available from Alexa.com ; and third, they must have customer ratings scores, because we use these scores as control variables. Once the selection criterion was clear, the process of sampling was straightforward.
We visited BizRate.com to select a sample of e-tailers. BizRate is a reliable source for consumers to compare choice alternatives and make purchase decisions. 42 We found that customer online ratings in the ‘home and gardening’ products category best suited our research purpose because this category had the largest sample of retailers (1,042 e-stores at the time of data collection, that is, 3 months of web analytics data collected in January 2012) among which 139 e-stores also had web analytics data reported in Alexa.com . Other retailer categories rated by Alexa. com were much smaller — 78 out of 495 for ‘computer and software’; 93 out of 815 for ‘clothing and software’.
For the 139 e-stores, we manually visited each of their web sites to ensure they were in a working state and then collected their web analytics data from Alexa.com . Forty-five stores were removed from our final dataset because: (1) their web sites were not functioning; (2) there were missing scores in consumer ratings; or (3) they are multi-channel firms or general merchandisers or retailers. This eventually resulted in 94 complete observations with scores for both e-stores’ BizRate consumer online ratings and web traffic data from the past 3 months. Operationally, we measured each construct (see Table 2) three times with a 1-month interval (except for ‘links to site’ and ‘rating’, which were single-item constructs).
Many researchers have used BizRate data as a valid rating source and applied them on a cross-sectional basis, typically measured by a 90-day interval 43 or even a longer time span. 44 BizRate data has also been used as a source of secondary customer satisfaction information in assessing their decision-making behaviour 45 .
Analysis and results
Partial least squares (pls) structural equation modelling.
We chose to run our sample in the SmartPLS 2.0 M3 46 software for this study. In management information systems research, which typically measures information data that is often restricted by sample size, non-normal data and formatively measured latent variables, there has been an increase in the use of partial least squares structural equation modelling (PLS-SEM) over time in leading journals. 47
This study used reflective indicators 48 for our constructs, and therefore we evaluated reliability by means of composite scale reliability (CR) and average variance extracted (AVE). 48 , 49 For all measures used in our model, their CR scores were well above the cut-off value of 0.70 (see Table 1 ). Similarly, constructs’ AVE scores exceeded the cut-off value of 0.50, and therefore their root squares were larger than 0.70 (see bold diagonals in Table 2 ).
Furthermore, we observed our convergent validity by checking the standardized loadings of the measures on their respective constructs 48 and found that almost all of our measures exhibited standardized loadings exceeding 0.70. 50 The discriminant validity of the measures for our e-store sample were satisfactory.
Employing a bootstrapping technique, the path estimates and t -statistics were calculated for the hypothesized relationships (see Table 3 ). The results illustrate that 77.8 per cent of our hypotheses are confirmed.
Hypothesis 1 and Hypothesis 2 posit the two antecedents to bounce (rate) from the e-tailer’s web site, namely, the reach of customers on their web site and the use of search engine. Both relationships were supported: β =−0.280 (p <0.001) and β =0.364 (p <0.001). This confirms our contention that the search behaviour and reach behaviour are different in determining their choice decision from Stage 1 to Stage 2. The use of a search engine implies a low switching cost and exploratory behaviour, which is more likely to evoke a decision to bounce away from the site. In contrast, reach on a site indicates more determined customers for further and more effortful visitation behaviour.
For Hypothesis 3, we posit the negative causal relationships between bounce from the site and page views per user (Hypotheis 3a) and web traffic (Hypothesis 3b). For Hypothesis 3a, we found a strong negative effect ( β =−0.674, p <0.001), but we found a non-significant β value for Hypothesis 3b ( β =0.088, [n.s.]).Therefore, only Hypothesis 3a was supported. In Hypothesis 4, we hypothese the positive consequences of page view per user on web traffic and visit duration. We found that there was no support for page view per user in contributing to web traffic to an e-tailer’s web site, with a weak β =−0.085 ([n.s.]). However, there was strong positive support for the positive impact of page views per user on their time on the e-tailer’s web site, where β =0.911, (p <0.001). The impact of web traffic on visit duration (Hypothesis 5) has only a marginal positive effect — β =0.255, (p<0.10).
Our hypothesized two-stage moderation effects of links to site in Hypothesis 3b and Hypothesis 5 received some interesting findings. For the first-stage moderation, we hypothesized in Hypothesis 6a that if e-tailers have extensive external links to this site, it moderates the relationship between bounce from the site and web traffic. Although this link was statistically supported from our empirical test, with β =−0.326 ( p <0.05), the main causal relationship between bounce from site and web traffic was insignificant. Therefore, this moderation should not be supported. Next, we also hypothesized in Hypothesis 6b that the links to e-tailers’ sites would also moderate the causal relationship between web traffic and visit duration. This second-stage moderation was supported with β =0.393( p <0.05). To validate this claim, we run a baseline model where the causal effect of web traffic and site visit duration is non-significant, with β =−0.195 ( p =0.06 [n.s.]).
Lastly, to control for the effect arising from consumers’ online rating of e-tailer’s web site on visit duration, we collected additional data to test this effect. We manually collected our 94 e-stores’ respective peer consumer ratings using BizRate’s special section on ‘Customer ratings of stores’. The rating of 94 e-stores was based on smiling faces. We then transformed them into a Likert scale from 1 to 7, with 1 being least recommended and 7 being most recommended. Consistent with intuition, site rating is positively related to page view (site visit depth and engagement) and time on site (see Figure 2 in SPSS output). From a statistical perspective our PLS modelling results show no support for the relationship between customer web site rating and their visit duration effect ( β =0.003, [n.s.]).

Plotting customer e-tail web site ratings on page views and time-on-site
Overall, our endogenous constructs have high r -squared values supporting our research model where the construct ‘bounce from site’, serving as the switch from Stage 1 to Stage 2 choice model, has gained a good r -squared value of 0.22. The mediation effect of web traffic received an r -square value of 0.44 and our dependent variable, ‘visit duration’, was well-supported with an r -square value of 0.78. Therefore, we believe that the model is well-specified and supported by our empirical data (with 78 per cent of our hypotheses supported). For ease of reading, all our tested relationships are summarised in our empirical model in Figure 3 .

Empirical model
Limitations, conclusions and future research
To address the paucity of research into understanding shoppers’ web site visit duration, this study draws on the two-stage decision-making process as its theoretical base. Under this framework, we decompose shoppers’ decisions to spend time on a retailer’s web site into two stages. Each stage is supported by its unique web analytics data to fully operationalize our theoretical model. The first stage explains how e-shoppers arrive at the target web site. During this stage, it is used by shoppers to eliminate competing branded web sites. The latent variable, ‘bounce from site’, serves as a mediator for the transition between the Stage 1 and Stage 2 decision processes.
In Stage 2, we theorize that e-shoppers engage in more effortful and deeper engagement visitation behaviour. These process were operationalised in our model using web analytics data — that is, page view per user and web traffic — and we used visit duration as the dependent variable. We further examined the potential two-stage moderation effects by external links that the e-tailing site has exchanged with, and found links to site only moderate the relationship between web traffic and web site visit duration.
Overall, our study has several important benefits. Consumers’ choice behaviour in a retail setting is traditionally rich, but the degree of scholarly discussion is further complicated by consumers’ increasing switch to online settings. In this study, we capture the benefits of web analytics data and offer a few important implications both for marketing research and practice. First, our study adds to the existing literature in several ways. Our model innovatively operationalises the transition from Stage 1 to Stage 2 for decision makers, where bounce from the target brand’s web site provides such a metric (evidenced by strong and positive path loadings).
This change offers new insight for e-marketing to understand a new mechanism or a new theory explaining web site visit duration other than the user demographics approach found among a small number of other explanations. 1 This essentially means that the key driving forces for longer web site visits may not be fully attributed to a visitor’s gender and age as Danaher et al. 1 proposed, but deeper reasons arising from both shoppers’ cognitive and behavioural decision-making process. Our framework constitutes an internally consistent theoretical component of consumers’ external information search and internal decision-making processes, both integrated into a simple and logical structural equation model.
Second, based on our study, there are a few specific measures e-commerce web site developers should pay attention to in order to increase shoppers’ visit duration and to enhance business performance. For business investors, spending on search could bring immediate visitation to the site (ie Stage 1 behaviour), but not necessarily result in engagement evolving into Stage 2 behaviour for shoppers’ decision making. E-tailing web site webmasters could consider more external link exchanges with other partner web sites for referrals, in order to enhance site visit duration, which can engage more depth in visitors’ onsite behaviour, like page views. These are instrumental for visitor-shopper conversion rate.
Third, methodologically, empowered by data availability using aggregate web analytics data, our study also extends our knowledge beyond findings from subjective self-reported questionnaire data, in that we can now directly observe consumers’ choice behaviour in Stage 1 more objectively. This has significantly overcome the measurement difficulty in choice models where the Stage 1 consumer consideration-set formation process has traditionally been latent and unobservable, and unobtainable to marketing researchers.
Clearly, our study is not without limitations. The e-tailers in our sample are mainly selling selling garden and furniture products that are ‘searchable’ in nature. 51 These samples may be inherently less affected by consumer online rating. Many products can be categorized into search goods versus experience goods. Search goods are those attributes that could be assessed by consumers before purchase. In contrast, experience goods are those whose product characteristics are difficult to observe until consumption. Zhu and Zhang 52 recently stated that product characteristics actually moderate the influence of online consumer reviews on consumer purchase decisions and therefore impact product sales. To this end, it is reasonable and worthwhile to examine the types of product in future studies using experience products in the web site samples that are more likely to be affected by online consumer ratings.
There are also several avenues for further research. First, we used web analytics data on a market level. It would be interesting to capture a shorter time period where the publication of an online rating influences consumers’ decision making and to what extent and at which stage (ie Stage 1 or Stage 2, or both). We hope our data analysis will lend more explanatory power in parameter estimation.
Second, our study only uses visit duration as the dependent variable. Other measures, such as financial performance data, would possibly lead to interesting research questions by linking online ratings, consumer online decision making and firm performance. Third, like many choice behaviour modelling papers, we only focus on a linear view of the decision-making process that is composed of two stages — it would be of great interest if future studies could examine the so-called ‘feedback’ effects, where consumers form their own judgements and post a new rating online after they have personally experienced decision making and completed their web site visits and potentially made a purchase. Therefore, the peer-consumer rating would change its role from a control variable to an antecedent variable in future models. This type of research would require more substantial and longitudinal data acquisition and modelling expertise.
Danaher, P. J., Mullarkey, G. W. and Essegaier, S. (2006) ‘Factors affecting web site visit duration: A cross-domain analysis’, Journal of Marketing Research, Vol. 43, No. 2, pp. 182–194.
Article Google Scholar
Bucklin, R. E. and Sismeiro, C. (2003) ‘A model of web site browsing behaviour estimated on clickstream data’, Journal of Marketing Research, Vol. 40, No. 3, pp. 249–267.
Moe, W. W. and Fader, P. S. (2004) ‘Dynamic conversion behaviour at e-commerce sites’, Management Science, Vol. 50, No. 3, pp. 326–335.
Demers, E. and Lev, B. (2001) ‘A rude awakening: Internet shakeout in 2000’, Review of Accounting Studies, Vol. 6, No. 2–3, pp. 331–359.
Bettman, J. R. (1979) ‘Issues in research on consumer choice’, Advances in Consumer Research, Vol. 6, No. 1, pp. 214–217.
Google Scholar
Gensch, D. H. (1987) ‘A two-stage disaggregate attribute choice model’, Marketing Science, Vol. 6, No. 3, pp. 223–239.
Shocker, A. D., Ben-Akiva, M., Boccara, B. and Nedungadi, P. (1991) ‘Consideration set influences on consumer decision-making and choice: Issues, models and suggestions’, Marketing Letters, Vol. 2, No. 3, pp. 181–197.
Wright, P. and Barbour, F. (1977) ‘Phased decision strategies: Sequels to initial screening’. in Starr, M. and Zeleny, M., (eds) Multiple Criteria Decision Making: North Holland TIMS Studies in the Management Sciences, North-Holland Publishing Company, Amsterdam, pp. 91–109.
Turner, S. J. (2010) ‘Web site statistics 2.0: Using Google analytics to measure library web site effectiveness’, Technical Services Quarterly, Vol. 27, No. 3, pp. 261–278.
Dreze, X. and Zufryden, F. (1997) ‘Testing web site design and promotional content’, Journal of Advertising Research, Vol. 37, No. 2, pp. 77–91.
Kim, J. B., Albuquerque, P. and Bronnenberg, B. J. (2010) ‘Online demand under limited consumer search’, Marketing Science, Vol. 29, No. 6, pp. 1001–1023.
Sismeiro, C. and Bucklin, R. E. (2004) ‘Modeling purchase behaviour at an e-commerce web site: A task-completion approach’, Journal of Marketing Research, Vol. 41, No. 3, pp. 306–323.
Tam, K. Y. and Ho, S. Y. (2006) ‘Understanding the impact of web personalization on user information processing and decision outcomes’, MIS Quarterly, Vol. 30, No. 4, pp. 865–890.
Wu, J. and Rangaswamy, A. (2003) ‘A fuzzy set model of search and consideration with an application to an online market’, Marketing Science, Vol. 22, No. 3, pp. 411–434.
Liu, Q. and Arora, N. (2011) ‘Efficient choice designs for a consider-then-choose model’, Marketing Science, Vol. 30, No. 2, pp. 321–338.
Gensch, D. H. and Svestka, J. A. (1979) ‘An exact hierarchical algorithm for determining aggregate statistics from individual choice data’, Management Science, Vol. 25, No. 10, pp. 939–952.
Bronnenberg, B. J. and Vanhonacker, W. R. (1996) ‘Limited choice sets, local price response and implied measures of price competition’, Journal of Marketing Research, Vol. 33, No. 2, pp. 163–173.
Moe, W. W. (2006) ‘An empirical two-stage choice model with varying decision rules applied to Internet clickstream data’, Journal of Marketing Research, Vol. 43, No. 4, pp. 680–692.
Tarafdar, M. and Zhang, J. (2008) ‘Determinants of reach and loyalty — A study of web site performance and implications for web site design’, Journal of Computer Information Systems, Winter, Vol. 48, No. 2, p 16.
Xiao, B. and Benbasat, I. (2007) ‘E-commerce product recommendation agents: Use, characteristics and impact’, MIS Quarterly, Vol. 31, No. 1, pp. 137–209.
Chimera, R. and Shneiderman, B. (1994) ‘An exploratory evaluation of three Interfaces for browsing large hierarchical tables of contents’, ACM Transactions of Information Systems, Vol. 12, No. 4, pp. 383–406.
Chen, P.-Y. and Hitt, L. M. (2002) ‘Measuring switching costs and the determinants of customer retention in Internet-enabled businesses: A study of the online brokerage industry’, Information Systems Research, Vol. 13, No. 3, pp. 255–274.
Kuan, H.-H., Bock, G.-W. and Vathanophas, V. (2008) ‘Comparing the effects of web site quality on customer initial purchase and continued purchase at e-commerce websites’, Behavior & Information Technology, Vol. 27, No. 1, pp. 3–16.
Plaza, B. (2011) ‘Google Analytics for measuring website performance’, Tourism Management, Vol. 32, No. 3, pp. 477–481.
Drozdenko, R., Jensen, M. and Coelho, D. (2012) ‘Examining consumer online search behaviour: Websites, products, benefits and consumer characteristics’, International Journal of Business, Marketing & Decision Science, Vol. 5, No. 1, pp. 94–109.
Songvetkasem, T. (2011) ‘Identifying the common elements of a commercial web site by semantic ontology’, Future Information Technology, Vol. 185, No. 4, pp. 183–187.
Rodgers, S. and Cannon, H. M. (2000) The many faces of web users: An exploratory study of functionally-based web-usage groups, paper presented at the 2000 Conference of the American Academy of Advertising, Rhode Island.
Rodgers, S. and Thorson, E. (2000) ‘The interactive advertising model: How users perceive and process online ads’, Journal of Interactive Advertising, Vol. 1, No. 1, pp. 42–61.
Ratkiewicz, J., Flammini, A. and Menczer, F. (2010) ‘Traffic in social media I: Paths through information networks’, in Social Computing (SocialCom), 2010 IEEE Second International Conference, pp. 452–458.
Hernández, B., Jiménez, J. and Martín, M. J. (2009) ‘Key website factors in e-business strategy’, International Journal of Information Management, Vol. 29, No. 5, pp. 362–371.
Pantano, E. (2011) ‘Virtual cultural heritage consumption: A 3D learning experience’, International Journal of Technology Enhanced Learning, Vol. 3, No. 5, pp. 482–495.
Li, Y. and Wang, G. (2011) ‘Evaluate the result of consumer-to-consumer site promotion using correspondence analysis’, in Management and Service Science (MASS), 2011 IEEE International Conference, pp. 1–4.
Chen, Y. and Yang, S. (2007) ‘Estimating disaggregate models using aggregate data through augmentation of individual choice’, Journal of Marketing Research, Vol. 44, No. 4, pp. 613–621.
De Bock, K. and Van den Poel, D. (2010) ‘Predicting website audience demographics for web advertising targeting using multi-website clickstream data’, Fundamenta Informaticae, Vol. 98, No. 1, pp. 49–70.
Moe, W. (2003) ‘Buying, searching or browsing: Differentiating between online shoppers using in-store navigational clickstream’, Journal of Consumer Psychology, Vol. 13, No. 1–2, pp. 29–40.
Moe, W. W. and Yang, S. (2009) ‘Inertial disruption: The impact of a new competitive entrant on online consumer search’, Journal of Marketing, Vol. 73, No. 1, pp. 109–121.
Montgomery, A. L., Shibo, L. i., Srinivasan, K. and Liechty, J. C. (2004) ‘Modelling online browsing and path analysis using clickstream data’, Marketing Science, Vol. 23, No. 4, pp. 579–595.
Olbrich, R. and Holsing, C. (2011–2012) ‘Modelling consumer purchasing behaviour in social shopping communities with clickstream data’, International Journal of Electronic Commerce, Vol. 16, No. 2, pp. 15–40.
Bucklin, R. E., Lattin, J. M., Ansari, A., Gupta, S., Bell, D., Coupey, E., Little, J. D. C., Mela, C., Montgomery, A. and Steckel, J. (2002) ‘Choice and the Internet: From clickstream to research stream’, Marketing Letters, Vol. 13, No. 3, pp. 245–258.
Chung, J. and Rao, V. R. (2012) ‘A general consumer preference model for experience products: Application to Internet recommendation services’, Marketing Research, Vol. 49, No. 3, pp. 289–305.
Tojo, R. and Matsubayashi, N. (2011) ‘Competition between online and physical stores: The implications of providing product information by pure play e‐tailer’, Managerial and Decision Economics, Vol. 32, No. 5, pp. 281–292.
Papatla, P. and Liu, F.O. (2009) ‘Google or BizRate? How search engines and comparison sites affect unplanned choices of online retailers’, Journal of Business Research, Vol. 62, No. 11, pp. 1039–1045.
Posselt, T. and Gerstner, E. (2005) ‘Pre-sale v post-sale e-satisfaction: Impact on repurchase intention and overall satisfaction’, Journal of Interactive Marketing, Vol. 19, No. 4, pp. 35–47.
Weathers, D. and Makienko, I. (2006) ‘Assessing the relationships between e-tail success and product and web site factors’, Journal of Interactive Marketing, Vol. 20, No. 2, pp. 41–54.
Shockley, J., Roth, A. V. and Fredendall, L. D. (2011) ‘An information‐processing approach for evaluating in‐store setail operational design strategies’, Decision Sciences, Vol. 2, No. 3, pp. 619–653.
Ringle, C. M., Wende, S. and Will, S. (2005) SmartPLS 2.0 (M3) Beta, Hamburg, accessed at http://www.smartpls.de .
Ringle, C., Sarstedt, M. and Straub, D. (2012) ‘A critical look at the use of PLS-SEM in MIS Quarterly’, MIS Quarterly, Vol. 36, No. 1, pp. 3–14.
Chin, W. W. (1998) ‘Commentary: Issues and opinion on structural equation modelling’, MIS Quarterly, Vol. 22, No. 1, pp. 7–16.
Fornell, C. and Larcker, D. F. (1981) ‘Evaluating structural equation models with unobservable variables and measurement error’, Journal of Marketing Research, Vol. 18, No. 1, pp. 39–50.
Hulland, J. (1999) ‘Use of partial least squares (PLS) in strategic management research: A review of four recent studies’, Strategic management journal, Vol. 20, No. 2, pp. 195–204.
Nelson, P. (1970) ‘Information and consumer behavior’, Journal of Political Economy, Vol. 78, No. 2, pp. 311–29.
Zhu, F. and Zhang, X. (2010) ‘Impact of online consumer reviews on sales: The moderating role of product and consumer characteristics’, Journal of Marketing, Vol. 74, No. 2, pp. 133–148.
Download references
Author information
Authors and affiliations.
Manchester Business School China Centre, Suite 604, 6F, West Office Tower, Shanghai Centre, 1376 Nanjing West Road, Shanghai, 200040, China
You can also search for this author in PubMed Google Scholar
Corresponding author
Correspondence to Jiyao Xun .
Additional information
1 (PhD Nottm) is an associate MBA director at Manchester Business School, based in Asia.
Rights and permissions
Reprints and permissions
About this article
Xun, J. Return on web site visit duration: Applying web analytics data. J Direct Data Digit Mark Pract 17 , 54–70 (2015). https://doi.org/10.1057/dddmp.2015.33
Download citation
Received : 05 July 2015
Revised : 05 July 2015
Published : 30 September 2015
Issue Date : 01 September 2015
DOI : https://doi.org/10.1057/dddmp.2015.33
Share this article
Anyone you share the following link with will be able to read this content:
Sorry, a shareable link is not currently available for this article.
Provided by the Springer Nature SharedIt content-sharing initiative
- online retail
- choice models
- web analytics
- Find a journal
- Publish with us
- Track your research
- Sign up free
11 Website Visitor Tracking Tools
Website visitor tracking tools are now quite popular as they collectively provide a diverse range of features and capabilities to suit the needs of digital businesses to optimize their user experiences and driving success in the digital landscape.
Website visitor tracking tools are like your behind-the-scenes partners in understanding how people engage with your website as they track metrics like page views, click-through rates, and session duration, helping businesses understand what content is popular and what needs improvement.
Another important reason why digital businesses nowadays need to use website visit tracking tools as they identify their target audience more effectively. By analyzing demographics, location, and referral sources, businesses can modify their marketing strategies to better reach and engage their desired audience.
Here are the topics that we will cover in this blog:
What is Website Visitor Tracking?
How to choose the right website visitor tracker for your website.
- Kissmetrics
- Plausible Analytics
- Google Analytics
Website visitor tracking is the process of monitoring and recording the activities of individuals who visit your website as it involves collecting various types of data, such as page views, click-through rates, time spent on pages, and even demographic information.
These insights into user behavior let website owners and businesses to understand how users interact with their website. Also it can be used to optimize the website's content, design, and functionality to improve user experience and achieve specific goals, such as increasing conversions or improving engagement.
Metrics of Website Visit Tracking Tools
- Page Views and Visit Duration - Page views measure how many times a page is accessed, while visit duration indicates how long a visitor stays on a page. Both metrics are similar as they count engagment rate of the website visitors. Higher the page views and visit duration more your business is likely to achieve the first step of conversion.
- Referral Source - This metric reveals where visitors come from before landing on a website so that you can understand which channels or sources are driving traffic and visitors to your website.
- Geographic Location - Geographic location data identifies the physical location of website visitors, such as their country, region, or city to target specific regions or tailoring content to a local audience. Also businesses can be more concentrated with your geograohical locqation with more visitors and improve the marketing statergies.
- Device and Browser Information - This metric provides details about the devices and browsers used by visitors, including type, operating system, and browser version so that you can optimize the website for different platforms and fix errors with a knowldege on what possibilities the errors can be.
- User Behavior (Clicks and Interactions) - User behavior metrics track interactions on a website, such as clicks on buttons, links, and navigation elements as these insights into which features or content elements are most engaging.
- Conversion Events - Conversion events are specific actions, like form submissions or purchases, that indicate a successful conversion. Monitoring these events helps businesses understand what drives conversions and optimize the conversion process.
- Exit Pages - This metric indicates which pages users leave from. It highlights potential areas for improvement, helping businesses identify pages that may need attention.
- Time of Visit and Return Frequency - This metric tracks when visitors access the website and how often they return as it offers insights into user behavior patterns and can inform content scheduling and marketing strategies.
- Scroll Depth and Interaction Heatmaps - Scroll depth metrics show how far visitors scroll down a page, while heatmaps provide visual representations of user interactions to optimize content placement and design.
- Form Submissions and Abandonment Rates - These metrics track the number of form submissions and the rate at which users abandon the form-filling process as they provide insights into the effectiveness of lead generation forms.
Analaytics of Website Visit Tracking Tools:
- Behavioral Segmentation - Behavioral segmentation involves dividing visitors into groups based on their behavior on the website as this data is used to create highly personalized marketing campaigns.
- Customer Journey Optimization and Funnel Analysis - Customer journey analytics track the steps users take from initial visit to conversion. Funnel analysis helps identify conversion bottlenecks and optimize user paths.
- Heatmaps and User Interaction Analysis - Heatmaps visualize user engagement, showing areas of high and low activity as they provide insights into how users interact with a website's elements.
- Session Replay - Session replay allows businesses to record and playback user interactions on a website, providing a detailed view of individual sessions. It also offers insights into how users navigate, interact, and engage with the site.
- Speed Analysis - Speed analysis measures the loading times and performance of a website. Furthermore it provides data on how quickly pages load, which is crucial for ensuring a positive user experience and avoiding high bounce rates.
- Error and Uptime Monitoring - Error analysis monitor website performance, ensuring a seamless experience for visitors. Moreover, this helps address technical issues promptly and maintain a reliable online presence.
- Customer Lifetime Value (CLV) - CLV analytics assess the total value a customer brings over their entire relationship with a business. This metric is crucial for understanding the long-term impact of customer relationships on revenue.
To choose the right website visitor tracker, we shall look atter what are the features to be prioritized to gradually seek up to a result in improving the website.
Consider the Features You Need:
Prioritize your most needed metrics and analytics you would like to concentrate, like whether you need basic analytics, advanced behavior tracking, heatmaps, session recordings, or specific integrations with other tools.
Ease of Implementation:
Opt for a website visitor tracking tool that is easy to implement and integrate with your website. Look for options with user-friendly interfaces and clear setup instructions to ensure a smooth onboarding process.
Data Accuracy and Reliability:
Accuracy is paramount. Ensure that the your website visit tracking tool provides reliable data without significant discrepancies. You must always look for reviews or testimonials to measure the website visitor tracking tool's performance in this regard.
Privacy and Compliance:
With increasing privacy concerns, ensure that the tracker complies with relevant data security and protection regulations like GDPR or CCPA. It should offer features to handle user consent and anonymize sensitive data.
Scalability and Customization:
Your selected website visitor tracking tool should be capable of handling increased traffic as your website grows. Additionally, look for customization options that allow you to tailor tracking to your specific needs.
Using website visitor tracking tools definitely leads to more efficient resource allocation and ultimately, improved business performance gradually.
Here are the 11 website visitor tracking tools and how you can choose the one with the features that is right for your business.
1. ReplayBird
ReplayBird stands out as a leading website visitor tracking tool due to its ability to provide deep, actionable insights into user behavior like events, click trackings, and all kinds of gestures of the website visitors.
Its intuitive visualizations, session recordings, and segmentation capabilities let businesses to optimize their websites for an improved user experiences and increased conversions.
ReplayBird let your know all the actions and activities one by your website visitors in real-time, by being compliant to the data security and privacy.

User Behavior Analysis:
ReplayBird stands out in providing an in-depth understanding of user behavior on websites. It goes beyond surface-level metrics and delves into granular interactions, allowing businesses to see exactly how visitors engage with their content.
Interaction and Heatmaps:
One of ReplayBird's key strengths lies in its ability to transform complex data into visually intuitive insights. Through heatmaps, it offers a graphical representation of where users click, scroll, and interact which visualizes businesses to quickly identify areas of high engagement and potential pain points.
Session Replay:
As the top website visitor tracking tool ReplayBird's session replay functionality, let businesses to play back real user sessions which provides context by showing exactly how visitors navigate the site, where they encounter difficulties, and where they find value.
User Conversion Funnel Optimization:
ReplayBird places a strong focuses on conversion funnel analysis as it enables you to track user journeys step-by-step, identifying drop-off points and areas that may require optimization to ultimately boost conversion rates.
GDPR Compliance and Data Privacy:
With an increasing focus on data privacy, ReplayBird prioritizes compliance with regulations like GDPR. It ensures that user data is handled responsibly and with respect to privacy laws.
Hotjar is a comprehensive website visitor tracking tool that provides a range of features for understanding user behavior.
It offers heatmaps to visually represent where users click and scroll on a webpage, revealing popular areas and potential optimization opportunities. Hotjar also includes session recordings to watch real-time interactions to identify pain points and areas of interest.
Additionally, it provides surveys and feedback forms to gather user opinions, and funnel analysis to track user flow through conversion paths.

User Experience Analysis:
Hotjar provides a comprehensive suite of tools designed to analyze the complete user experience. From heatmaps to session recordings and surveys, it offers a 360-degree view of how visitors interact with a website.
One of Hotjar's strengths lies in its visual heatmaps, which offer an easy-to-understand representation of user interactions. These heatmaps show where users click, scroll, and spend the most time, providing clear insights into user behavior patterns.
Session Recordings:
Businesses can view session recordings, providing a firsthand look at how users navigate the site as it offers user behaviour context by revealing user interactions, behaviors, and pain points in real-time.
Feedback Surveys:
Hotjar let businesses to gather direct feedback from visitors through customizable surveys and feedback forms. This feature allows for qualitative insights, helping businesses understand user preferences, needs, and pain points.
Conversion Funnel Analysis:
Businesses can track user journeys from entry to conversion to identify drop-off points and areas that may require optimization boosting conversion rates.
3. Kissmetrics
Kissmetrics is another analytics platform focused on understanding customer behavior and improving conversions. It is great to track individual user journeys, for businesses to create highly personalized experiences.
It also offers A/B testing and segmentation tools for refining marketing strategies. By providing insights into user engagement, retention, and conversion metrics.

Customer Analytics:
Kissmetrics places a strong focuses on understanding individual customer behavior rather than aggregate data with detailed insights into the actions and preferences of each user.
Customer Journey Tracking:
One of Kissmetrics' standout features is its ability to track the entire customer journey across multiple touchpoints to see how different interactions contribute to conversions and customer retention.
Cohort Analysis:
Kissmetrics offers powerful cohort analysis, enabling businesses to group users based on specific criteria target marketing efforts and personalize experiences tailored to different customer segments.
Event Tracking:
Kissmetrics let businesses to track custom events, such as sign-ups, purchases, or specific interactions on the website provides granular insights into user actions and behaviors.
Funnel Optimization:
kissmetrics also offers detailed funnel analysis to track user progression through specific conversion paths to identify drop-off points and areas for improvement in the conversion process.
4. Crazy egg
Crazy Egg is a user-friendly website visitor tracking tool known for its intuitive visual reporting as it offers heatmaps, showing where users click, scroll, and interact on a webpage.
You can identify which elements are drawing the most attention. Crazy Egg also provides scrollmaps so that you can see how far down a page users typically scroll. Additionally, it offers overlay reports, which display the number of clicks on individual page elements.

Crazy Egg offers a graphical representation of user interactions on a webpage to quickly identify areas of high engagement and potential pain points.
Scrollmaps:
Crazy Egg provides scrollmaps, which show how far down a page users scroll to understand which content gets the most attention and ensure that important information is placed effectively on a page.
Clickmaps reveal where users click on a webpage and which elements, such as buttons, links, or images, are most interacted with, for a strategic placement and optimization.
5. Smartlook
Smartlook records visitor sessions, giving you a play-by-play of how they navigate and interact. It also creates heatmaps that visually show where they click, scroll, and move their mouse.
Smartlook tracks specific actions to get a deeper understanding. With its user-friendly interface, Smartlook makes it easy to find insights and improve your website's user experience.

Smartlook offers session replay of individual sessions to see and understand exactly how users navigate and interact with their site.
Smartlook's heatmaps visually represent user behavior which shows where users click, scroll, and spend the most time.
Funnel Analysis:
You can track user journeys from entry to conversion to identify drop-off points and areas for improvement in the conversion process.
Smartlook track custom events and interactions and provides granular insights into specific user actions, such as form submissions, button clicks, or product views.
VWO (Visual Website Optimizer) is a comprehensive conversion optimization platform. Which offers multivariate testing and split URL testing for more complex experiments. In addition, it provides heatmaps and session recordings to gain insights into user behavior.
VWO help businesses make data-driven decisions to improve user experience and increase conversions, making it a valuable tool for optimizing your website performance.

VWO offers heatmaps and clickmaps, which gives you a visualizations of clear insights into where users click, scroll, and engage the most to optimize page elements effectively.
The platform provides session replay feature to record and play back user interactions for a comprehensive view of individual sessions, helping businesses understand exactly how users navigate and interact with their site.
VWO offers robust funnel analysis to track user journeys from entry to conversion which helps identify drop-off points and areas for improvement in the conversion process, also boosts conversion rates.
Behavioral Segmentation:
VWO enables businesses to create personalized experiences based on user behavior and segmentation criteria which allows for targeted content and offers, improving user engagement and conversion rates.
7. Plausible Analytics
Plausible Analytics is a privacy-focused website analytics which keeps your things more simple and protecting your data as they do not collect cookies. Plausible serves up the basics like page views, bounce rates, and where your traffic's coming from, all without anything complicated.
So, if you're all about clear, privacy-conscious analytics that respect your visitors' rights, Plausible is a best option for all the insights you need, without compromising anyone's privacy.

Privacy-Focused:
Plausible Analytics gives you all the insights without relying on sneaky cookies or invasive tracking. This aligns with the growing demand for privacy-compliant analytics solutions.
User-Friendly Interface:
The tool boasts a clean and intuitive interface that it got an interface that is easy to navigate even for a non-tech and all levels of technical proficiency.
Visitor Metrics:
Plausible Analytics provides essential metrics like page views, unique visitors, bounce rate, and referral sources. These metrics offer a foundational understanding what makes your website tick.
8. Google Analytics
Google Analytics is an indispensable tool to understand and improve your online presence as it provides a wealth of data on how users interact with websites.
With features like goal tracking and conversion funnels, businesses can optimize their websites for maximum effectiveness. Google Analytics also offers real-time reporting and integration with other Google services, making it a powerful tool for data-driven decision-making.

Google Analytics offers a comprehensive view of user behavior, including metrics like page views, session duration, bounce rate, and more. This data helps businesses understand how users interact with their site.
Traffic Source Analysis:
Insights into where visitors are coming from, such as organic search, direct traffic, referrals, social media, and more to evaluate the effectiveness of various marketing channels.
Businesses can set up conversion goals in Google Analytics to track specific user actions, such as form submissions or purchases to understand the steps users take leading up to a conversion.
Heap Analytics is a website visitor tracking tool that excels in providing detailed insights into user behavior. Its unique approach to data collection and analysis sets it apart in the realm of web analytics.
Heap's automated data collection, detailed user behavior insights, and powerful segmentation capabilities et businesses improve user experience.

Automated Data Collection:
Heap automatically captures every interaction on your website, eliminating the need for manual event tracking setup without the hassle of setting up specific tracking points.
User Behavior Tracking:
Heap provides a comprehensive view of user behavior, tracking every click, form submission, page view, and more to give a deeper understanding of how users engage with your site.
Event and Funnel Optimization:
Heap allows businesses to define custom events and track specific user actions to understand the steps users take leading up to a conversion.
Matomo , formerly known as Piwik, is also an exceptional website visitor tracking and analytics tool. It offers a robust set of features to gain valuable insights into user behavior while maintaining full control over their data.
It has a self-hosted option, detailed analytics, and robust privacy features make it an attractive choice for businesses looking for complete control over their data. By using Matomo effectively, you can make informed decisions that lead to success in the digital landscape.

Self-Hosted:
One of Matomo's standout features is its self-hosted option as you can host the analytics platform on their own servers, providing complete control over their data and ensuring compliance with privacy regulations.
Matomo offers detailed insights into user behavior, including metrics like page views, session duration, bounce rates, and more.
Customizable Dashboards and Reports:
The platform let businesses create custom dashboards and reports, with specific metrics and Key Performance Indicators (KPIs) that are most relevant to your objectives.
11. Optimizely
Optimizely has a suite of features and intuitive interface make it a top choice of web optimization. You can put it as optimizely is the best experimentation, personalization, and feature deployment as its user-friendly interface, robust analytics, and integration capabilities make it a valuable asset for businesses looking to improve user experiences and drive conversions.

Analytics and Insights:
Detailed analytics and reporting with actionable insights into experiment performance and user behavior.
Compliance with Data Protection Regulations:
Optimizely prioritizes data privacy and compliance with regulations like GDPR as it ensures that user data is handled securely and in accordance with privacy laws, instilling trust in both businesses and their users.
Conclusion:
From ReplayBird's deep insights to Crazy Egg's intuitive visual reporting, each tool brings its own strengths to your digital business.
Whether you're focused on user behavior, conversion optimization, or privacy compliance, there's a tool tailored for you.
Remember, it's all about finding the right fit for your business. Consider what features matter most to you, how easy it is to implement, and, of course, the accuracy and privacy it offers.
So go ahead, take a closer look at these tools, and pick the one that aligns perfectly with your business goals. Here's to understanding your users better and creating top-notch digital experiences!
Keep Reading more about Analytics Tools

Try ReplayBird for free
- Responsive Website Design
- Application Design
- Landing Page Design
- Web Development
- Content Management
- Shared Web Hosting
- Managed Dedicated Server Web Hosting
- WordPress Maintenance
- Interactive Virtual Tour and Naming Opportunities
- Search Engine Optimization (SEO)
- Pay-Per-Click (PPC) Campaign Management
- Social Media
- Integrated Email Marketing System
- Email Design
- Constant Contact
- Content Development
- Public Relations
- Logo Design
- Tagline Development
- Corporate Identity Design
- Style Guide
- Custom Photography
- Direct Mail
- Printing Services
- Video Production
- Webmercials
- Market Research
- Competitive Analysis
- Brand Strategy
- Campground Marketing
- Associations
Website Statistics - Visit Duration

Visit duration or time on site is based upon user activity on a website. Basically it aims to report the duration of each visit to the website. Unfortunately each tracking method can collect this data differently and thus return different results. For log based reporting a true picture of activity is not provided – here is why. The only way a time duration can be determined is when more than one page is requested. The time of the initial request is subtracted from the time of the last recorded request resulting in the logging of a visit duration. Hosted solutions can work this a little differently. Google Analytics for example drops cookies on a users system to log specific requests. These cookies will mark the end of a visit when:
- The user closes the browser – navigates away from the site
- 30 minutes of time lapses between requests
- End of day occurs (initial request @ 12:56PM followed by second request @ 1:03AM will be logged as two visits
If users delete the cookies or don’t permit them then the data will not be collected.
No comments
- E-Commerce ›
B2C E-Commerce
Global online retail website visits duration 2015-2019, by device
Retail website visit duration worldwide as of 1st quarter 2019, by device (in minutes).
Additional Information
Show sources information Show publisher information Use Ask Statista Research Service
Q2 2015 to Q1 2019
all verticals
Data is based on 1.4 billion visits from 500+ million shoppers to 1,045 digital commerce sites in 37 countries.
Other statistics on the topic E-commerce checkout behavior
Digital Shopping Behaviour
Shopping cart abandonment rate worldwide 2022, by industry
Financial Services
PayPal penetration, online and offline, in 21 countries worldwide in Q1 2024
Global conversion rates in selected verticals 2023
Quarterly global online shopper conversion rate 2023, by country and region

- Immediate access to statistics, forecasts & reports
- Usage and publication rights
- Download in various formats
You only have access to basic statistics.
- Instant access to 1m statistics
- Download in XLS, PDF & PNG format
- Detailed references
Business Solutions including all features.
Other statistics that may interest you
- Global online retail website visits and orders 2023, by device
- Use of smartphones by shoppers in retail stores in France in 2015
- Transaction value of second-hand e-commerce in China 2015-2022
- Market size of social e-commerce industry China 2014-2022
- Social e-commerce industry growth in China 2015-2021
- Quarterly net revenue of Jumia Technologies AG 2017-2021
- Annual net revenue of Jumia Technologies AG 2017-2020
- Annual gross profit of Jumia Technologies AG 2017-2020
- Annual operating loss of Jumia Technologies AG 2017-2020
- Annual net loss of Jumia Technologies AG 2017-2020
- Etsy: share of international sellers 2020, by country
- Global online shopper preference for first-time & repeat purchases 2019
- Global online shopping cart abandonment reasons 2019
- Wayfair net revenue 2012-2022
- Wayfair annual income/loss 2012-2022
- Wayfair active customers 2013-2022
- Wayfair annual order volume 2013-2022
- Wayfair net revenue 2013-2022, by region
- Wayfair workforce 2014-2022
- Annual net sales of Amazon 2004-2023
- Unique visitors to most popular online retailers in India 2014
- Use of smartphones by shoppers in retail stores in Italy in 2015
- U.S. eBay retail e-commerce sales 2016-2020
- Most popular online shops by reach in Poland 2022-2023
- Net consumer online sales of bol.com 2012-2022
- Share of consumers who prefer Finnish online shops after the COVID-19 outbreak 2020
- Share of domestic and international online retail spend Australia 2017 by category
- Online shops with the highest number of complaints in China 2011
- Zalando: website traffic on desktop and mobile across all domains 2023
- Annual GMV of Jumia Technologies AG 2017-2020
- Number of registered sellers on Alibaba in Nepal 2015-2017
- Number of registered sellers on Alibaba in Myanmar 2015-2017
- Leading online marketplaces in Europe 2023, by monthly visits
- U.S. Amazon retail sales 2017-2021
- Key factors when shopping at a particular online retailer in the U.S. 2019
- U.S. online shopper preference for first-time & repeat purchases 2019
- Devices used to shop online in Denmark 2023
- MercadoLibre revenue share 2019-2023, by country
- MercadoLibre revenue 2012-2023
- MercadoLibre revenue 2023, by country
- MercadoLibre net income 2012-2023
- Mercado Libre revenue in Argentina 2015-2022
Other statistics that may interest you Statistics on
About the industry
- Premium Statistic Global online retail website visits and orders 2023, by device
- Premium Statistic Use of smartphones by shoppers in retail stores in France in 2015
- Premium Statistic Transaction value of second-hand e-commerce in China 2015-2022
- Premium Statistic Market size of social e-commerce industry China 2014-2022
- Premium Statistic Social e-commerce industry growth in China 2015-2021
- Basic Statistic Quarterly net revenue of Jumia Technologies AG 2017-2021
- Basic Statistic Annual net revenue of Jumia Technologies AG 2017-2020
- Basic Statistic Annual gross profit of Jumia Technologies AG 2017-2020
- Basic Statistic Annual operating loss of Jumia Technologies AG 2017-2020
- Basic Statistic Annual net loss of Jumia Technologies AG 2017-2020
About the region
- Basic Statistic Etsy: share of international sellers 2020, by country
- Premium Statistic Global online shopper preference for first-time & repeat purchases 2019
- Premium Statistic Global online shopping cart abandonment reasons 2019
- Premium Statistic Wayfair net revenue 2012-2022
- Basic Statistic Wayfair annual income/loss 2012-2022
- Premium Statistic Wayfair active customers 2013-2022
- Basic Statistic Wayfair annual order volume 2013-2022
- Basic Statistic Wayfair net revenue 2013-2022, by region
- Basic Statistic Wayfair workforce 2014-2022
- Basic Statistic Annual net sales of Amazon 2004-2023
Selected statistics
- Premium Statistic Unique visitors to most popular online retailers in India 2014
- Premium Statistic Use of smartphones by shoppers in retail stores in Italy in 2015
Other regions
- Premium Statistic U.S. eBay retail e-commerce sales 2016-2020
- Premium Statistic Most popular online shops by reach in Poland 2022-2023
- Basic Statistic Net consumer online sales of bol.com 2012-2022
- Premium Statistic Share of consumers who prefer Finnish online shops after the COVID-19 outbreak 2020
- Premium Statistic Share of domestic and international online retail spend Australia 2017 by category
- Premium Statistic Online shops with the highest number of complaints in China 2011
- Premium Statistic Zalando: website traffic on desktop and mobile across all domains 2023
- Basic Statistic Annual GMV of Jumia Technologies AG 2017-2020
- Premium Statistic Number of registered sellers on Alibaba in Nepal 2015-2017
- Premium Statistic Number of registered sellers on Alibaba in Myanmar 2015-2017
Related statistics
- Premium Statistic Leading online marketplaces in Europe 2023, by monthly visits
- Premium Statistic U.S. Amazon retail sales 2017-2021
- Premium Statistic Key factors when shopping at a particular online retailer in the U.S. 2019
- Premium Statistic U.S. online shopper preference for first-time & repeat purchases 2019
- Premium Statistic Devices used to shop online in Denmark 2023
- Premium Statistic MercadoLibre revenue share 2019-2023, by country
- Premium Statistic MercadoLibre revenue 2012-2023
- Premium Statistic MercadoLibre revenue 2023, by country
- Premium Statistic MercadoLibre net income 2012-2023
- Premium Statistic Mercado Libre revenue in Argentina 2015-2022
Further related statistics
- Premium Statistic Leading online retailers in Southeast Asia 2020, by monthly visits
- Basic Statistic Consumer electronics: Online purchasing in Great Britain 2020, by demographic
- Premium Statistic India: leading e-commerce categories 2013, by sales
- Basic Statistic Travel arrangements: Online purchasing in Great Britain 2019, by demographic
- Premium Statistic Walt Disney World Animal Kingdom theme park attendance 2009-2022
- Premium Statistic Universal Orlando Islands of Adventure theme park attendance 2009-2022
- Premium Statistic Most visited amusement and theme parks in North America 2022
- Basic Statistic Most visited amusement and theme parks APAC 2019-2021
- Premium Statistic Seaworld Florida theme park attendance 2009-2022
- Premium Statistic Most visited Latin American amusement and theme parks 2019-2022
Further Content: You might find this interesting as well
- Leading online retailers in Southeast Asia 2020, by monthly visits
- Consumer electronics: Online purchasing in Great Britain 2020, by demographic
- India: leading e-commerce categories 2013, by sales
- Travel arrangements: Online purchasing in Great Britain 2019, by demographic
- Walt Disney World Animal Kingdom theme park attendance 2009-2022
- Universal Orlando Islands of Adventure theme park attendance 2009-2022
- Most visited amusement and theme parks in North America 2022
- Most visited amusement and theme parks APAC 2019-2021
- Seaworld Florida theme park attendance 2009-2022
- Most visited Latin American amusement and theme parks 2019-2022
- Dragon’s Dogma 2
- Genshin Impact
- Honkai Star Rail
- Lego Fortnite
- Stardew Valley
- NYT Strands
- NYT Connections
- Apple Watch
- Crunchyroll
- Prime Video
- Jujutsu Kaisen
- Demon Slayer
- Chainsaw Man
- Solo Leveling
- Beebom Gadgets
30 Cool And Interesting Websites to Kill Time
1. Wayback Machine
ChatGPT has taken the internet by storm unless you’re living under a rock. The AI chatbot developed by OpenAI is set to revolutionize how we use the internet. ChatGPT is one of the best websites to kill time in 2024. You can ask the AI chatbot about anything and be ready to be surprised by the answers. If you are unsure about what to ask, you can give these ChatGPT prompts a try and have your mind blown.

Visit Website
7. Zoom Quilt
If you are a keen Netizen, you may have seen those trippy videos of artists where they zoom into a painting revealing multiple things, looping in to reveal another painting, and it’s never-ending. Zoom Quilt is a similar website that zooms in through multiple pictures and never ends, or does it? Only one way to find out.
8. This Person Does Not Exist

9. Little Alchemy 2
10. the oatmeal, 11. the useless web, 12. nautilus.

A great place to read informative and impeccably written articles dealing with a multitude of topics that can be broadly divided into science, history, psychology, and autobiography. If you are looking to learn while passing time, there’s no better place.
13. Forgotify
14. the onion, 15. i waste so much time, 16. gravity points.

17. Open Puppies
The website shows you GIFs and small videos of puppies and dogs which are just adorable. All the content is shown in full-screen high-quality mode. If you love puppies, you will love it here.
18. 100,000 Stars
19. every noise at once, 20. hotspot 3d.

21. ncase.me
22. how stuff works.
As the name suggests, the website focuses on detailing how stuff works. From soda fountains to tornados, you will find everything here. Everything is written in a short and easy-to-understand language. You will have fun and also learn a lot here.
23. Pixel Thoughts
24. orb.farm.

25. Lego Videos
26. supercook, 27. neal.fun.
Rounding off this list with a fun website that will keep you engaged for hours. Neal.fun is a collection of funny websites with some exciting games to play. Asteroid Launcher and Draw a Perfect Circle are our favorite games to kill time.
28. A Soft Murmur

29. OCEARCH Shark Tracker
30. ancient history encyclopedia.

Abubakar Mohammed
Abubakar covers Tech on Beebom. Hailing from a Computer Science background, the start of his love for Tech dates back to 2011, when he was gifted a Dell Inspiron 5100. When he's not covering Tech, you'll find him binge-watching anime and Tech content on YouTube, hunting heads in competitive FPS games, or exploring Teyvat in Genshin Impact. He has previously worked for leading publications such as Fossbytes, How-To Geek, and Android Police.
Amazing article, Give this type of content more!!!
Great article with a great list! Will try to write similar one for my own toptenhub!
Careful. Some of these can exacerbate existential anxiety.
Another hidden gem is Littler Books. It has good summaries of a lot of popular nonfiction books.
It’s truly a nice and helpful piece of information. I’m happy that you just shared this useful info with us. Please stay us up to date like this. Thank you for sharing.
itsyourmap.com is very cool website too. You can create and customize world map as you wish or you can publicly open to users.
This is a nice list. Since Lego videos are mentioned, how about ‘domino falling’ videos (strangely relaxing) and ‘marble running’ videos?
These are so helpful i liked them so much , thank you for the recommendations
We have good news for you. And the good news is that foreign students who need to optimize their finances to study in Canada have various options to consider, such as student loans. So, let us read this blog by All Assignment Help to understand all the aspects of an Expensive Canadian University when it comes to studying in Canada.
Women <3
Saya mau bermain
Some very cool sites. My personal favorite is dropicon.com
Wow! Thanks so much.
Hey i think this is a great list but beebom missed a gem. I would like to add blissfulnoises.com to this list to make it fully complete. It is an ambient sound generator website which you can use to relax or stud.
I went to the Lego one. But didn’t find the videos.
There are 3 icons in the top left corner, and one says “Videos”
anyone else notice there were to 36
There’s 50 on the list I’m seeing
Oh, a 2020 list! the list: You might like the Akinator game.
yea akinator was already there before i looked at this
really nice and amazing and cool and etc.,
Add new comment

- Cast & crew
- User reviews
Kingdom of the Planet of the Apes

Many years after the reign of Caesar, a young ape goes on a journey that will lead him to question everything he's been taught about the past and make choices that will define a future for a... Read all Many years after the reign of Caesar, a young ape goes on a journey that will lead him to question everything he's been taught about the past and make choices that will define a future for apes and humans alike. Many years after the reign of Caesar, a young ape goes on a journey that will lead him to question everything he's been taught about the past and make choices that will define a future for apes and humans alike.
- Josh Friedman
- Amanda Silver
- Freya Allan
- Kevin Durand
- Dichen Lachman
- 24 User reviews
- 89 Critic reviews
- 64 Metascore

- Proximus Caesar

- Youngster #1
- All cast & crew
- Production, box office & more at IMDbPro
The Big List of Summer Movies

More like this

Did you know
- Trivia Director Wes Ball 's pitch for the film was " Apocalypto (2006) with apes."
Proximus Caesar : What a wonderful day!
- Connections Featured in H-Cast: Insiders Expose Marvel! Blade Reboot, The Marvels & MORE! The H-Cast EP 78 (2023)
User reviews 24
- kevin_robbins
- May 9, 2024
New and Upcoming Sci-fi & Fantasy

- When will Kingdom of the Planet of the Apes be released? Powered by Alexa
- May 10, 2024 (United States)
- United States
- 20thcenturystudios
- Planet of the Apes Ride
- Helensburgh, New South Wales, Australia
- Disney Studios Australia
- Jason T. Reed Productions
- Oddball Entertainment
- See more company credits at IMDbPro
Technical specs
- Runtime 2 hours 25 minutes
- Dolby Digital
- 12-Track Digital Sound
- Dolby Atmos
- IMAX 6-Track
Related news
Contribute to this page.

- See more gaps
- Learn more about contributing
More to explore

Recently viewed
Advertisement
Supported by
Biden, Announcing A.I. Center, Highlights a Win of His and a Failing of Trump’s
The president’s visit to Wisconsin celebrated the investment by Microsoft in a center to be built on the site of a failed Foxconn project negotiated by his predecessor.
- Share full article

By Erica L. Green
Reporting from Racine, Wis.
President Biden on Wednesday announced the creation of an artificial intelligence data center in Wisconsin, highlighting one of his administration’s biggest economic accomplishments in a crucial battleground state — and pointing to a significant failure by his predecessor and 2024 challenger.
At the Gateway Technical College in Racine, Mr. Biden said the $3 billion project, which will be built by Microsoft, was an example of how he has delivered on promises that former President Donald J. Trump did not.
The Microsoft data center will be built on grounds where Mr. Trump, as president, announced in 2017 that Foxconn, the Taiwanese electronics manufacturer, would build a $10 billion factory for making LCD panels. Mr. Trump promised that it would be the “eighth wonder of the world,” and visited the site with elected officials and golden shovels. But the project never materialized as expected.
On Wednesday, Mr. Biden took direct aim at the failed promise. “Look what happened — they dug a hole with those golden shovels, and then they fell into it,” Mr. Biden told the crowd.
“During the previous administration, my predecessor made promises, which he broke more than kept, left a lot of people behind in communities like Racine,” Mr. Biden said. “On my watch, we make promises and we keep promises.”
In his fourth trip to Wisconsin this year, Mr. Biden continued his aggressive campaign to paint a contrast with Mr. Trump, the presumptive Republican nominee, who is in the fourth week of his criminal trial in connection with payments to a pornographic film star.
While in Wisconsin, Mr. Biden also attended a campaign event, where he spoke to Black voters about the 2024 election.
“I really think democracy is at stake here,” Mr. Biden told the crowd of about 100 volunteers and supporters. He also warned that another Trump administration would threaten his accomplishments, telling the crowd that “Trump means what he says.”
The Microsoft project is part of Mr. Biden’s “Investing in America” agenda , which has focused on bringing billions of private-sector dollars into manufacturing and industries such as clean energy and artificial intelligence. Microsoft expects that the new data center will create 2,300 union construction jobs and 2,000 permanent jobs.
Mr. Biden called Racine a “great comeback story,” after the once-booming manufacturing town lost the Foxconn project, and thousands of jobs, under Mr. Trump. Mr. Biden said Wisconsin had seen substantial job and manufacturing growth during his tenure. “We’re doing what has always worked in this country,” Mr. Biden said, “giving people a fair shot, leaving nobody behind, growing the economy from the middle out and the bottom up, not the top down.”
The Republican National Committee issued a statement during Mr. Biden’s visit calling it part of his “Bankrupting America Tour.”
“Joe Biden is trying to save face in Racine County as Wisconsinites feel the pain of Bidenomics,” Michael Whatley, chairman of the committee, said in the statement. “Manufacturing has stalled, family farms are shuttering, and costs are up for everything from electricity and gas to food and housing.”
The Foxconn factory was supposed to be one of Mr. Trump’s marquee domestic manufacturing victories: the first major factory run by the electronics supplier in Wisconsin, with a promised 13,000 jobs.
Instead, the company abandoned its ambitious plans and produced only a fraction of the promised jobs, even after receiving millions in subsidies and bulldozing homes and farms to build the factory.
In a statement issued Wednesday, Foxconn defended its record in Wisconsin, saying that despite “changes in market demand and other challenges,” the company “continues to grow with its community in Wisconsin.”
Microsoft plans to work with Gateway Technical College to develop a “Datacenter Academy” that trains 1,000 workers across the state for data center and science and technology roles by 2030, according to the White House. The company also said it would expand its “Girls in STEM” program to two additional middle schools.
Brad Smith, vice chairman and president of Microsoft, who is also a Racine native, said the project represented that “we are a country where people come together, where people work together, where they address hard challenges and we get great things done.”
Data centers can provide thousands of jobs to build, but they often do not require as many people to operate. The announcement’s focus on providing training, particularly for manufacturers, reflects a central anxiety over whether A.I.’s promise to boost productivity will kill more jobs than it can enable.
Microsoft has built a tight alliance with the White House, even as it has recently suffered damaging and embarrassing hacks by groups affiliated with China and Russia. The Biden administration has positioned Microsoft as a key partner to secure U.S. leadership in the race with China to develop A.I. Last month, it helped orchestrate Microsoft’s $1.5 billion investment in G42, an artificial intelligence giant in the United Arab Emirates, to put pressure on China’s influence in the Gulf.
(The New York Times sued OpenAI and Microsoft in December, claiming copyright infringement of news content related to their A.I. systems.
Karen Weise contributed reporting from Seattle.
Erica L. Green is a White House correspondent, covering President Biden and his administration. More about Erica L. Green
Our Coverage of the 2024 Election
Presidential Race
President Biden gave a speech on Holocaust remembrance as Donald Trump was in court with Stormy Daniels, a day that captured the sometimes unreal reality of a presidential race like none before it .
Robert F. Kennedy Jr. has faced previously undisclosed health issues , including a parasite that he said ate part of his brain.
Biden and Vice President Vice President Kamala Harris have been keeping up a busy schedule on Wednesdays , just as Trump takes a break from his trial.
A Foot Soldier for Trump: Republicans have spent years drawing Latino evangelicals into their fold. One pastor’s conversion shows how Trump is reaping the benefits .
Talk of Escape: At Washington dinner parties, dark jokes abound about where to go into exile if Trump reclaims the White House.
Insulin Takes Center Stage: Biden says lowering the cost of insulin for seniors is among his proudest domestic policy achievements. He now faces the challenge of selling it to Americans of all ages .
Politics Without Trump?: Democrats call Trump dangerous, while Republicans see him as revolutionary. For young Trump voters, he is just normal .
In a high-stakes test, Boeing will launch NASA astronauts to space for the first time
After years of delays, Boeing is finally set to launch two NASA astronauts to the International Space Station on its Starliner spacecraft.
The capsule is scheduled to lift off Monday at 10:34 p.m. ET, atop an Atlas V rocket at Florida’s Cape Canaveral Space Force Station. Astronauts Barry “Butch” Wilmore and Sunita Williams will pilot the Starliner on its inaugural crewed flight — a crucial final test before NASA can authorize Boeing to conduct routine flights to and from the space station for the agency.
The stakes are high. This will be Boeing’s first launch with humans aboard its spaceship, and it comes after years of delays, technical setbacks and significant budget overruns. If successful, the flight will enable Boeing to challenge the dominance held by Elon Musk’s SpaceX, which has been ferrying NASA astronauts to and from the orbiting outpost since 2020 .

Both companies’ spacecraft were developed under NASA’s Commercial Crew Program, which was established after its space shuttle fleet was retired in 2011. The goal: incentivize and help fund the creation of new, commercially built vehicles capable of flying to and from low-Earth orbit.
At a preflight briefing last week, Wilmore said safety is paramount and that previous Starliner launch attempts — both uncrewed and crewed — were delayed because the capsule simply was not ready until now.
“Why do we think it’s as safe as possible? We wouldn’t be standing here if we didn’t,” Wilmore told reporters.
Still, there are inherent risks with any new spacecraft or rocket.
“Do we expect it to go perfectly? This is the first human flight of the spacecraft,” Wilmore said. “I’m sure we’ll find things out. That’s why we do this. This is a test flight.”

The plan is for the astronauts to dock with the space station the following day and spend about a week there before returning to Earth and touching down at Starliner’s primary landing site in New Mexico’s White Sands Missile Range.
While NASA astronauts have for years been flying aboard SpaceX’s Crew Dragon spacecraft, the agency does not want to rely on a single company, said Makena Young, a fellow with the Aerospace Security Project at the Center for Strategic and International Studies in Washington, D.C.
“Having that second option is really important because it adds redundancy and resiliency,” Young said. “In space systems, there are always redundancies, because if something goes wrong, you want to make sure that you have backups.”

Boeing’s journey to this first crewed flight has been turbulent. In 2019, the Starliner’s uncrewed debut was cut short after software glitches prevented the capsule from attempting to dock at the space station. Subsequent fuel valve issues caused several delays before Boeing was able to successfully demonstrate in 2022 that the Starliner could dock at the ISS and return to Earth.
Earlier this year, Boeing’s aviation arm came under fire after a panel blew out midflight on one of its 737 Max 9 airplanes . That major mishap increased scrutiny of the entire company, and it likely raised the stakes for the upcoming Starliner flight, Young said.
“Having a successful launch will be an incredibly important reminder of [Boeing’s] capabilities,” she said. “They’ll be able to show that they are a reliable operator who is able to complete difficult missions and can continue to innovate.”

Young added that the challenges Boeing faced in getting the Starliner to this point show just how tough human spaceflight can be.
“I think that we forget because we’ve done it now for decades, but space is still a very difficult environment,” she said. “It’s actually very difficult to successfully get off the ground.”
Williams said she and Wilmore have confidence in the Starliner program and their mission ahead.
“We feel very safe and very comfortable when this spacecraft flies,” Williams told reporters earlier this week. “This is where we’re supposed to be.”
Denise Chow is a reporter for NBC News Science focused on general science and climate change.
IMAGES
VIDEO
COMMENTS
Websites 'Visit Duration' is the equivalent of Google Analytics' session duration, but with a small advantage. Similarweb puts data into context to provide you with ready-to-use data for your business decisions. First, you get to choose your business category, so you can compare your numbers to those of similar businesses. ...
Average time spent on a website, like average time on page, is dependent on a range of factors. Industry, the type of website, and even the device that users are on impact this average. For example, Statista calculated the 20 most popular websites worldwide as of June 2021, by time per visit. Users spent approximately 22 minutes and 44 seconds ...
Google Analytics calculates average session duration by dividing the total duration of all sessions (in seconds) during a specified time frame by the total number of sessions during that same time frame. For example, say in one week you had three website visitors: Visitor #1 spent 180 seconds on your site. Visitor #2 spent 60 seconds on your ...
While e-commerce leads for obvious reasons, visit duration also fluctuates across other website categories: News sites: 2 min 30 sec; Blogs: 2 min 15 sec; Social media: Over 10 min; As a consultant, I point out to clients that the in-depth, constantly updated content on news and blog sites naturally leads to higher engagement.
For example, 46% of businesses surveyed in 2022 saw monthly site traffic between 1,001 and 15K. 2023 HubSpot research says that almost 50% of websites get 4-6 page views per visit. And almost 2/3 of websites have an average bounce rate below 40%. Choosing the best website metrics for your goals is also important.
The average time spent on a web page ranges depending on the type of web page. For example, ecommerce pages can range from 44 seconds to 1 minute and 22 seconds. While blog posts can range between 2 to 5 minutes.. But the general sweet spot for good average time on a page, across industries, is around 53 seconds.. According to Gary Illyes, Google's Trend Analyst, "Dwell time, CTR, whatever ...
2023 Website & SEO Benchmarks. The median website gets 20,000 unique visitors per month, while the average is over 300K (However, the average is easily skewed by a handful of extremely high-traffic sites.) The average website gets 7 page views per visit. The average website has a bounce rate of 37%. The average site has an SEO click-through ...
Step 3: click on the pencil icon at the top-right corner and select 'Metrics'. In the bottom search box that says 'Add metric', type 'average session duration' to find it immediately. Hit the 'Apply' button. Step 4: now drag the metric above or below relevant metrics so they appear side-by-side when viewed in a report table.
The average session duration does not indicate how much time a user spent consuming content on a single-viewed page or the exit page. For example, if a user visits only one page and stays for seven minutes on your site (a bounced visit), the session duration still will be calculated as 0:00.
Across all industries, the median value of website sessions for April 2023 was 3.93K. Let's take a closer look at sessions across different industries: The Apparel & Footwear industry is the standout performer with the highest number of sessions, reaching 18.16K, which is nearly five times the overall median of 3.93K.
For meaningful analytics, segmentation is necessary, and I encourage you to view the following metrics by traffic source. 1. Traffic. The number of visits and visitors to your website, reported as sessions and users. Most often referencing the number of visits (sessions) to your site. Traffic, specifically number of visits, is a fundamental ...
Better Understanding Visit Duration and Conversion Rate. More than nine out of 10 marketers and businesses see content as a valuable business asset with 56 percent of businesses planning to spend more on content creation in the immediate future, according to 2020 survey by Siege Media. The inherent value of creating content is well understood ...
Visit Duration is a valuable metric in Google Analytics for gauging user engagement and the effectiveness of your website's content. However, interpreting this data requires understanding its limitations and the context of your site's user experience. While Google Analytics provides detailed insights, it can be complex for many users.
Avg. Visit Duration measures the average length of time users spend on your website during a session. This metric can help you understand user engagement and the effectiveness of your website content. With Databox you can track all your metrics from various data sources in one place. Avg. Visit Duration 2.190,879 Start tracking this metric.
Feb 1, 2024. Between January and November 2023, YouTube.com held the leading position as the most engaging website worldwide, with users spending approximately 35 minutes and 42 seconds per visit ...
Visit duration is an important web site performance indicator 9 and a measure for depth of web visit. 10 Technically, web site visit duration is the estimated daily visit duration (mm: ss) for a target web site under investigation. Therefore, visit duration is a standard industry measure for web 'stickiness', repeat visits and enhanced firm stock returns. 1
Similarly, facebook.com's average visit duration is 00:10:32 minutes, its average pages per visit is 9.54, and its bounce rate is 31.18%. instagram.com is a top Computers Electronics and Technology > Social Media Networks website that ranks in 4th place. On average, visitors remain on-site for 00:08:18 minutes and 36.09% of those visits ...
Page Views and Visit Duration - Page views measure how many times a page is accessed, while visit duration indicates how long a visitor stays on a page. Both metrics are similar as they count engagment rate of the website visitors. Higher the page views and visit duration more your business is likely to achieve the first step of conversion.
In this study, the authors examine factors that affect Web site visit duration, including user demographics, text and graphics content, type of site, presence of functionality features, advertising content, and the number of previous visits. The authors use a random effects model to determine the impact of these factors on site duration and the ...
The time of the initial request is subtracted from the time of the last recorded request resulting in the logging of a visit duration. Hosted solutions can work this a little differently. Google Analytics for example drops cookies on a users system to log specific requests. These cookies will mark the end of a visit when:
Published by. Stephanie Chevalier , Feb 16, 2023. This statistic presents the retail website visit duration worldwide as of the first quarter 2019, sorted by device. During the most recently ...
1. Wayback Machine. Wayback Machine is our favorite website to visit when bored. It's different from what its name suggests, i.e., it's a website, rather, a search engine that can be used to visit websites and find out how they looked in the past.
Kingdom of the Planet of the Apes: Directed by Wes Ball. With Freya Allan, Kevin Durand, Dichen Lachman, William H. Macy. Many years after the reign of Caesar, a young ape goes on a journey that will lead him to question everything he's been taught about the past and make choices that will define a future for apes and humans alike.
Elizabeth Bernstein; To Sleep Better, Change What—and When—You Eat The right foods and strategic scheduling can improve your shut-eye
Vietnam's foreign affairs ministry has annoyed the European Union by postponing a meeting next week with the EU's top official on Russian sanctions, ahead of a possible visit to Hanoi by Russia's ...
Marie Hardeman's site visit to a Lancashire farm Posted by: RPA Editor , Posted on: 8 May 2024 - Categories: External engagement In the first of a series of blogs from Customer Director, Marie Hardeman on her visits to shows, farms and projects, Marie writes about her time at a farm in Lancashire, with RPA field officers on a sheep ...
The president's visit to Wisconsin celebrated the investment by Microsoft in a center to be built on the site of a failed Foxconn project negotiated by his predecessor. By Erica L. Green ...
After years of delays, Boeing is finally set to launch two NASA astronauts to the International Space Station on its Starliner spacecraft. The capsule is scheduled to lift off Monday at 10:34 p.m ...