
Understanding Visits and Visitors in Google Analytics: Key Insights for Marketers
In the world of website analytics, data is king. For marketers and website owners, understanding the various metrics provided by tools like Google Analytics is crucial for making informed decisions that drive success. Two such metrics that often create confusion are 'visits' and 'visitors.' This article explains the difference between them, illustrates why this distinction matters, and provides insights into how you can leverage this knowledge to refine your marketing strategies.
The Difference Between Visits and Visitors
Before delving into actionable strategies and best practices, it is essential to clarify what we mean by 'visits' and 'visitors' in the context of Google Analytics.
Visits , also referred to as 'sessions,' represent a group of interactions that take place on your website within a given timeframe. A single visit can encompass multiple pageviews, events, social interactions, or ecommerce transactions. This metric provides a window into the level of engagement and the type of activity users undertake during a single interaction with your site.
Visitors , on the other hand, are segmented into two categories: new and returning. The 'visitors' metric tracks unique individuals who visit your website over a certain period. New visitors are counted the first time someone visits your site, while returning visitors are those who have been to your site before and have come back again. This metric gives you an idea of your site’s ability to attract and retain an audience over time.
Understanding the nuanced difference between visits and visitors is more than an exercise in semantics; it provides valuable insights into user behavior and site performance.
Why the Distinction Matters
The distinction between visits and visitors is critical for a number of reasons:
User Engagement : The number of visits can help you gauge the level of engagement of your audience. A high number of visits relative to visitors indicates that your site is engaging enough to encourage multiple sessions.
Audience Growth : Tracking new versus returning visitors helps you understand your audience's growth and loyalty. A healthy balance between new and returning visitors suggests that your site is not only attracting new traffic but also retaining previous users.
Content Strategy : By analyzing the behavior of visits and visitors, you can tailor your content strategy to meet the needs of your audience more effectively. For example, if you have a high number of returning visitors but low engagement, it may be time to refresh your content to re-engage your audience.
Leveraging Visits and Visitors in Your Marketing Strategy
Here are some practical tips on how you can use the insights gained from understanding visits and visitors to enhance your marketing efforts:
Targeted Content Creation : Use data on new versus returning visitors to create targeted content that addresses the needs and interests of each group. For instance, for new visitors, you might focus on introductory content that showcases the value of your product or service. For returning visitors, more in-depth, value-added content can encourage deeper engagement.
Personalized Marketing Campaigns : Segment your audience based on their interaction patterns and develop personalized marketing campaigns that resonate with each group. Returning visitors might be more receptive to email marketing campaigns that promote loyalty rewards or exclusive offers.
Optimize for Conversion : Analyze the paths taken by users who convert versus those who don't. This can help you identify what works and optimize the user journey for higher conversion rates.
A/B Testing : Utilize the insights from both metrics to conduct A/B testing on your site. Experiment with different layouts, content, and calls to action to see which variations positively affect visitor engagement and visit frequency.
How Flowpoint.ai Can Help
Flowpoint.ai is an AI-powered website analytics tool that offers a deeper understanding of website user behavior, including nuanced metrics like visits and visitors. With features like funnel analytics, behavior analytics, and AI-generated recommendations, Flowpoint.ai can help you fine-tune your marketing strategy by providing actionable insights into how users interact with your site. Whether you’re looking to boost conversion rates, optimize user journeys, or create more engaging content, Flowpoint.ai offers the tools and insights you need to succeed.
In conclusion, understanding the difference between visits and visitors in Google Analytics is essential for any marketer looking to fine-tune their strategy. By leveraging these insights, you can create more targeted, personalized, and effective marketing campaigns that resonate with your audience and drive measurable results.

Get a Free AI Website Audit
Related articles.

10 Common Mistakes to Avoid in Checkout Page Design
The checkout page is the culmination of a customer’s journey on an e-commerce website. It’s a make-or-break zone where design...

Stefania Duma

10 Customer Journey Analytics Tools to Boost Engagement
Discover the top 10 customer journey analytics tools that can help you to better understand user behavior and increase engagement...

10 Data Analytics Challenges and How to Overcome Them
Data analytics can pose significant challenges for businesses and analysts alike. This blog discusses 10 common data analytics challenges and...
Subscribe to our newsletter
Automatically identify UX and content issues affecting your conversion rates with Flowpoint's comprehensive AI-driven website audit.
Web Analytics. Actionable, at scale.
Manage cookies
FLOWPOINT ANALYTICS LTD
Company Number 14068900
83-86 Prince Albert Road, London, UK
© 2024. All rights reserved @Flowpoint
Page Views vs Visits: What’s the Difference (Beginner’s Guide)?

Tools like Google Analytics are essential for any website owner. However, if you’re new to tracking analytics, trying to interpret all the metrics on offer can seem overwhelming. For instance, the difference between page views vs visits can be hard to understand, as the terms sound very similar.
It’s important to clear up this confusion and know what you’re tracking, in order to make data-driven decisions. Fortunately, learning the distinctions between these two metrics isn’t hard, and it may change how you perceive your website’s success.
In this article, we’ll explore page views vs visits and discuss whether they can impact your search engine optimization (SEO) . We’ll also show you where to find these numbers in Google Analytics. Let’s go!
Understanding page views vs visits
A page view occurs whenever someone loads your site in their web browser. For instance, let’s say that a visitor finds your blog post through a search engine. However, one of their browser extensions prevents some of the content from displaying correctly, so they have to reload the page. In that instance, your analytics report will register two page views, even though the same visitor generated them (and in a short period of time).
On the other hand, a page visit happens whenever someone reaches your site from an external source, outside of your website’s domain . For instance, if a user finds your article online and then reloads the page, that still counts as one visit. However, if they navigate away from your website, search for a new keyword in Google, and then land on your page again, this will count as two visits.
To make sense of these metrics, it’s also important to take a look at your site’s ‘sessions.’ A session is the total time a user spends on your website within a certain period. During one session, your analytics tool will typically track all activities such as views and engagement with elements or forms.
A session typically expires after 30 minutes of inactivity ( at least as Google Analytics defines “sessions ). It’s a useful metric to track, as it can give more context to your views and visits.
Why understanding page views vs visits matters for your website
The primary reason these two metrics matter is that they can make you aware of potential problems on your site. For instance, contrary to popular belief, high page views don’t always mean you’re reaching a broad audience.
For example, suppose that your page views are high while visits are low. That could indicate possible user experience (UX) issues on your website. Your visitors might find your navigation confusing , or be unable to locate the information they need, causing them to visit the same pages repeatedly.
On the other hand, some pages might experience high views due to the nature of the content. For instance, readers tend to refer to instructional materials multiple times, so your tutorials might show higher views than other kinds of pages.
In some cases, high page views are a desirable metric, especially if you monetize your site with pay-per-view (PPV) ads. However, it’s generally best to strike a balance between page views and visits, in order to ensure that you’re providing the best possible experience on your site.
On the other hand, high page visits are generally positive, as they indicate that your website is popular. However, if your visits are high while the views are low, it could mean that your audience is not staying around long enough to convert. If that’s the case, it’s worth reviewing your CTAs and value proposition, to make sure they’re clear and engaging.
How page views and visits impact SEO
As isolated metrics, page views and visits are unlikely to be direct ranking factors. However, they might still influence your SEO to some degree. Search engines can use these numbers to calculate other significant tanking factors, such as the UX on your site.
For example, Google bots might interpret high page views as a sign that your website is popular. Organic traffic spikes can significantly boost your SEO, especially if referred from high-authority sites. However, the exact formula behind this calculation is unknown, so we can’t be such just how influential these metrics are.
What we do know is that Google favors websites that are engaging and easy to navigate. A high page view to visits ratio generally indicates that users are spending a lot of time on your site, which is a positive ranking factor. However, if your high page views result from poor UX or irrelevant content, that could negatively impact your SEO.
How to measure page views and visits with Google Analytics
Google Analytics gives you a wealth of information about your website. Provided that you’ve inserted your tracking code correctly (or used a Google Analytics plugin ), you can track all activities on your site, including page views and visits.
Note that Google Analytics uses slightly different terminology to describe visits. In general, it treats visits as ‘sessions’, and unique visitors as ‘users’. The latter metric is also broken down into two categories: new and returning visitors. This can all be a little confusing at first, but it helps to remember that ‘sessions’ will always be equal to or higher than ‘users’ (as the same person can visit multiple times).
You can access these details via Audience > Overview :

Google Analytics also enables you to track new and returning visitors in more detail. When you navigate to Behavior > New vs. Returning , you can compare metrics such as the average session duration, bounce rate, and conversions:

Note that you can also track a metric called ‘new users,’ which is not the same as ‘new visitors’. Google explains that it measures new user activity based on cookie usage, however, so these metrics will be very similar.
To learn more, check out our guide to the Google Analytics interface .
The concept of page views vs visits can seem confusing at first. However, once you understand the difference, it can help you identify potential issues on your website. For instance, high page views could indicate that your visitors can’t find the information they need, so it’s worth tracking it in conjunction with other data.
Let’s quickly recap the distinction between these two metrics:
- A page view occurs whenever a browser loads your site. Therefore, one visitor can generate many page views.
- A visit occurs whenever someone arrives at your page from an external source, such as Google search results or another website.
To start tracking all of these metrics, you can add Google Analytics to your site or use another web analytics tool.
Do you have any questions about page views vs visits? Let us know in the comments section below!
By John Hughes
Themeisle contributor.
John is a self-taught WordPress designer and developer. He has been working with the CMS for over a decade, and has experience operating as a freelancer and as part of an agency. He’s dabbled in everything from accessible design to website security. Plus, he has extensive knowledge of online business topics like affiliate marketing.
Updated on:
You can check also:.

10 Best Free Blogging Sites Hand-Tested for 2024…I Tried to Build a Blog for Free

All In One SEO vs Yoast SEO: Which Is Better in 2024

Naming Images for SEO: Here’s the Right Way to Do It

The SEO Framework vs Yoast SEO: Which Is Better in 2024?

How to Send a Mass Email in Gmail

How to Increase Organic Traffic to Your Website (7 Strategies)

7 Most Profitable Blog Niches for 2024 (Based On Real Data)

7 Best Grammarly Alternatives for Issue-Free Writing

10+ Most Popular Types of Blogs: Your Blogging Inspiration for 2024

7 Best Gmail Alternatives in 2024 (Most Are Free)

How to Use Gmail With Your Own Domain Name (Free Method)

How to Get a Free Email Domain: 4 Easy Methods

Do I Need a Website for My Business? 10 Reasons Why the Answer is Yes

13 Best Keyword Research Tools in 2024 (Including Free Options)

3 Ways to Use Canva on WordPress Sites – From Basic to Brilliant

3 Beginner-Friendly Ways to Reorder Posts in WordPress

20+ Blogging Statistics for 2024: Trends & Insights

How to Create a Blog Post Outline That Works! (In 6 Steps)
Or start the conversation in our Facebook group for WordPress professionals . Find answers, share tips, and get help from other WordPress experts. Join now (it’s free)!
- Privacy Policy
Most Searched Articles
Starting a blog without spending a penny is absolutely possible, and you’re in the right place to find out how to do it. Over the years, I’ve experimented with dozens of different blogging sites and tested how they perform for various purposes ...
How to Create and Start a WordPress Blog in 15 Minutes or Less (Step by Step)
Ready to create a WordPress blog? You've made an outstanding choice! Learning how to start a blog can be your path to an exciting new adventure. Lucky for you, WordPress is an excellent tool you can use for that. It's free, user-friendly, powerful, ...
The Complete Personal Blog Guide: How to Start a Personal Blog on WordPress
In this tutorial, we will lead you through all the steps you need to take in order to start a personal blog that is cheap, effective, good-looking, and that will set you up for future success. This is your ultimate guide to a personal WordPress blog ...
Handpicked Articles
How to make a wordpress website: step-by-step guide for beginners.
Even though it might not seem like so at first, knowing how to make a website from scratch is a must-have skill for today's small business owners. The following guide takes you by the hand and shows you all the steps to getting the job done with ...
7 Fastest WordPress Hosting Companies Compared (2024)
The web host you choose to power your WordPress site plays a key role in its speed and performance. However, with so many claiming to offer the fastest WordPress hosting out there, how do you decide which company to use? In this post, we'll look at ...
How to Install XAMPP and WordPress Locally on Windows PC
Want to install XAMPP and WordPress – aka. install WordPress locally? This is a great idea if you want a development site that can be used for testing or other purposes. XAMPP lets you run a website from your very own computer. And once you ...
Visits, visitors, unique visitors… what are the differences for the web analyst?

Today’s Web analytics solutions offer a multitude of measurement tools with comprehensive analysis options. Identified Visitors, Unique Visitors, Visitors, Visits , Viewed Pages or downloads are only a small part of it. At first glance, these standard measures seem very similar or even interchangeable, but they all say something different. To help you see more clearly, this article briefly presents the most important standard metrics and their meaning in AT Internet’ s Analytics Suite .
Visitors / Unique visitors / Identified visitors:
The term “ visitor” refers to a user who visits a website . However, a visitor is not considered as a single person but as a browser or a terminal . For example, a single user can access a website via different browsers (such as Google Chrome, Firefox or Microsoft Edge), different computers (at work and at home) or different terminals (smartphone and laptop).
If a visitor visits a page once in the morning and once in the evening, this user is counted as a single visitor with two visits. This same user will be considered a different visitor if they return to the site the next day. If we want a visitor who returns on another day to be counted only once, we must look at the metric unique visitors.
Unique visitor
The measurement of unique visitors is based on cookies . A cookie is a file placed on a browser that contains an anonymous identifier. This ID can be used to uniquely identify a browser.
As a result of this measurement method (which is the basis of all current analytical systems), inaccuracies may occur. For example, a browser may refuse to accept cookies, or a user may decide to delete them.
In most cases, however, a terminal has a cookie and is included in the calculation of unique visitors.
In the Analytics Suite , we distinguish between unique visitors who accept cookies and unique visitors who do not accept cookies. The latter category of visitors can be determined over a one-day period using the fingerprint method. The total number of unique visitors is therefore the sum of these two types of unique visitors.
In AT Internet’s Analytics Suite , you will find the analysis of unique visitors in the User Insights section. You can evaluate the frequency of visits, the retention rate or the terminals used.

Unique visitors are identical to visitors on a daily basis (Day 1: Unique visitors = Visitors = 3). If we now consider a period of several days, we obtain 8 Visitors (3+1+2+2+2+2, the Day Visitors are added together), and 3 Unique Visitors (deduplicated).
In the Analytics Suite , unique visitors can also be analysed on multiple websites (level 1).
Identified visitor
Identified visitors are measured using a unique identifier that is sent in the tagging when connecting to an authenticated space (login + password) and are common to all platforms (computer, tablets, smartphones…). It is this unique identifier that allows the cross-device analyses available in the User Insights module of the Analytics Suite.
Identified visitors should therefore not be considered as unique visitors. A unique identification of a unique user on different devices and browsers is only possible if the user actively identifies themselves. This is possible through a connection and can then be analysed using the “Identified Visitor” metric.
Visits, page views
A visit is defined as a visit to a website where at least one page has been loaded. Visits indicate a continuous process of using a website and should not be confused with the number of visitors, as a visitor may make several visits to the same site.
It should be noted, however, that the period during which each visit is counted only once may vary considerably.
AT Internet calculates this metric in this way: if a visitor does not perform a new action within 30 minutes, a visit is considered complete. The number of visits to a website is expressed in relation to a specific period (day, week, month…).
The visit is fundamental for the preparation of most analyses. The visit provides you with information on navigation (initial page, content viewed, exit page) and behaviour (duration, loads/page views, bounce rate, etc.).
This illustration shows two visits on five pages with all the associated information:

There are different types of visits:
- Total number of visits: Total number of visits in a given period
- Incoming visits: Visits with at least two pages viewed
- Bounce visits: visits with only one page viewed
The Analytics Suite can also evaluate visits without page loading, for example if a user has only seen one advertising element.
Limits of the “Visit” metric.
Imagine that a user visits and then leaves a website by turning off his computer or changing sites. 20 minutes later, he returns to the first site: he will always be considered to be in the same visit, which means that only one visit will be counted. On the other hand, if a visitor accesses a website through Microsoft Edge and returns to the site via Firefox 10 minutes later, two visits will be counted because the user will not be identified as the same visitor (the cookie varies from one browser to another).
A visit is not automatically closed when the browser is closed. In the field of digital analytics, it is unfortunately not possible to determine the exact time of exit from the site, because the user cannot send a specific message to the servers indicating that he has left the site.
This problem affects all web analytics solutions. Thus, as suggested by the DAA (Digital Analytics Association), AT Internet terminates a visit after 30 minutes of inactivity but this duration can be configured according to the needs of the site. This happens regardless of whether the browser is locked.
In AT Internet’s Analytics Suite , only one source of traffic is assigned to a visit, which is unique and unchanging. This means that the first source of a visit or the initiator of the visit is valid for the entire duration of the visit.
A page view is the loading of a page from a website or application. Each page viewed generates a hit that is sent to AT Internet. Each of these occurrences increases the “page views” metric by 1. the following graph illustrates its operating principle:

1. The User requests to load a page on the Site’s host server.
2. This server returns the page content (images, texts, etc. and the JavaScript code of the Internet AT tag).
3. The JavaScript tag is executed on the online user’s computer and collects information.
4. The tag requests an image on the Internet AT server and transmits the collected information as parameters.
5. The Internet AT server returns the requested image (1 pixel x 1 pixel, transparent).
If two tags were placed on the same page, each load of that page would be counted twice.
In summary:
A visit is a user’s journey through the site or application. A visit contains one or more page views. As soon as a user is inactive for 30 minutes because he has left the site or remained on the same page, a visit is considered complete.
A visitor is a user of a website. If a visitor visits a page several times a day , with interruptions of more than 30 minutes, AT Internet considers him/her as a unique visitor who has generated several visits. If a visitor visits the website on two different days, he or she will be counted as two visitors. If the AT Internet cookie is deleted after each visit, this visitor is considered a new visitor for each new visit.
On a single day, unique visitors correspond to the definition of “normal” visitors. However, if you look at a period of more than one day, these values differ due to the recognition of cookies. If a visitor has a cookie on his browser and visits the site twice on different dates, this visitor will be recognised as a unique visitor and counted only once in the analysis period.
Pictured example: A visit to a website can be compared to a visit to a hotel: a guest (unique visitor) can be a guest of a hotel several times during a month (visitor) and can enter and leave the hotel several times during a stay (several visits). In the hotel, the guest will move to different rooms (page views).
Gross range:
Gross reach refers to the sum of contacts made by an advertising medium during a given period on a target group. It does not take into account the fact that some people may have been in contact with the media several times, since, unlike the net reach, each contact is counted. The raw scope therefore says nothing about the exact number of people affected.
The raw scope depends on the information to be determined. Here are some examples:
- Raw scope of a website > Number of Visits
- Gross reach of an advertising banner > Number of banner loads
- Gross scope of an article on a website > Number of pages viewed (or uploaded)
Net reach refers to the number of people that an advertising medium reaches at least once during a certain evaluation period. It is expressed as an absolute value or as a percentage of the population. While the gross reach counts all contacts, the net reach deducts double or multiple contacts to give only the “exact” number of people reached by a publication.
In our Analytics Suite , the net reach is the value of unique visitors .
More than just measures: key performance indicators (KPIs)
You now know some of the most important key indicators for web analytics. For more information, see our more detailed article on the metrics analysed in Analytics Suite 2.
Need advice on defining the most relevant metrics for your objectives? Thanks to our free downloadable guide, you will learn how to define and analyse the right KPI’s according to your digital strategy:

DA Blog Editorial Team AT Internet’s editorial team and a diverse group of blog contributors work together to bring you insightful articles about digital analytics. Have feedback for us, or ideas to share? Want to see more on a certain topic? Get in touch!
Related Posts

5 Steps for Launching a Data Project in Your Organisation

Data Sampling: Quality Over Quantity

AT Internet’s Data Health Checklist
Comments are closed.

- Implementation & Tagging
- Analytics Tips & Tools
- Mobile, Apps & Cross-Device
- Data Governance & Strategy
- Digital marketing
- Beyond Analytics
- Analytics Suite
- Happening @AT
- AT INTERNET.COM
Can’t find what you’re looking for?
- 02 4929 2116
Introduction to Google Analytics: Visits, Visitors and Bounces
Google Analytics is a powerful tool for understanding who and how visitors are using your website. But for most website owners the array of features and tools that Analytics offers can be mind boggling. For that reason we’re producing a series of blog posts to help you get the most from Google Analytics: Introduction to Google Analytics. For those engaged in any online marketing or SEO , it’s doubly important to get the most from your Analytics.
So let’s get started by looking at some Analytics terms that are used regularly but are seldom understood:
- Unique Visitors
- Pages /Visit
- Avg. Visit Duration
Bounce Rate
Understanding what these terms actually mean is important to take full advantage of the features Google Analytics offers, so let’s take a look at each.
Let’s start with Page Views. Many people talk about how many “hits” a website gets. A “hit” is simply a file request made to the website server. This is a pretty useless metric that Google Analytics does not measure. Instead Google uses the term “Page View”. Every time a page is opened in a browser, weather it has been cached or not, it generates a page view. If someone hits the back or refresh button, a page view is counted as long as the tracking code is installed on the page in question.

Each visit by a person can consist of multiple page views. And a single person may have multiple visits over days or months. Once a website visitor closes the browser, the visit is considered over. Google Analytics focuses heavily on visits.

Unique Visitors and New Visitors
When a website is visited Google Analytics sets a cookie with a unique ID in the visitors browser. When someone visits your website, Analytics scans for this cookie to determine if this is a “Unique Visitor” or a “Returning Visitor”. If no cookies are found a new ID is set. It’s important to note that a user who clears their cookies, uses multiple browsers or shares a computer will show up inaccurately. The percentage of “New” visitors are also calculated this way.

A well crafted advertisement or strategically placed link can generate a lot of traffic to a page. However, once visitors reach your page, tracking how they interact with your website is a very important key feature of Analytics. A visitor who lands on your website, views only one web page and then leaves is called a “Bounce”. Generally a bounce occurs when someone comes to your website and either 1) immediately finds what they want and then leaves or 2) think the page/site is not relevant to their needs and leaves.

Pages Per Visit and Average Visit Duration
Pages/Visit is the average number of pages visited divided by visitors. In other words the Pages/Visit statistic displays the average number of pages viewed per visit to your site. Repeated views of a single page are counted in this calculation. This metric is useful both by its self as a total and when viewed with other measurements, such as country, visitor type, or mobile operating system.

- Total Visits Duration: 1000 minutes
- Total Visits: 100
- Average Visit Duration: 1000/100 = 10 minutes

- Content Marketing (99)
- Ecommerce (18)
- Online Advertising (102)
- Social Media (5)
- Uncategorised (2)
Subscribe to Gorilla 360
Receive monthly marketing news updates. All killer, no filler.
Other Articles
At Gorilla 360 we acknowledge the traditional custodians of the land on which we live and work. We recognise their ongoing connection to the earth and waters of Mulubinba and we pay respects to the elders and people past, present and future of this land.
SEO & Content
Advertising, get to know us, sydney office.
70 Mary Street Surry Hills NSW 2010
SEO Sydney Google Ads Sydney Facebook Ads Sydney Social Media Sydney
02 4929 2116 Contact Us
Brisbane Office
310 Edward Street Brisbane City QLD 4000
SEO Brisbane Google Ads Brisbane Facebook Ads Brisbane Social Media Brisbane
Newcastle Office
Level 1, 780 Hunter Street Newcastle West NSW 2302
SEO Newcastle Google Ads Newcastle Facebook Ads Newcastle Social Media Newcastle
Sessions vs. Users vs. Pageviews in Google Analytics: Everything You Need to Know

Table of contents

Enjoy reading this blog post written by our experts or partners.
If you want to see what Databox can do for you, click here .
Whether you’re new to Google Analytics or have been using it to track website performance for years, it is easy to get overwhelmed by all of the different metrics you can track
One of the biggest sources of confusion is around sessions vs. users vs. pageviews––what are the differences between these metrics? When should you track each of them? What unique insights does each metric provide?
In this post, we’re going to outline the key differences, how to track each one, as well as some advanced tips.
- What are users?
- What are sessions?
What are pageviews?
What is a good pages per session in google analytics.
- How to track sessions and users in Google Analytics
- How to track and visualize sessions and users in Databox
- Additional tips for tracking both sessions and users

What are users?
“Users” are Google Analytics’ way of defining unique visitors.
In fact, up until 2014, the user metric was called “unique visitors” in Google Analytics.
Any time a new visitor lands on your website, Google Analytics assigns them a unique ID, or client ID, that’s stored in a cookie in your browser.
So say you visited our website in Chrome, your Chrome browser received a Google Analytics cookie with a client ID. When you return, GA will then log you as a returning user rather than a new visitor.
If, however, you visit our website a second time, this time using Safari, you’d receive a separate client ID, and therefore GA would recognize you as two users.
“Users” and “Sessions” are vastly different, as one user can log multiple sessions on your website.
What are sessions?
Google Analytics records a session every single time someone visits your website. A session starts right away when someone loads a page and ends after 30 minutes of inactivity.
Every pageview, click, transaction, etc., tracked during this period of activity makes up one “Session.”
If that same visitor comes back several hours later, or the next day, a new session is counted. Therefore one person can log multiple sessions.
For that reason, it’s not a great measure for tracking unique website visits (which is how many marketers wrongly use this metric.) There’s often a discrepancy between “Sessions” in Google Analytics and “Visits” in other performance-tracking tools because of how GA defines a session.
As Bryan Ng of Coup 365 says, “Users are unique, and sessions are how many times a page was being visited. User (Z) can visit your webpage 10 times, and that counts 10 sessions and 1 user. User (Y) visits the same webpage 5 times, and that counts 5 sessions and 1 user. Webpage total: 15 sessions and 2 users.”
A “Pageview” is any view of a page that is being tracked by Google Analytics.
It’s a fairly generous measurement as if you land on a page, that’s a pageview. If you reload that same page, it counts as another. If you leave the page and come right back, it’s yet another pageview—all from the same page and user.
What’s the difference between sessions, users, and pageviews?
The biggest difference is that a user can have multiple sessions, but they would still only be counted as one user. Taking it a step further, one user can log dozens of pageviews across multiple sessions (spanning several days).
“A user is an individual person who has come to your site whereas a session represents one of those visits to your site,” says Mark Barrera of TrustRadius . “So, a person could come once or many times, and that wouldn’t increment the ‘user’ count but would increase the number of sessions.”
Amanda Lanier of Cape and Bay says, “Think users as the number of unique visitors coming to your website. Once they visit once, they will not be counted again unless they are visiting on a new device or have cleared their cookies. Sessions are the number of visits your site has, from both new and returning users. Tracking these metrics in Google Analytics is a simple way to see where users are landing and whether people are staying to engage with content or bouncing off the page.”
Ayushi Sharma of iFour Technolab adds, “Sessions – can be defined as the group of communications that happen on an individual’s website or application during a certain period of time. When any visitor visits on the website, his session cookies get activated i.e. his session starts. The significance of the session is that it provides the website owner an exact figure of the number of time visitors opened his website or an application and has carried out activities as well as transactions.
Users are basically the visitor who has begun one session with an individual’s website or either an application within a definite time-frame. There are new users and returning users, according to Google Analytics. Website owners can keep track of the number of users on your website using cookies based on JavaScript. This helps them to improve their website content and SEO.”
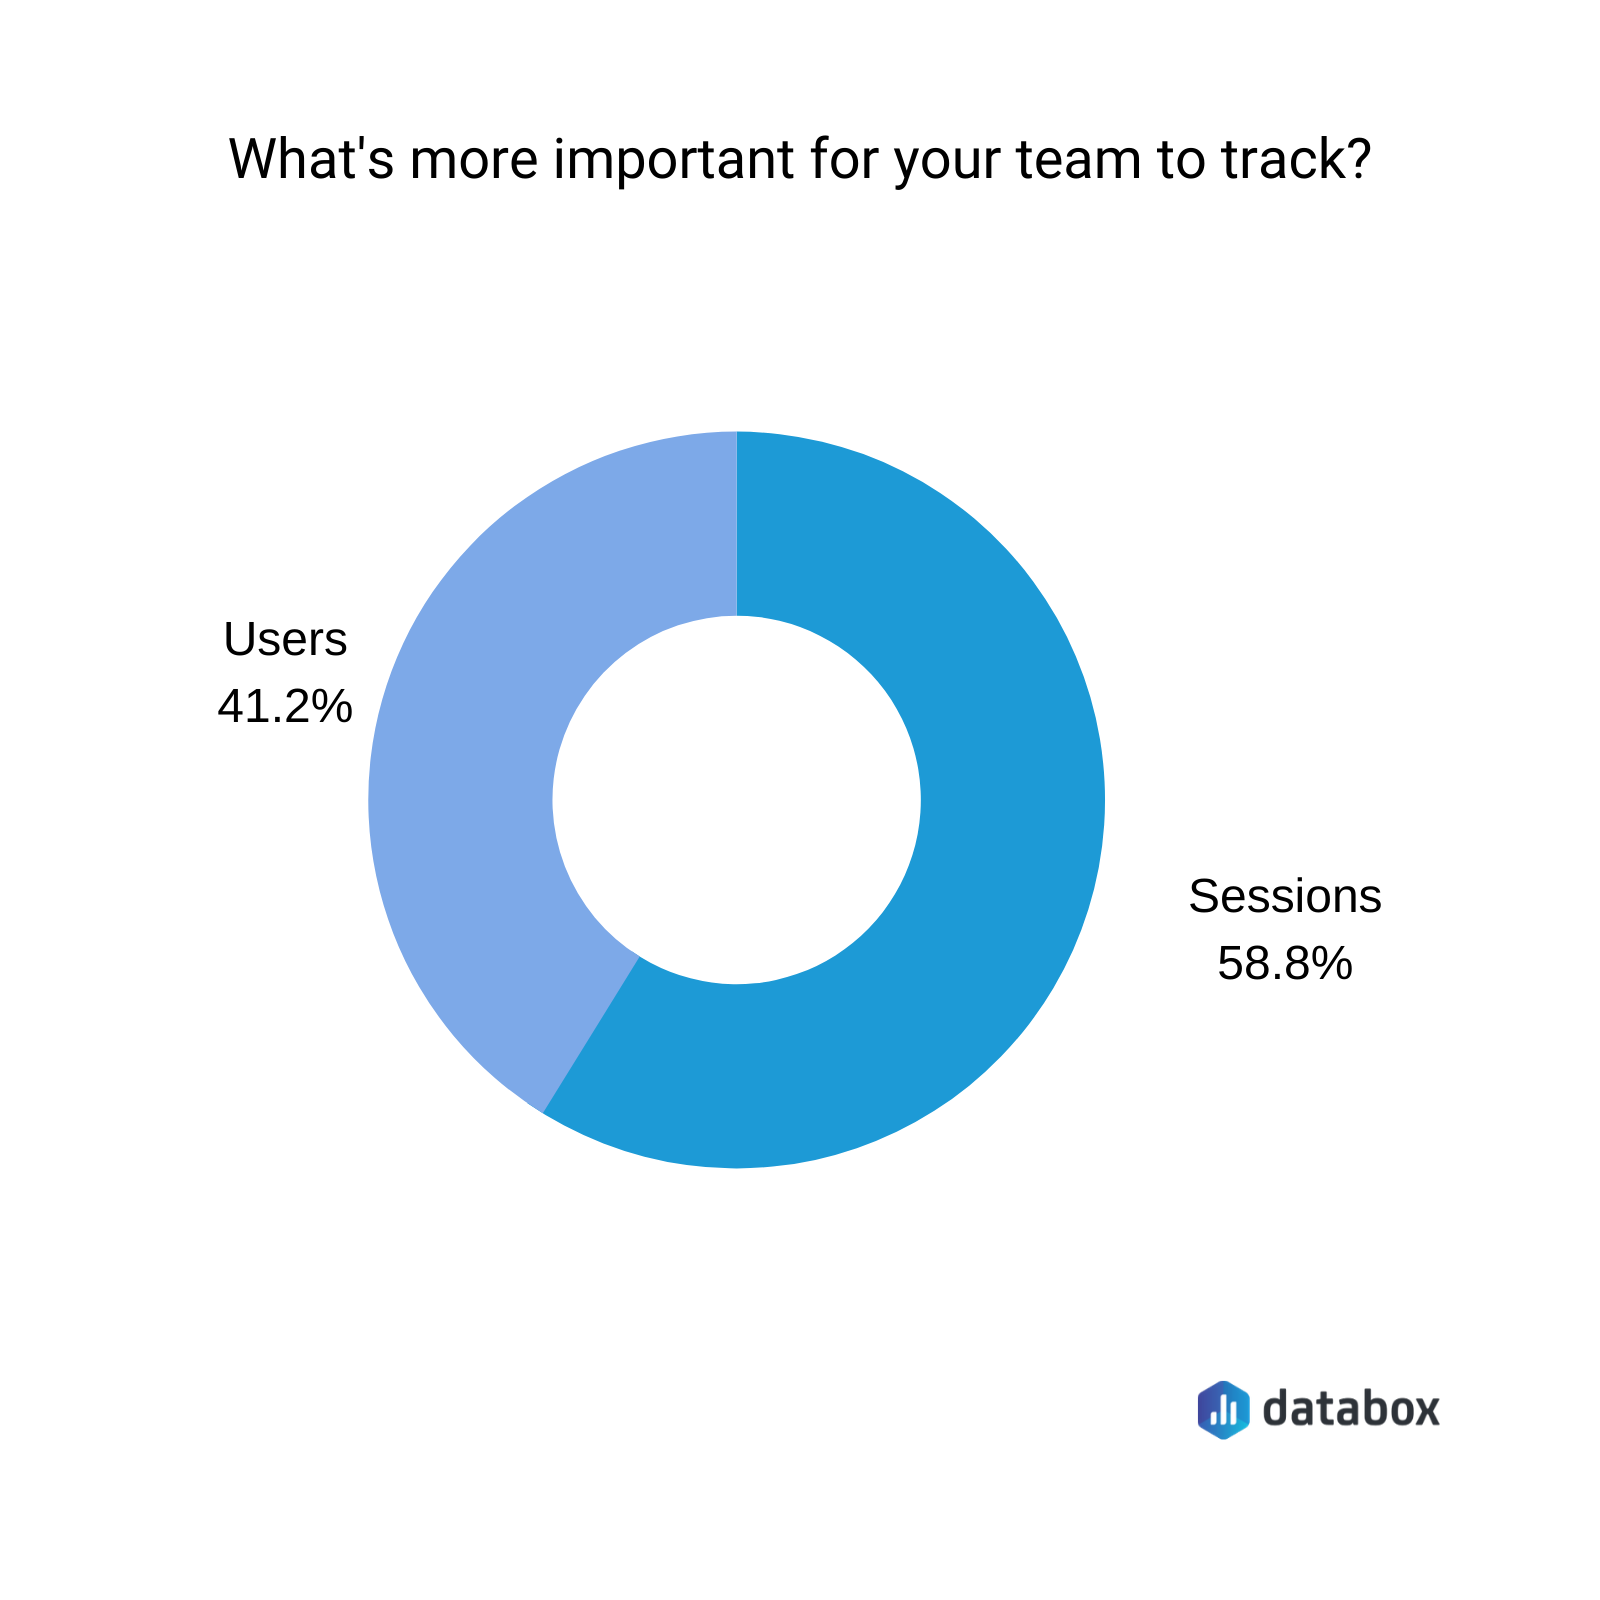
What is more important to track: Users or Sessions?
The answer is – it depends on your business and specific goals. For the marketers we surveyed, nearly 59% of them prioritize tracking sessions over users.
However, some of the marketers preferred a hybrid approach where they weighed users as more important for certain goals and sessions for others.
Greg Cruce of Venn Marketing says, “Sessions and Users together show us how often visitors come to our site.”
For example, Nicholas Zinkie of The Honey Baked Ham Company says, “I use sessions to track the overall flow to a site from specific channels as the first indicator of its effectiveness to lead top of the funnel traffic into a site and users to understand which channels are effectively engaging those visitors.”
“Sessions is a good metric to understand how attractive your site is and how well you’re doing as a marketer to attract users to your site,” adds Chris Wilks of BrandExtract . “Users are a good metric to understand the number of people who are seeing (and hopefully interacting with) your content.”
How many pages per session is good? According to Databox’s own Benchmark data, the median number of pages per session for B2B companies is 1.89 . This benchmark was calculated from anonymized data from close to 500 companies.
Are you a B2B company and want to benchmark your marketing performance, including Sessions, Users, Pageviews, Avg. Session Duration, Bounce Rate, and more, against other companies like yours? Join the benchmark group for free.

For B2C companies, the median value is higher – 2.05 , to be precise.
This benchmark was calculated from anonymized data from close to 500 companies. Are you a B2C company and want to benchmark your marketing performance against hundreds of other companies like yours? Join the Benchmark Group for free .

*Important note: Databox Benchmark Groups show median values. The median is calculated by taking the “middle” value, the value for which half of the observations are larger and half are smaller. The average is calculated by adding up all of the individual values and dividing this total by the number of observations. While both are measures of central tendency, when there is a possibility of extreme values, the median is generally the better measure to use.
Benchmark Your Performance Against Hundreds of Companies Just Like Yours
Viewing benchmark data can be enlightening, but seeing where your company’s efforts rank against those benchmarks can be game-changing.
Browse Databox’s open Benchmark Groups and join ones relevant to your business to get free and instant performance benchmarks.
How do you track Sessions and Users in Google Analytics?
Tracking the number of users and sessions in Google Analytics is simple using the Audience Overview Report.
You can go to Audience and then Overview . Then, you’ll be able to view the number of users and sessions side-by-side.

Now, you can take this a step further by going to the Acquisition section, and clicking on All Traffic.
Then, you can see the number of sessions, % of new sessions, and new users by channel, treemaps, source/medium, and referrals.
Filtering by Source/Medium can be particularly helpful for not only identifying your top traffic sources for new users but also understanding how “sticky” each source is.

You can also filter by Google Ad Campaigns, specific paid keywords, and UTM Campaigns.
To learn more about reporting in Google Analytics , check out our comprehensive guide that covers standard and custom report in GA, dimensions, metrics and much more.
How to track and visualize Sessions and Users in Databox
While you can certainly track sessions, users, and pageviews in Google Analytics, it’s not always easy to visualize the data in a way that’s accessible to everyone.
So, here are some recommendations on the different ways you can track these metrics in Databox as well as the various ways you can visualize them.
PRO TIP: How to track these 10 popular Google Analytics 4 metrics
Sure, there are dozens (and dozens?) more Google Analytics 4 metrics you could track. But, starting with these 10 commonly tracked metrics will give you a pretty high-level view of how your marketing is working…
- Sessions : The number of sessions can tell you how many times people are returning to your website. Obviously, the higher the better.
- Sessions by organic keyword : Which organic keywords bring in the most traffic to your website? This may help you determine whether your SEO investments are paying off.
- Bounce rate : Do visitors leave shortly after landing on your website? Or do they stick around?
- Average session duration : How much time are people spending on your website? Users with a high average session duration are most likely relevant to your company.
- Goal completions : How many users responded to your call to action?
If you want to track these in Google Analytics, you might find the visualizations limiting. It’s also a bit time-consuming to combine all the metrics you need in one view.
To better understand how your website performs in terms of traffic growth and conversions, we’ve made this plug-and-play dashboard that contains all the essential metrics for understanding how successful you are at optimizing different aspects of your website.

You can easily set it up in just a few clicks – no coding required.
To set up the dashboard, follow these 3 simple steps:
Step 1: Get the template
Step 2: Connect your Google Analytics account with Databox.
Step 3: Watch your dashboard populate in seconds.
This is the number of first-time users during a specified date range, such as the last 7 days, 30 days, month, or month-to-date. This is particularly helpful for understanding if your site is growing week-over-week or month-over-month.
You can visualize this using a basic line graph showing daily fluctuations. This will help you associate any spikes/dips with specific initiatives you’re running.

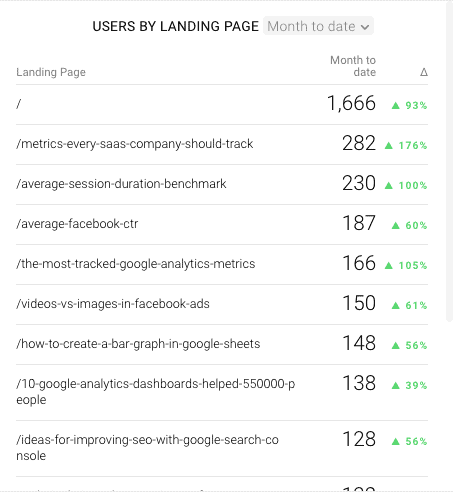
Sessions / Users by Landing Page
This is the number of sessions/users who have initiated at least one session during the specified date range split up by landing page. For example, if you are running a paid ad campaign, you’ll want to monitor the number of users on each landing page.
Visualizing this metric in a table format in Databox allows you to quickly spot which pages are increasing or declining in terms of generating new users over a specific time period.
Sessions / Users by Organic Keyword
Sessions/users who have initiated at least one session during the specified date range split up by organic keywords. Content marketers and SEO professionals can use this information to get a clearer picture of what search terms are driving the most users to their website.
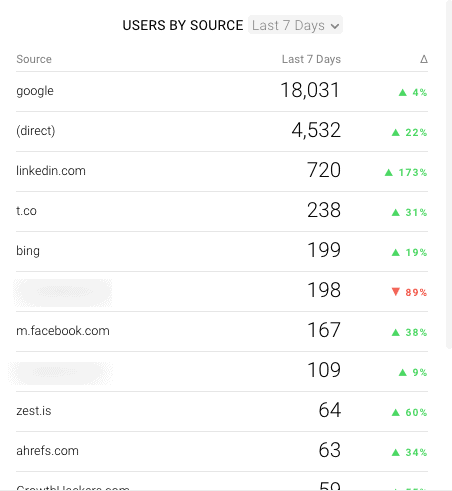
Sessions / Users by Source
Sessions/users who have initiated at least one session during the specified date range split up by sources. This allows you to understand what sources – like Google, Linkedin, or Twitter – are driving the most users to your website.
This allows you to monitor which channels are worth investing more time into and which ones might need an adjustment in terms of approach.
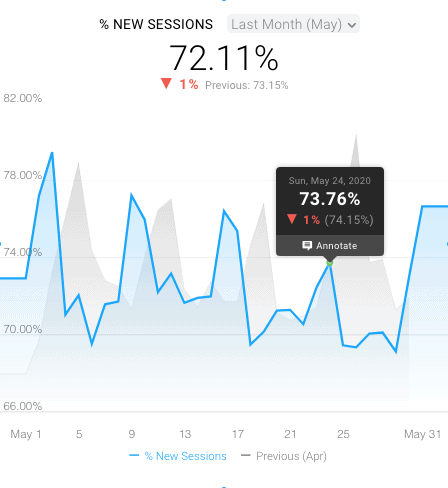
% of New Sessions
The percentage of sessions that are created by new users (first-time visits) during the specified date range. For example, if you have a high % of sessions from new users, this could indicate that your site isn’t sticky enough to get people to come back a second time.
This is another metric that’s helpful to view in a line graph in order to monitor daily fluctuations and how the content you’re producing is influencing it.
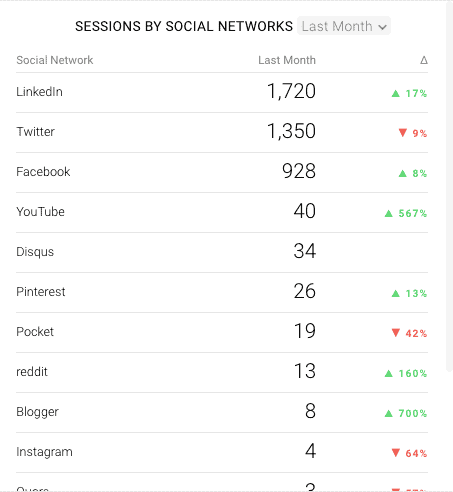
Sessions by Social Network
The number of sessions during a specified date range split up by social networks. This is helpful for understanding what social media channels, such as Facebook, Twitter, and LinkedIn, drive the most engaged visitors on your site.
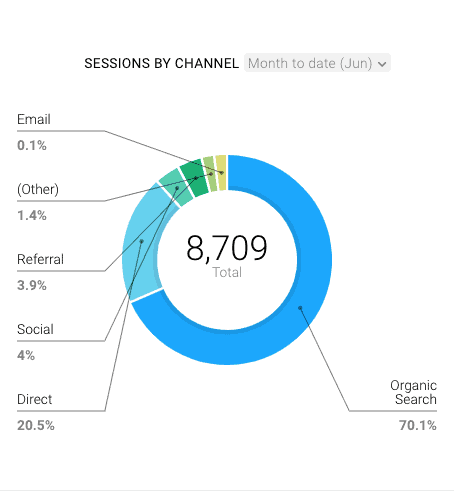
Sessions by Channel
The number of sessions during a specified date range split up by channels, such as Organic Search, Social, or Referrals. This is helpful for knowing which channels are delivering your most engaged traffic.
The pie graph visualization in Databox is perfect for tracking this metric so you and others can quickly monitor which channels are driving a higher proportion of website traffic.
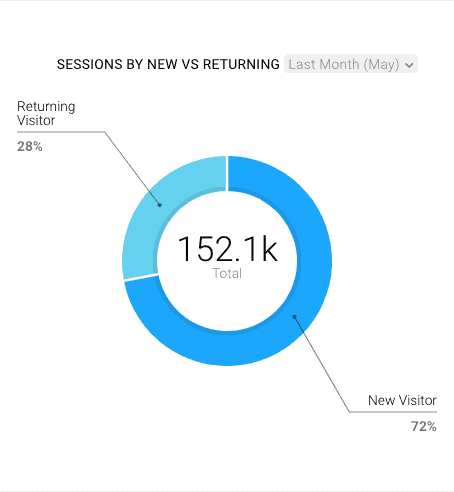
Sessions by New vs. Returning Users
The number of sessions during a specified date range split up by new vs. returning users. This allows you to see how engaged users are with your site. If you have a large percentage of users are completing multiple sessions, this means that your site is engaging.
Another great pie graphic visualization can be used here in Databox in order to quickly monitor how well your website performs in terms of generating new visitors as well as re-engaging “old” ones.
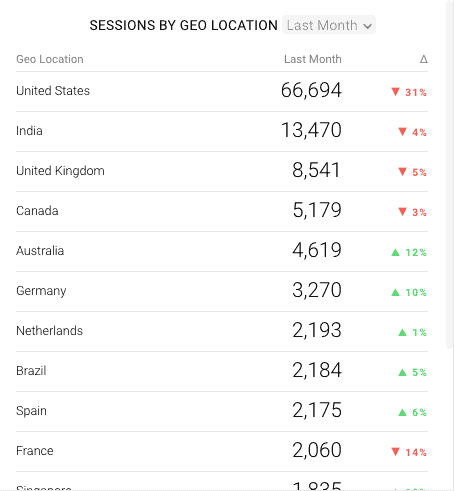
Sessions by Location
The number of sessions during the specified date range split up by location. This allows you to see which countries are driving the most engaged users.
Visualizing this in a table in Databox allows you to quickly spot any trends by specific locations so you can make any necessary adjustments to your strategy.
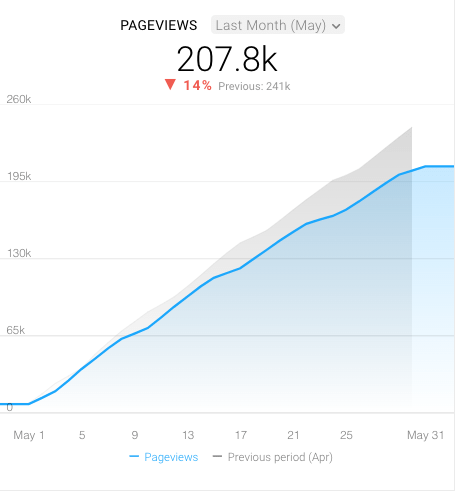
We recommend tracking Pageviews using a cumulative line graph so that you can more easily monitor growth (or declines) compared to performance month-or-over month.
Are your pageviews growing month-over-month? If not, you can spot it quickly here and make any needed adjustments.
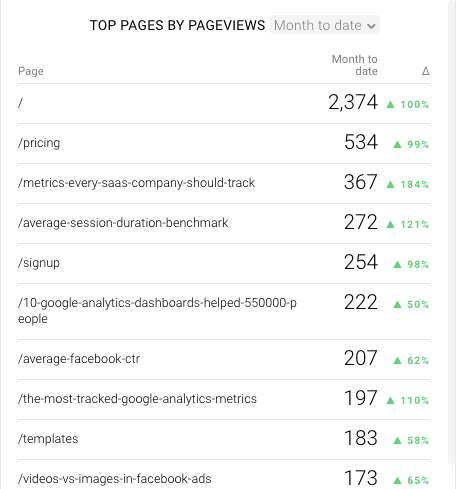
Top Pages by Pageviews
Which pages on your website generate the most pageviews? We recommend using the table visualization in order to quickly spot your high-performers so you can leverage them in other ways.
How to decide on when to track Users and/or Sessions
Decide on whether to prioritize sessions or users .
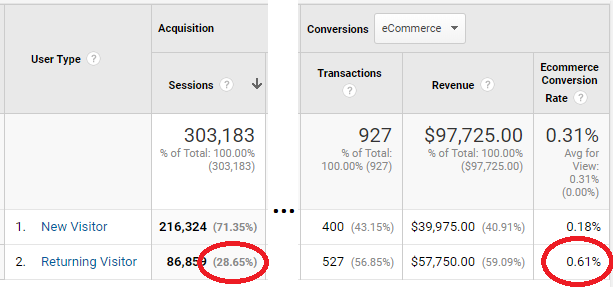
“There are strengths and weaknesses for each metric,” says Bruce Hogan of SoftwarePundit says. “Sessions tend to be better for understanding a website’s conversion rate, as each person can make multiple purchases over time. In contrast, users are a key metric for measuring retention or churn.”
Muhammad Tahir Iqbal of AbayaMarket.com agrees, “The important metrics for eCommerce business are sessions per user which correlate to eCommerce revenue.”
Jason Dodge of BlackTruck Media + Marketing adds, “Depending on the goals of your site, users or sessions could be viewed as more valuable than one another. We tend to see user metrics as more valuable than sessions, especially for those measuring lead generation. Any point of data gathering for a service inquiry or contact form means users are the most important.”
Nicholas Chimonas of Local SEO Guide says, “I’m more interested in user data when it comes to SEO than # of sessions unless a product/service typically has a high # of recurring sessions before conversion.”
“The advantage of users is they can be hooked by marketing automation,” says Tim Absalikov of Lasting Trend . “Also, from them, you can get more interesting demographic and behavioral information. This information will give you, in addition to obvious analytics, the ability to train the neural networks included in your marketing technology stack.”
Sarah Lukemire of Brindle Digital Marketing adds, “At Brindle, we mainly focus on the number of users, but sessions provide helpful insight into how loyal your users are, i.e. how often has that user revisited your site in the defined reporting period? Looking at Sessions can also be helpful when looking at the bigger picture of your goals and other metrics. For example, if your sessions have doubled, but conversions remained the same (or decreased), you might want to analyze the campaign further!”
Track sessions to gauge site engagement
“This metric matters because we discover whether visitors find our content valuable and want to visit our website again or not,” says Maysa Rabadi of The Perfect Mark . “It allows us to understand our customers and how we can better serve them as a website.”
Freya Kuka of Collecting Cents says, “The more important metric between the two would have to be sessions since that puts emphasis on how many times your website was viewed by an interested party. It is also the metric big ad networks like Mediavine use to consider people who want to join their network. They have a minimum requirement of 25,000 sessions per month.
The reason sessions work so well as a metric is because they have repeatedly been found to be the best metric at understanding how an audience is interacting with a website.
Users only focus on how many individual people are interested in your website, while pageviews do not account for the individual visitor at all.
Sessions are the perfect middle ground since they allow website owners to understand and make monetization decisions based on the available information.”
Or, as Shayan Fatani of PureVPN explains, “Think of sessions like impressions. The same person may get to see your Facebook post 100 times counting as 100 impressions. Similarly, if a user visits your page 100 times, it would count as 100 sessions, considering they use the same device or browser as the browser saves your cookies/session ids.”
Emanuel Petrescu of Divorce Marketing Group says, “The number of sessions and the time spent on the website is the metric we’re after. A high number reflects that the user found relevant content on our website, and he’s spending the time reading and learning it.”
“A user who has a high number of sessions is a good sign,” says Melanie Musson of AutoInsuranceEZ.com . “It means they’re interested and they’re likely to convert. If your session numbers are close to your user numbers, that’s an indication that the users aren’t hooked.”
Rahul Mohanachandran of Kasera adds, “When tracking these metrics you need to analyze them both together and separately, users will show the number of unique users of a product and session can show the repeated use of the system by individual users.
In many cases, more sessions from a user mean higher engagement and repeated use of the system. But, a large number of sessions with shorter session duration can be a sign of some issues faced by the user. I highly recommend looking into the details further if you see users with a large number of sessions and shorter session durations.”
Look for patterns
“The number of sessions on any site should always be higher than the number of users, however depending on the nature of your website and how users interact with it may not be significantly higher than user numbers,” says Daniel Richardson of Homes For Students . “Google Analytics is the easiest tool to use to track both users and sessions. When viewing your traffic, it is quick and easy to switch from sessions to users just by selecting in the drop-down menu. Do this frequently to ensure that there are no strange patterns appearing in users vs. sessions.”
Monitor user growth
“To a publisher like us, we’re interested in making sure the number of sessions we garner is greater than the number of users we have,” says Steven Li of Medius Ventures . “When we’re able to make that happen, it signals to us that we’ve done a good job with the pieces we publish such that we’re driving repeat traffic from the same people. That’s important to us as a partially subscription-driven business because higher engagement with specific users is what compels them to pay to read our exclusive content in the first place.
We look at user growth to track how well specific stories do with a broader audience, our top of the funnel, and generalize what makes them successful in motivating future stories.”
Analyze new vs. returning users
“As a website owner, it is very important to track and monitor what kind of users are visiting,” says Jennifer Willy of Etia . “The term ‘users’ in layman’s understanding means the number of unique visitors that visit your site. These are the actual people landing on your website, and that means that if someone were to visit your site 100 times on the same device or browser, they would still only count as one unique user. These are calculated as Returning Users, according to Google Analytics.
When a paid advertisement boosts the awareness of your website, the new user’s metric compared against Source and Medium is helpful in indicating how successful these efforts were at bringing in new users.”
Make sure you are bringing in quality traffic
“Even with your users and sessions going up (this is usually a good sign depending on the channel they’re coming from), the most important thing to keep in mind is if the traffic coming to your site is qualified,” says Ben Johnston of Sagefrog Marketing Group . “Are a percentage of users taking the action, making the purchase, etc that you want them to? Sessions and users don’t mean much if it’s all vanity traffic that doesn’t convert. That said, a single user can take that desired action multiple times if they’re hitting your site, so sessions are usually more heavily considered as a success metric.”
Use sessions and pageviews to track the ROI of your paid marketing campaigns
Golpar Saleh of Group3 Digital Agency adds, “If you want to know how well your marketing efforts are performing, you need to keep an eye on your unique pageviews and then sessions so that you know first how many new potential customers you’re attracting and then how engaging your website/product or service offering is.”
Create content groupings based on page sessions
“We like to keep a very close eye on the sessions so that we can see how long a user stays on a certain page, and if they click the links within that page to visit other similar content,” says Chris Gadek of AdQuick . “This helps us to better create content groupings (silos) and ensure that the user can find all of the information that they may find beneficial.”
In sum, users give you insight into how many people visit your site. Whereas sessions are the total number of visits.
Whether you choose to track users, sessions, or both, it doesn’t matter as long as the metric you choose aligns with your overall goals.
Do you want an All-in-One Analytics Platform?
Hey, we’re Databox. Our mission is to help businesses save time and grow faster. Click here to see our platform in action.
- Databox Benchmarks
- Future Value Calculator
- ROI Calculator
- Return On Ads Calculator
- Percentage Growth Rate Calculator
- Report Automation
- Client Reporting
- What is a KPI?
- Google Sheets KPIs
- Sales Analysis Report
- Shopify Reports
- Data Analysis Report
- Google Sheets Dashboard
- Best Dashboard Examples
- Analysing Data
- Marketing Agency KPIs
- Automate Agency Google Ads Report
- Marketing Research Report
- Social Media Dashboard Examples
- Ecom Dashboard Examples

Does Your Performance Stack Up?
Are you maximizing your business potential? Stop guessing and start comparing with companies like yours.

A Message From Our CEO
At Databox, we’re obsessed with helping companies more easily monitor, analyze, and report their results. Whether it’s the resources we put into building and maintaining integrations with 100+ popular marketing tools, enabling customizability of charts, dashboards, and reports, or building functionality to make analysis, benchmarking, and forecasting easier, we’re constantly trying to find ways to help our customers save time and deliver better results.
Jessica Malnik is a content strategist and copywriter for SaaS and productized service businesses. Her writing has appeared on The Next Web, Social Media Examiner, SEMRush, CMX, Help Scout, Convince & Convert, and many other sites.
Get practical strategies that drive consistent growth
The Benefits of Hiring a Fractional Chief Marketing Officer (fCMO): Perspectives of Agencies, Buyers, and fCMOs

Google My Business SEO: 8 Tips to Optimize Your Business for Local Searches
The 23 best keyword tracking tools (according to 107 seos).

Build your first dashboard in 5 minutes or less
Latest from our blog
- New in Databox: Analyze The Performance of Any Metric or KPI With Metric Insights April 22, 2024
- The Benefits of Hiring a Fractional Chief Marketing Officer (fCMO): Perspectives of Agencies, Buyers, and fCMOs April 18, 2024
- Metrics & KPIs
- vs. Tableau
- vs. Looker Studio
- vs. Klipfolio
- vs. Power BI
- vs. Whatagraph
- vs. AgencyAnalytics
- Product & Engineering
- Inside Databox
- Terms of Service
- Privacy Policy
- Talent Resources
- We're Hiring!
- Help Center
- API Documentation
Logan Mastrianna
Have you ever lost yourself in the thicket of unique visitors, new users, pageviews, and sessions in Google Analytics?
In this article, we’re going to discuss what these numbers actually mean and how you can analyze them to make better decisions about your marketing campaigns. To make it more cozy, let’s meet at a cafe…
Key takeaways
- In Google Analytics 4, visitors are called users , and visits are called sessions .
- GA4 groups distinct users in four different buckets. As a result, you can see 4 types of unique visitors in GA4 .
- GA4 uses four methods to track users and identify them as unique visitors.
- You can change the way GA4 tracks visitors , but it’s risky.
- GA4 cannot identify all your visitors , but that’s fine.
- Visitor and user metrics are helpful to analyze your audience and improve your marketing strategy.
Video: unique visitors in Google Analytics 4
If you'd prefer to watch instead of read, here's a video explaining all the ways that GA4 uses to identify unique visitors :
What is a visitor in Google Analytics, anyway?
First, let’s clarify exactly what a unique visitor is in Google Analytics: Unique visitors, or new users, describe the number of unduplicated visitors to your website over the course of a specific time period.
When you open Google Analytics, the first metrics you will notice are “Users” and “Sessions.”

The terminology might be a bit confusing if you are just starting with Google Analytics. But that can also be the case for seasoned GA users.
Before 2014, Google used different terminology :
- Visitors are called Users in GA4.
- Visits are called Sessions in GA4.
To simplify things and understand unique visitors (users) and visits (sessions), let’s assume four people – Ben, Eva, Matt, and Cindy visit a cafe for lunch.

In this example, visiting a cafe corresponds to visiting your website. Later in the evening, Ben and Eva drop into that cafe again for coffee.
Assuming that there are no other visitors, the unique number of visitors to the cafe on that particular day is four.
Google simply calls these “users” in most reports, such as the real time report where you can see how many visitors are currently on your site.

Back to the cafe. The total number of visits is six, and Google usually refers to these as sessions.
So, what is a unique visitor in Google Analytics4?
GA4 automatically segments every visitor of your site into 4 user groups that can overlap each other. Total Users, Active Users , Returning Users and New users are all unique visitors in their own way.
But of course, they are different from each other.
- All Users : Every unique visitor, whether they do or don’t do anything on your site (or app).
- (Active) Users : Only the group of engaged unique visitors OR anybody who visits the site for the first time
- New Users: A visitor who enters your site for the first time.
- Returning Users : Anybody who re-visits the site and who can be active or not.
This simple scheme shows what criteria GA4 uses to assign a visitor to one of the above groups.

Distinguishing users this way can seem weird, but it actually makes a lot of sense.
Visits and visitors impact the happiness level of our cafe owner too.
- Damn : someone opening the door and leaving immediately.
- Nice : a visitor looks at the menu.
- Good : the visitor orders something from the menu.
- Awesome : the customer comes back.
The next time your boss or a colleague asks you how many unique visitors your site had, you know that the only right answer is: “It depends”.
For example, your site has
- 10,000 Total Users
- 2,000 (Active) Users
That. Is. Not. Good.
At all.
Those numbers actually mean that 8,000 of your returning visitors leave your site within 10 seconds or without doing anything at all.
Returning users because, as you know now, New Users are also added up to the Users metrics.
Let’s check (and hope) that this nightmare is not the case for you…
How to Find Unique Visitors in Google Analytics?
Changing the metrics in the home report of GA4 is the fastest way to see how many unique visitors your site had.
Just click on the arrow and choose metrics that answer your question the best.
In the screenshot below we used: “Total Users”, “New users”, “Returning Users” and “Sessions”.

These metrics allow you to easily compare engaged visitors (Users) with new visitors (New Users) side by side.
But if you do the math, those numbers don’t seem to add up.

Why doesn’t the sum of Returning Users + New Users equals the Total Users in GA4?
The answer is actually simple.
Someone who visits a site for the first time and comes back later on, is both counted as a Returning User and a New User , but the Total User amount is only increased by one.

Let’s take it a step further and look at how you can easily detect in GA4 how many unique users there were in a certain period.
Unique visitors over time
Note that all metrics, including users and sessions, change when we change the time period. When you first log in to Google Analytics, the date range defaults to the most recent seven days, up till yesterday.
You can easily change the dates using the date drop-down box in the bottom left-hand corner.

In the above example, you can see that the number of unique visitors in the last seven days is 12k, while it shoots up to 66k when we increase the time period to the last 28 days.
The ability to view visitor data in different time frames allows you to have a more in-depth insight into user behavior – especially during events, marketing campaigns, holidays, and special days during the year.
If you wonder, for example, how Halloween impacts the amount of visitors and hence, visits to your site, you do the following.
- Go to the GA4 home report.
- Choose a period that includes the holiday.
- Choose user metrics as in the screenshot below.

This simple graphs can give you instant insights about your site visitors over time:
- Compared to the previous 7 days, your unique New Visitors dropped 30.6%.
- Click on a user metric. The dotted line visualizes the curve for that metric during the previous period. The thick blue line represents the selected period.
- Click on the lines in the graph to see the details for a particular day. On the 31st of October, for instance, there was a 99.2% drop of new users, compared to the 24th of October.
This is the usual way to quickly analyze visitor data.
But did you know you can also ask questions in GA4 about your visitors?
Type anything you want to know in the search box on top of the page, like “How many users did we get last week on mobile?”

Cool, isn’t it? GA4 understands normal languages. And it gives instant answers.
Our free GA4 guide is filled with little hacks like these that will save you time. Make sure you grab your copy below.
Where are my visitors coming from?
It’s nice to know how many unique visitors you have, but it’s even more useful to know the nature of traffic.
In Google Analytics 4, you can analyze your first users by looking at the Acquisition > User acquisition report .

You can see metrics like New users, Engaged sessions, Engagement rate , Engaged sessions, etc. In the columns of the table, you can see where these first users were coming from.
You can change this default report and create a full custom report in GA4 . That’s a clever way to analyze your users with metrics that truly matter to your business and your marketing campaigns. After all, traffic channels are not the only thing that are important.
The following technique is more advanced, but it also reveals more about anything you want to find out about your visitors.
Segmenting your visitors into audiences
The Audience section of Google Analytics allows you to analyze user data based on multiple parameters such as traffic source, demographics, operating system, browser, etc.

You can also analyze how website visitors engage with your web pages using metrics like sessions per user, pageviews per session, average session duration, and bounce rate .
GA4 can show you a lot about your visitors and their behavior on your site, but we haven’t asked one important question yet…
How Does Google Analytics Track Unique Visitors?
Google Analytics has 4 methods to identify unique visitors: User ID, Google Signals, Device ID, and Modeling.
Since we have covered some of these topics extensively on our blog, I link to the articles where you can find more information.
- User ID: This is something you can set up yourself with your developers. This is the most powerful method to identify users, but your site needs to have an account for users. They can be online shoppers, members of a community, or customers that use your app. We offer, for instance, a learning environment. Students all have a unique user ID and they can login to their account and access their courses about data marketing .
- Google Signals : visitors need to give consent and then Google can follow their online journey, including visits to your site across different devices.
- Modeling : this is the technique where Google AI fills in the gaps of, for instance, users that don’t allow cookies.
- Device ID : this is the oldest method, but it can also be used for apps.
All these 4 methods and combinations of them can be used to track unique visitors.
However, GA leaves the preferred user tracking method up to its users. That is you, or the administrator of your GA4 account.
Note that the GA4 user identification methods are not full proof.
When Google Analytics uses browser cookies to track unique visitors, there are certain situations where there is inaccuracy in user data. Returning users will likely be counted as new users if they:
- Browse the website in incognito mode
- Clear cookies on their browser
- Access the website through multiple devices
- Use different browsers on the same device
On the other side of things, many unique visitors might be counted as one user, for example, a family of three using one device or a group of students accessing a shared computer.

In summary: there are many reasons the data of your visitors in your GA4 reports is not 100% correct.
Google Analytics can’t track unique visitors perfectly, but data is better than no data
Which method does GA4 use in my account to identify users?
As a marketer or data analyst, you need to be aware of one thing. The amount of unique users in your GA reports depends on the tracking method that is activated in your GA4 account. There are three options: blended, observed and device-based.
This is how you can see which method GA4 is using to track and identify visitors:
- Go to the admin section of your GA4 account.
- Then open the reporting identity section .

Note that the active reporting identity can have inactive tracking methods.
Even if your user role doesn’t have permissions to change anything here, it is still worth having a look. Especially when you are doing a GA4 audit for a customer or your own site.
But, don’t change the user tracking method, unless
- you know what you are doing
- you have properly informed your team
- you have good reasons to change it. Privacy and user consent are damn good reasons.
To illustrate why this is risky, let me share a screenshot of the video on top of this article.

- Google Signals activated: 12,334 unique visitors
- Without Google Signals: 13,594 unique visitors
That’s a scary difference in my opinion.
Difference Between Users and New Users
Remember when Ben, Eva, Matt, and Cindy went to the cafe for lunch? It turns out that they were so delighted by the food that they brought two more friends, Mike and Jo, with them the next day for a special Sunday brunch.
Since unique visitors are counted for a specific date range, the number of unique visitors to the cafe on Sunday is six, while there are two new visitors.
Similarly, new users in Google Analytics are people who have visited your website for the first time, irrespective of the date range.
Note that new users are a subset of unique visitors or users.
The New Users data is instrumental when running a marketing campaign – like an influencer marketing campaign or social media advertising – to measure and compare new user acquisition effectiveness.
The returning users metric is especially handy when your marketing efforts are centered around your content and you have sizable newsletter subscribers or social media followers.
What Do Pageviews and Unique Pageviews Mean in Google Analytics?
When Ben, Eva, Matt, and Cindy visited the cafe, each of them ordered a hamburger and soda. Ben and Cindy also had a dessert each, while Matt opted for another soda instead of a dessert. Here, the different items ordered in the cafe correspond to users viewing different web pages on your website.
In Google Analytics, pageviews means the total number of individual pages or posts viewed on your site. If the items ordered in the restaurant were pageviews, the total count would be 11 (4 hamburgers, 4 sodas, 2 desserts, and 1 more soda).
To view pageviews and unique pageviews for your individual webpages, you can visit the pages and screens report .
Take a look at your “Engagement > Pages and Screens” report. Top performing pages are shown with the page title and performance metrics. This report also shows how many Users viewed each page.

Unique pageviews only denote the number of unique pages visited by a user in one session . Unique pageviews weed out refreshes and revisits and paints a clearer picture of the web traffic and your content engagement.
In general, new users engage more with your webpages because the content is, essentially, still new for them. On the other hand, returning users have already visited your website at least once and probably read your previous posts.
Hence, their average pageviews per session is usually lower than returning users.
Google Analytics expert Eddie Lee explains that in Google Analytics 4 as follows:
“Things are a little different. Everything is an event- including page views. By default, page view, scrolls, clicks, site search, video engagement and file downloads are tracked automatically on a default installation.”
Why Should You Care About Unique Visitors?
With all that in mind, what’s the actual use case for unique visitors?
Let’s say you have a website that sells a product and you also have a large email list that you regularly sell to.
When looking at your conversion rate, you notice that your overall conversion rate for January is 8%
But when you look at your conversion rate for unique visitors you notice that it’s only 0.5%.
Ouch. What’s going on here?
While you should expect to have a higher conversion rate from people who are already engaged with your brand (the majority of which may be coming from your email list), depending on your product the conversion rate for unique visitors may be too low.
By segmenting out unique visitors, you can see how people who are brand new to your site interact with your brand and have a better understanding of how to grow that side of the business. Instead of just seeing your awesome overall conversion rate and moving on.
So, what’s next?
Whether you are a new or returning visitor to our site, you are a unique person with unique marketing and data skills, questions and needs.
That makes it impossible for me to give you solid advice on what to do next. But here are some suggestions.
Grab your free copy of GA tips and advice. Even if you are an expert, this will save you time in GA4.
Would you like to dive deeper into user data in GA?
Or maybe find a topic to discuss next time you visit a cafe?
These articles will not disappoint you.
Starter level: Understand sessions in GA4 .
Intermediate level: Dive into the user journey with the path exploration report .
Expert level: Get even more insights about your visitors by tracking user properties .
Leave a Comment Cancel Reply
Your email address will not be published. Required fields are marked *
Logan is a digital marketer with almost a decade of experience across SEO, paid media, and analytics.

Meaningful Metrics: New vs Returning Visitors in Google Analytics
“I want to increase the number of returning visitors.” Now you need a report to track your progress. This article will help you navigate Google Analytics to find the right data, and to produce a meaningful report using Analytics Edge.
Why Do We Care About New or Returning Visitors?
Numerous studies have shown that websites tend to have more new visitors and fewer returning visitors. But the returning visitors tend to have higher engagement — they bounce less, view more pages per session, and have higher session durations. They also tend to have higher conversion rates and higher sales…much higher. This makes us want more returning visitors.
But every website needs both new and returning visitors — you need to feed the funnel with new users so you can turn them into returning users. Some marketing initiatives encourage new visits (like advertising and search engine optimization), and some encourage return visits (like posting to social media or an email newsletter). It is important to know how they all come together to make the numbers grow.
How Does Google Analytics Measure New/Returning Visitors
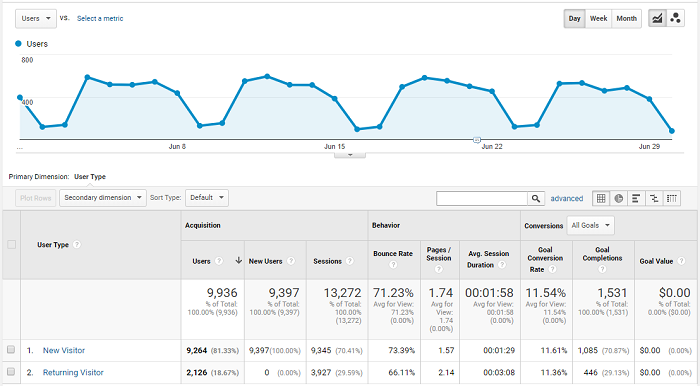
Google Analytics uses the dimension User Type to differentiate between a New Visitor and a Returning Visitor . They show this dimension in the standard report AUDIENCE > Behavior > New vs Returning along with a number of metrics. The metrics displayed vary depending on whether you have Enable Users Metrics (Property Settings) or Enable Ecommerce (View Settings) options on.
Google says you can use this report to m easure the gravitational pull of your site, and the extent to which you’re encouraging first-time users to return. You can also see the economic impact of new vs. returning users.
During a User’s very first visit to your website, the User Type dimension will be set to New Visitor . After that, all future visits will be tagged as Returning Visitor . The report shows the basic counts, the engagement, and the conversions for each User Type. You can easily see whether Returning Visitors engage and convert more on your site by comparing the numbers.
Sources of Confusion: Users, Sessions, and Visitors
In some reports you will see % New Sessions or New Users metrics. Combine those with the Users and Sessions metrics for New Visitors and Returning Visitors , and things can get confusing. Sessions and Users and Visitors are different things:
- a new User (person) would be classified as a New Visitor (type of user), count as a User and a New User, with a Session (visit). By itself, that would count as 100% New Sessions.
- a returning User (person) would be classified as a Returning Visitor (type of user), and be counted as a User with a Session. By itself, that would count as 0% New Sessions.
- a single User (person) can have multiple Sessions (visits) in the reporting period. If they are a new User to your site, their first Session would be as a New Visitor, but their returning Sessions would be classified as a Returning Visitor. So a single User can be BOTH a New Visitor and a Returning Visitor in the same report.
- a single User can be a New Visitor only once (on their first visit), but they can have multiple return Sessions in the same reporting period. Since %New Sessions is a ratio of (new Sessions)/(new+returning Sessions), it drops if there are more returning visits from that User.
- a User that visited before the reporting period would be seen only as a Returning Visitor. Their New User count (first-ever visit) happened before the reporting period started, so they would not appear as a New Visitor at all.
For example, if a single User has their first, second and third visit during the reporting period, they would appear as:
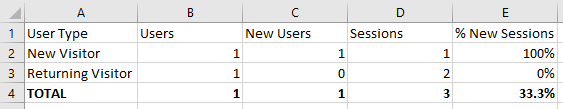
Total Users: Note that the total number of Users is NOT a mathematical sum of New Visitors+Returning Visitors. 1 (New) + 1 (Returning) = 2, but the total number of Users is 1 because it was the same person — the total Users metric is an entirely different query that removes any duplication.
% New Sessions is not a good indicator of the number of new or returning users. In the example, the % New Sessions is 33% even though all the sessions came from the same user. Only the first session was new; the others were returning. Lots of returning sessions by the same users causes the percentage to drop.
Google Analytics does not have a dedicated metric for Returning Users like they do with New Users. If you want to see how many returning Users you have, you would need to look at the Users metric where the User Type is Returning Visitor (cell B3 in the image above).
Further reading: Misunderstood Metrics: New vs Returning Visitors
Meaningful Metrics: New and Returning Visitors
Caveat : because of the way Google Analytics works, a user will be identified as a New User if they use different devices or have enabled privacy settings. This means you do not know if a “New User” is actually new. However you can be very confident that a Returning Visitor is really is returning. Changing new user counts could mean a number of different things, but if returning user counts go up then you know you got more returning users.
Key Performance Indicators are metrics you can watch over time that will indicate improvement, or a lack of it. The most common key performance indicators for New vs Returning Visitors are:
- % New Sessions – this is a classic, readily available, but poor metric to monitor. By itself, it tells you almost nothing; an increase could be good (more new users) or bad (drop in returning sessions).
- New Users – readily available, and commonly used to evaluate the effectiveness of traffic generation efforts. It gets more meaningful when combined with a channel or source, such as new users from organic search.
- Returning Sessions – filtered query required (Sessions metric where User Type is Returning Visitor). A good measure of visitor loyalty and site appeal, but affected by changes in the number of sessions per returning user.
- Returning Users – filtered query required (Users metric where User Type is Returning Visitor). Often overlooked because most people don’t realize it can be obtained. The ultimate visitor loyalty measure.
Segmentation is used to look deeper into the metrics — to understand why they are what they are. Any of the previous measures can be combined with other dimensions, such as date, source or demographics (like device). While this is referred to as “segmentation”, it usually does not involve the use of a “segment” in Google Analytics — just add another dimension to your query, or add a filter to get just one value. Some segmentation examples:
- by Date (Week/Month) – see if various marketing initiatives have been successful, or what impact website changes have had.
- by Channel or Source/Medium – see which channels are delivering new users to the site, and how returning users find their way back.
- by Referring URLs – what are your best references? Are some more effective for conversion?
- by Device Category (Mobile Device) – rough estimate of the usability of the mobile version of the site.
- by Landing Page – what anchor or reference pages bring people back again and again? Which pages bring in the most new visitors?
- by Language/Country – does your site appeal more to specific locations or languages?
Meaningful Reports: Widgets
Because of the variety of metrics available, and how they interact with the User Type dimension, you can combine them in different ways in order to show different behaviors.
A common way to present Key Performance Indicators (KPI) is with dashboard widgets. Widgets are usually self-contained block that shows the current KPI value along with a trend or previous value to provide context. It is important that you do not simply present a number without that context.
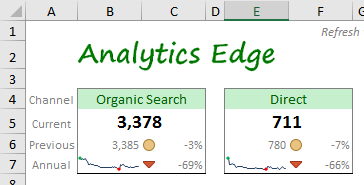
Learn more: Building a Dashboard Widget in Excel
Returning Users Widget
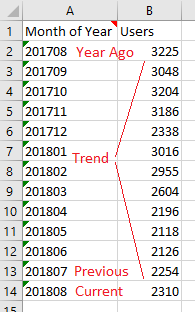
- dimension: Month of Year
- metric: Users
- filter: User Type > Exact Match > Returning Visitor
- dates: duration 13 months ; end of Last Month
- option: Minimize sampling
As described above, getting the number of returning users out of Google Analytics requires a special query because there is no “Returning Users” metric available. This query pulls the Users metric, filtered for a User Type of Returning Visitor.
This query delivers 13 individual months of User numbers. You would write this query to a data worksheet, and use cell references from the actual widget to the data worksheet (see the article for details). The result includes the current and previous month values as well as a year-ago value so you can calculate month-to-month and year-to-year changes. It also includes all of the months in between so you can build a chart showing the trend.
Note that the Minimize sampling option is turned on to reduce the risk of sampling for larger websites.
Meaningful Reports: Tables and Charts
Segmented data is usually presented in tables or charts. Your selection depends on the content and purpose of your report. Trends are usually presented as line charts, and segmented groupings are typically presented in tables or bar charts. When building your report in Excel, you need to work within the rigid row-and-column grid of the spreadsheet.
If the report is for your use only, I recommend that you keep things simple and write your query results to separate worksheets. That way, future changes will not impact other queries.
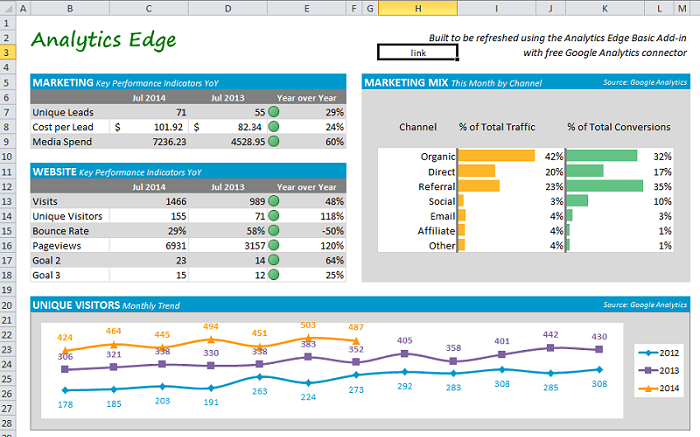
Learn more: Building a Marketing Dashboard in Excel
Analytics Edge provides a number of free sample reports with various presentation approaches, but you should pick an approach that is right for your reporting situation and content.
Returning Users by Channel
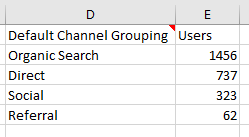
- dimension: Default Channel Grouping
- dates: preset Last Calendar Month
- sort: desc Users
When looking at the Default Channel Grouping or other segmentation, it is often preferred to sort the results by the number of Users in descending order. This puts the most significant items at the top of the list.
Returning Users by Channel Trend
The Analytics Edge query required to get the data is:
- dimension: Month of Year,Default Channel Grouping
- dates: duration 12 months , end of Last Month
- Standard or Core Add-in: Pivot by Month of Year , sort by last column descending

This report builds on the previous one, adding the Month of Year dimension, but it requires a Pivot operation. The Analytics Edge Standard Add-in and Core Add-in offer Pivot and Sort functions; if you are using the Basic Add-in, you will need to link your query results to an Excel Pivot Table.
Meaningful Analysis
When viewing the standard reports in Google Analytics, you may be tempted to reference the %New Sessions metric or New Users count because the numbers are readily available. While those metrics may help measure your lead generation activity, they do not tell the whole story.
Returning visitors are typically more engaged, with higher conversion rates and total sales (or goal completions). They are worth monitoring, but Google Analytics doesn’t make it easy to do so. Analytics Edge does.
Use the Analytics Edge queries above to monitor your New and Returning Users, or modify the queries to suit your specific needs. Consider weekly reporting instead of monthly, and try other dimensions for segmentation to better understand visitor behavior on your website.
Questions to consider:
- what content do returning visitors favor? Can you create similar new content? Add calls-to-action to deepen your relationships?
- look at landing pages with high bounce rate for new visitors – do they need some work?
- if there is a drop in new users, consider new or strengthening marketing initiatives.
- if there is a drop in returning users, review other segmentation to determine if it is a specific group of people or specific content that is being lost.
Unique Visitors in Google Analytics: All You Need To Know
Google Analytics 4 measures website visitors differently than Universal Analytics.
The new event-based data model changes the way in which Google Analytics shows returning and new users on the main tool’s interface.
This changes the definition of unique visitors in Google Analytics 4 , but don’t worry - we’ll show you everything you need to know about unique users visiting your site right in this guide.
What Are Unique Visitors?
Unique visitors are defined as the number of unduplicated individual users who visit your website over the course of a specified time period.
Google Analytics unique visitors are one of the most important web analytics metrics and shows you insights regarding the growth and evolution of your site’s audience.
An increase in the total number of unique visitors means that your site is being accessed by new people over a certain time period.
This information can be used to determine the engagement of your site content, the effectiveness of marketing campaigns, and user behaviour based on traffic sources.
Official Google Analytics Definition of Unique Visitors
Google defines unique visitors as the “total number of unique users who logged an event.”
Back in Universal Analytics (compare UA to GA4 metrics here), the “Total Number of Users” metric was measured as a whole based on unique sessions (users that had at least one session within the selected date range).
In GA4, user visits can only be considered “unique” if:
- A first-party cookie is stored on the user’s browser.
- They trigger an engaged session event (stay on a web page for 10 seconds or more, visit another page, or trigger a conversion event).
How Does Google Analytics Identify Unique Visitors?
Google Analytics 4 determines unique visits by storing browser cookies when they open a session on your website.
GA4 cookies store a client ID in a first-party cookie called _ga. This cookie assigns an identifier to the new session, which helps the tool distinguish between a new user and a returning visitor.
Although the default expiration time of the ga cookie is 2 years , it is possible for web owners to change these parameters in order to comply with privacy regulations imposed by government authorities.
It is worth noting that some browsers, such as Safari, enforce limitations on the lifespan of cookies if users do not return to a certain website.
Unique Visitors vs New Users
Google Analytics 4 allows you to track unique visitors to your website through cookies, but what if one user comes back? Will they be tracked as a unique visitor?
No, as long as the first-party cookie with its unique identifier is still stored on their browser.
New users in Google Analytics 4 are the total number of users who launch or open your website for the first time. In order to classify website visitors as unique users, GA4 takes the following factors into account:
- The user need to have a new unique user ID stored through cookies.
- A first_visit or first_open event needs to be triggered.
Both conditions must be met in order to count users as new visitors.
If, for instance, a user triggers a first_open event, but their user ID has been already stored by GA4 in the past, they will be counted as a returning user.
Limitations of Unique Visitors Data in GA
Google’s way of measuring unique visitors is not perfect. Returning users can be counted as unique visitors sometimes, which causes inaccurate data reporting.
In the following scenarios, Google Analytics 4 will encounter anomalies while trying to measure unique visitors:
- Cross-device cookie tracking: if the same user accesses your website through multiple devices or a different operating system, it will be counted as a new unique visitor.
- Multiple individuals using the same device: if more than one person uses a single device to see your website, they will count as a single person towards the Unique Visitors web metric.
- Incognito browsing modes contribute to inaccuracies: Incognito Browsing Modes, such as Google Chrome Incognito Mode , causes users to be seen as new users, even if they are returning visitors.
- Local laws/regulations that make data collection limited: privacy regulations in some countries establish that websites can only store cookies if users give their consent. Google Analytics 4 has a cookie Consent Mode , which provides users with the option to get their user sessions tracked by cookies or not.
Where to Find Unique Visitors in Google Analytics 4
You can see how many unique visitors your site gets simply by logging into your Google Analytics account.
After you log in to Google Analytics account, go to the main Home Tab. There, you will see a graphic that shows you both Users and New Users.
“Users” refers to each unique visitor your website has obtained during the past few days.
Remember that you can change the date range of the graphic to get monthly, weekly or daily insights into the Unique Visitor metric.
If you have recently made the switch from UA to GA4, remember that the tools do not track unique visitors equally, even if the term “Users” appear the same.
GA4 tracks unique visitors based on events, whereas UA tracks unique visitors based on sessions.
This is all you need know about unique visitors concepts and definitions in Google Analytics 4. Keep in mind that unique visitor metrics should be analyzed, interpreted and checked based on your own website’s audience and goals.
Are Unique Visitors Same as Unique Pageviews?
No, unique visitors and unique pageviews are not the same. Unique pageviews are the number of times that certain web pages have been viewed by a unique visitor over a certain time period. This means that if a unique visitor sees 3 different pages, Google Analytics 4 will count it as 3 page views, but only a single Unique Page View.
BIO Paul Jarvis, author + designer
Recent blog posts
- I made a mistake
- Reducing our AWS bill by $100,000
- How to Enable and Use Link Tracking Protection in iOS 17
- How we built our referral program
- Why Fathom Analytics doesn’t have a free plan
Tired of Google Analytics? Try Fathom Analytics, free for 30 days:
Start a free trial
Switch to a better Google Analytics alternative
Fathom Analytics is simpler, more accurate and privacy-first. Import your Google Analytics data (UA and GA4), add our single line of code, and watch real-time analytics from your site pour in.
Start a 30-day, unlimited free trial to see how simple analytics can be.
Get started
Check out our full-featured, live demo to see how our software works.
- How it works
- vs Google Analytics
- About Fathom
- Help centre
- Blog & news
- Podcast: Above Board
- How we process data
- What's new?
- Legal compliance
- Search Engine Optimization (SEO)
- Content Marketing
- Digital Analytics
- Conversion Rate Optimization
- Social Media
- Sign Up Request Invite -->
New vs Returning Visitors in Google Analytics

Updated on January 24, 2023
What is the difference between new and returning users in Google Analytics ? What do these metrics mean and what should you do with that data? Here is everything you need to know about new vs returning visitors in Google Analytics.
The Difference Between New vs Returning Visitors
New visitors (or new users) are people who have never been to the website before. Whereas, returning visitors (or returning users) are people who have visited the website previously and have come back.
That’s the idea behind the metrics. Yet, there are times when the data may not be a perfect representation of new vs returning.
When the Data Could Be Wrong
There are four instances where the tracking could incorrectly assign a returning visitor as a new visitor.
- If someone switches devices, such as laptop to mobile phone, it is likely the tracking code will identify both sessions as new visitors. GA4 has addressed this issue but it is still imperfect. It works best when people log into the website and are tracked with a user ID. In most cases, one person using multiple devices will appear as a new user for each device.
- Similar to switching devices, switching browsers will also cause Google Analytics tracking to assign a new user for each browser. Even if it is the same person.
- This tracking relies on cookies. So, if people delete their cookies the next visit would count as a new user even if they had visited before deleting the cookies.
- If someone uses incognito mode or private browsing then no cookie is set. Because of that, each visit counts as a new visitor.
Other than these four instances that could cause the tracking to be off, there are a couple other discrepancies to be aware of.
These Numbers Aren’t Unique
The new vs returning visitors numbers do not equal the total number of unique users to the site. A person can count as a new or returning user many times in the same reporting period. This happens if they have visited the site more than once so there are multiple sessions for that person. One person can count in the new visitor metric, and then also have several sessions that count in the returning visitor metric.
These Numbers Likely Have Duplicates
It’s important to understand that some of those new users are likely duplicates. If any of the four scenarios above happened, people can count multiple times in the new visitor metric.
Where Can You Find New vs Returning Users in Google Analytics?
New vs returning visitors in universal analytics.
In Universal Analytics, navigate to Audience > Behavior > New vs Returning .
You can also use segments at the top of the Google Analytics interface to view any of the Universal Analytics reports with the new and returning visitors user segments.
To enable the new and returning user segments:
- Select the Choose segment from list box at the top.
- Then, select System .
- Then, select New Users .
- Next, repeat steps 1-2 and then select Returning Users .
You can even remove the All Users segment to view the data with only the new and returning user segments.
New vs Returning Visitors in GA4
In Google Analytics 4 (GA4) , this report has changed a bit. Like the majority of GA4 reports, it has improved. But, since it is different, there is a learning curve. If we’re coming from the Universal Analytics version of Google Analytics, we need to better understand the new report before we can gain insight from it.
In GA4, find the new vs returning visitor information under Retention . The Retention Overview screen has multiple charts that help to visualize new vs returning users. Google provides more information about each of the retention charts so you can become familiar with them and gain more insights.
You can also create a table that resembles the data you would see in the Universal Analytics version of Google Analytics.
To create a new vs returning visitors table in GA4:
- Go to Explore .
- Then create a Free form report.
- New / established is like new vs returning . Instead of new meaning it is the first visit, it means the first visit is within the last seven days. And established is like returning . It means the first visit was more than seven days ago.
- Select any Metrics you’d like to measure. I’d recommend Sessions , Conversions , and Engagement Rate .
- Drag the Dimension into Rows and the Metrics into Values .
- Look at the table to view and analyze your data.
View the video clip below to see how to create the New vs Returning report in GA4.
What to do with the New vs Returning Visitor Data
Okay, so now we know what new vs returning users are, and we know where we can find the data, but what insights can we learn from looking at this information?
Does your navigation have a learning curve?
Do new visitors spend more time on your site than returning visitors? If so, you’ll want to confirm that your navigation doesn’t have a learning curve. You want to make sure people are spending their time effectively and not spending extra time trying to find what they’re looking for.
To dig into the specific cause behind the difference in times you’ll want to leverage conversion optimization tools such as session recordings . The Google Analytics data can help you identify there could be room for improvement. Session recordings let you confirm and gain insight into that suspicion.
Do returning users convert higher?
If returning visitors convert higher, make sure you’re doing what you can to get more of your visitors to return. Revisit your lead magnet strategy. Make sure the lead magnet is bridging the gap between a new visit and completing the primary site goal. The lead magnet should help a new user get over a hurdle stopping them from converting. It should also be something that does not feel too overwhelming. A lead magnet should be a simple step onto the bridge that eventually gets them to the end goal.
If you can get more new users to sign up for your lead magnet, that will allow you to get in their inbox. Once they’re on your email list and become familiar with your brand, they are more likely to move into the returning users bucket.
Do returning visitors have a higher bounce rate?
Are new visitors more engaged than returning visitors? In Universal Analytics, check to see if returning visitors have a higher bounce rate . In GA4, check to see if new visitors have a higher engagement rate . If either of those are true, revisit your content strategy. Your audience could be learning with you and they could now be ready for more advanced topics.
Do new or returning visitors come from particular sources?
Check to see if there are particular traffic sources that bring in new or returning visitors. In Universal Analytics, use the segments on the Acquisition > All Traffic > Source / Medium report to view the data. In GA4, add the Dimension of Source / medium to the free form report. Then add Source / Medium to Columns .
If you notice a particular source brings in a particular type of user, you can try and create content to cater to that user on that channel. For example, if a particular social network only brings in returning visitors you can create content on that network that speaks to someone familiar with your brand.
Are new or returning visitors attracted to particular content topics?
Review content reports to see who’s looking at what content. In Universal Analytics, go to Behavior > Site Content > All Pages and use the segments to view the data by new and returning users. In GA4, add a Dimension of Page Title to the free form report. Use Page Title for rows and New / established for columns . If there are particular content topics that attract a specific type of user you can use that information to improve your content strategy.
New vs returning visitor data can help you better understand how your website caters to different types of users. Google Analytics can help you identify some key differences so you can improve your site and adjust your strategy. That way you can move more new users into returning visitors.
Do you want to listen to this article? Here’s the podcast episode:

FREE ONLINE COURSE
How to do seo yourself.
Learn how to grow your own website traffic.
ENROLLMENT NOW OPEN! Register for the free How To Do SEO Yourself online course.
Home / Blog / Google Analytics Made Easy: New Visitors vs. Returning Visitors
Google Analytics Made Easy: New Visitors vs. Returning Visitors

One of the most powerful tools in your digital tool belt is also one of the most complicated to understand. Google Analytics is data-rich, but is only as valuable as your ability to interpret it. This is why we’re bringing you our Google Analytics Made Easy (GAME) series. Explanations of the most telling data on your Google Analytics dashboard–easy to read, easy to understand, and without the fluff. Game on! Google Analytics provides a wealth of information about your site’s audience, from the age of your users to the flow of visitors around your site. A key (but often overlooked) audience demographic is your proportion of new and returning visitors to your site. Spend a little time analyzing your data, and you can be a savvy analytics-nerd, too!
The Difference Between New and Returning Visitors
We know: the difference between new and returning visitors seems pretty self-explanatory, and for the most part, it is! But Google does differentiate between the two a little differently than you and I might.
New Visitors are those navigating to your site for the first time on a specific device. If you visit our website from your desktop computer at work, and then visit our website again from your iPhone, Google Analytics would record you as 2 new users. (Google is getting smarter about this—if you’re logged onto your Google Chrome browser and repeat the actions above, you would be recorded as a New Visitor on your desktop, and a Returning Visitor on your iPhone.)
Returning Visitors have visited your site before and are back for more! Google sets a 2-year expiration date on New Visitors. If someone has visited our website within the past two years and returns from the same device, they are marked as a Returning Visitor in our Google Analytics. If it has been more than two years since someone has visited our site, the next time they return they will be counted as a New Visitor again.
First: Where Do I Find the Data?

On your Google Analytics dashboard, select “Audience” on the left. Then click the “Behavior” drop down and select “New vs. Returning.”

Three Key Pieces of Data: Sessions, Behavior, Goals
There are three key pieces of data to review in this table:

- Sessions – compare how many new visitors your site gets versus the number of repeat visitors. You can see the total number of each visitor type here and the percentages of each. Your goals will depend on the type of business you’re in and the type of website you have. If you run a content-heavy website (like a professional blog), you’ll want a solid number of returning visits from people who come back for new content. Niche e-commerce businesses might want mostly new visitors. “Brochure Websites” that simply point users to an in-person store or service probably have very few returning visitors, and that’s okay. If you’ve run a heavy digital marketing campaign in the past month, you’ll want to look at your numbers compared to last month’s—if your campaign has been successful, you’ll see more new visitors this month!
- Behavior – This section breaks down how returning users and new users behave once they’re on the site. “Bounce rate” refers to the percentage of users who leave the site without visiting a second page. “Pages / Session” tells you how many individual pages the average user visits on your site before leaving. “Avg. Session Duration” tells you the average length of time each visitor spends on your site before leaving.
- Goals – If you’ve set up goals on your site through Google Analytics (e.g. signing up for a newsletter, making a purchase, or clicking on a CTA button), this data will let you see whether New Visitors or Returning Visitors are “completing” that goal more often. It’s this behavior and goal information that makes the breakdown between New and Returning visitors so insightful. In the table you can compare side by side each of these metrics for your New Visitors and your Returning Visitors. Again, it’s impossible to have a universal benchmark you should aim for, but you can still draw some really powerful conclusions here.
Interpreting New and Returning Visitors Data
For example, if your New Visitors spend far more time on your site than your Returning Visitors, you may want to incentivize first-time visitors to return again. Offer a new coupon code to shoppers after their first purchase or work your email lists to push new, relevant content to your base. This data could also be indicating a site has poor design, but quality content. Your site may have important content that many people want to read, but a poor user interface means visitors slowly have to “learn” how to find the content they want.
If Returning Visitors have higher goal completion rates than your New Visitors, consider strategies that push New Visitors toward goal completion. Use best practices for your call-to-action buttons to maximize your opportunity. Exit popups can also be useful if used sparingly. For e-commerce sites, new shoppers may need more product information (or a comparison table ) to make a decision on their first visit.
If Returning Visitors have a higher bounce rate than New Visitors, it’s possible that the quality or the quantity of your content is decreasing. Visitors are returning to the site but no longer finding useful content. Review your content strategy and performance of recent content to see if something is amiss. Immediately following a major redesign, many sites experience higher bounce rates from returning visitors unfamiliar (or unhappy) with the new site navigation and layout. Returning visitors are key to building a strong brand and an engaged digital community, so make sure you are giving them a reason to keep coming back!
Can I Trust my Google Analytics Data?
Google Analytics provides powerful data to aid in making decisions about your business’s digital presence, but remember that it’s only one piece of the puzzle . Important strategic decisions require a long-term focus that might be skewed by a month’s-worth of data. Content marketing strategy requires persistence—changing your type or frequency of content based only on bad numbers in November could be disastrous. By combining your Google Analytics data with social media metrics and internal business data, you’ll get a clearer, more holistic picture of your organization’s digital traction. Of course, it can’t hurt to bring in some experts to help you set up and analyze your Google Analytics data.
Remember that the amount of data you’re analyzing can affect the accuracy of your data. If you run a personal website with only 50 monthly hits, you probably can’t make any conclusive insights—there’s a large degree of uncertainty built into the data you see. Your data becomes more valuable as you increase the number of sessions your website receives monthly and the length of time you have to measure.
On the other hand, if your site has been getting 1,000 visitors each month for the past year, you can draw pretty accurate conclusions from your data (and for sites above this threshold, too). Less data doesn’t mean you should ignore that data, just that you should always take it with a grain of salt.
Quick Recap: New Visitors vs. Returning Visitors
A key audience demographic on your Google Analytics dashboard is the breakdown of New Visitors vs. Returning Visitors. New visitors are people who are coming to your site for the first time on a device. Returning visitors have come back to your site before. The ratio of new visitors to returning visitors can be very telling, showing the effectiveness of your inbound digital marketing techniques across the web. Looking at behavioral data for these two groups provides valuable insights about your website content, structure, and design, and it can reveal new opportunities for providing value to your audience.
RELATED READ: Google Analytics Made Easy: Frequency and Recency
Stay Updated
Keep track of the best design, marketing & tech resources delivered straight to your inbox., related services, committed to delivering real business results., top articles, unlocking the benefits of high best practices scores in lighthouse, tips for improving ppc performance, questions for helping to define and understand your b2b buyer’s journey.
Our site uses cookies to collect the necessary data to improve your browsing experience and customize content based on your interests.
- advertising
Visits, Sessions and Clicks - Making Sense of Google Analytics Metrics
If you’re using Google Analytics, you've probably seen some similar-looking metrics called sessions and entrances. If you've exited GA and viewed nearly any other analytics tool, you've probably seen visits, but no mention of sessions. You return to Google Analytics and find that there’s no such thing as visits. So what gives? Here, I’ll attempt to demystify confusion around metrics that seem like they should be the same, but aren’t.
Understanding Sessions vs. Entrances
Before untangling sessions and entrances, it's important to talk briefly about hits. According to the documentation, a hit is any “interaction that results in data being sent to Google Analytics.” Hits determine the start of a session in GA. Hit types include pageviews, events and social interactions. Unless you have a custom implementation of Google Analytics, the first hit of a session should be a pageview.
What is a Session?
So viewing a page starts a session, but what is a session? A session is the set of interactions that occur within a single trip to a website. This is why in standard reports, sessions is shown alongside metrics like pages/session, and avg. session duration.
The first pageview of a session is called an entrance. In the all pages report, its value indicates how many times someone entered the site on a particular page. And because the first hit of a session is a pageview by default, the values of sessions and entrances are equal.
So What Are Visits?
The difference between website visits and sessions is mainly a naming convention. As long as you don’t have a custom setup, visits are the same as sessions.
Clicks vs. Sessions
If you’ve connected your Google Ads account to Google Analytics, you may have noticed that the clicks column differs from sessions column. It’s easy to think that these are the same; you click an ad, you’re sent to the website, and that’s it, right?
It’s important to realize that a single click, can lead to many sessions. For example, if someone clicks an ad and is brought to your site, if they come back later directly, the ad they had previously clicked will still get credit. Additionally, if users are able to click to call straight from an ad, these clicks will not become sessions.
What Are Pageviews Again?
A metric that doesn’t get as much attention in the Google Analytics discourse are pageviews. This metric is mostly self-explained, but it can be confusing when shown with unique pageviews in the all pages report. Simply put, the pageview count is the number of times a page has been seen . If a page is seen more than once in a single session, only one unique pageview hit is attributed to it. As an example, if I start my visit on a site’s homepage, go to the contact page, and then hit the back button, that counts as 2 pageviews for the homepage and 1 unique pageview for the home page.
In Summary, there's a general way to think about all these metrics, as long as you have a standard implementation of Google Analytics.
Pageviews > Unique Pageviews > Sessions = Entrances = Visits
Now that some of the confusion has been cleared, you can start using these measurements to your benefit. These metrics are common in most Google Analytics reports, and there are many more that can be used to help improve your site's performance. Check out this article: Bounce Rate vs Average Session Duration .
View the discussion thread.

Unique Visitors: Understanding and Targeting Your Competitors’ Audience

What is the unique visitors metric?
Unique visitors is a website metric that shows the total number of visitors to a site; counting only their first visit. If they return to the site at a later time, any additional visits are not counted in this number.
As one of the most telling website KPIs, it’s something every business should track and compare with competitors’ website and engagement metrics.
Now you know what it means, let’s talk about why it matters so much.
What is unique visitors used for?
This standard engagement metric is essential for analyzing web traffic and planning your digital strategy . It’s also referred to as UVPM, which is short for unique visitors per month. Google Analytics is considered one of the most common analytics tools; it provides a unique visitors metric for your site. With Similarweb’s analytics platform, you can also examine your competitors’ unique visitor stats, along with other useful insights that allow you to drill down and unpack their successes online.
Unique visitors comes in handy in a range of situations, including:
- To data and BI analysts tracking online activity in their industry or competitive landscape .
- Doing a competitive analysis of a rival’s website.
- For publishers assessing the exposure of a competitor’s piece of content.
- Both strategy and investment teams measure a brand’s reach.
- Benchmarking industry traffic and engagement stats.
- To see which companies achieve success with inbound marketing.
- For advertisers who need to quantify the impact of another company’s campaign.
Why is the unique visitors metric important for your business?
To understand the exposure and reach of a website, marketers and researchers look at page views. Similarweb’s equivalent, the number of visits received by a website is a key metric for analyzing that website’s traffic. This information is critical, for example:
– If you are a publisher and want to show the number of impressions an ad will receive on your website.
– If you are part of the user journey team at an ecommerce website seeking to capitalize on each visit as an opportunity to convert a visitor into a buying customer.
To help you better understand a website’s audience analysis , such as size and reach, you need to look at the unique visitors metric. In the simplest of terms, this number represents how many pairs of eyes viewed a particular website during a specified period.
Dividing the number of visits by the number of unique visitors yields the number of visits per individual user (also provided by Similarweb), which you can use to analyze engagement rates on a website and understand how many times every single user visited that website.

Unique visitors, visitors, and visits – what’s the difference?
It’s easy to get confused with these web analytics metrics. Although they’re similar, it’s critical to understand the difference.
Visits: Counts the number of single visits to a website or page, regardless of their origin. The same visitor may have several visits to the same page.
Similarweb calculates total visits within a defined period and region. Each time a visitor accesses one or more pages, it counts as a visit. Subsequent views of the same page are included until the user is inactive for at least 30 minutes.

Visitors: In Google Analytics, visits from the same browser or terminal are defined as coming from the same visitor if they arrive on the same day . In other words. “Visitors” count the users that visit your site in a single day. The following day, the system starts counting again. Whoever was at your site before is not recognized as a returning visitor but simply counted as a visitor again.
Unique Visitors: The system recognizes the visit’s origin – the visitor – over a specified period. Each visitor visiting your site or page within the specified period is counted only once. Let’s take a closer look at the methodology Similarweb and Google Analytics uses to identify website unique visitors and collect the information.

How are Unique Visitors calculated?
There is no standard in the market for measuring the number of unique visitors; hence there are slight discrepancies between tools.
- Google Analytics and its cookies
Most of you are familiar with Google’s definition: “Unique visitors is the number of unduplicated (counted only once) visitors to your website over the course of a specified time period.”
To be more precise, Google identifies the same IP address by placing a cookie. Google can’t identify the actual person. If the same visitor enters from a different device or browser, each will count as a unique visitor. Another scenario that renders this method slightly inaccurate: users can erase cookies, or different family members can enter a site from the same device and browser.
- Similarweb Unique Visitors Per Month (UVPM) identification method
Unlike other traffic analysis tools , Similarweb does not rely on cookies , which are often considered an unstable data collection mechanism, as explained above.
As a result, cookie-based technologies tend to overestimate the number of unique visits; they will often show higher numbers than the Similarweb software.
Similarweb collects data from a variety of sources, including a large panel composed of users who share their anonymous clickstream data. Each device in the panel receives its own unique ID, which translates into a unique user.
Under Monthly Unique Visitors , you will see the number of users who visited the specified web location one or more times during the monthly period.

- Similarweb Daily Unique Visitors – are they different?
Again, Similarweb’s technology does not use cookies to identify Unique Users; therefore, the differentiation between a visitor and a unique visitor isn’t really relevant. We refer to visitors as daily unique visitors.
Unique visitors function as a basis for many of our traffic and engagement metrics. We calculate unique visitors for desktop and mobile web, which means the traffic for the calculator is the sum of both.
Monitoring daily unique visitors lets you improve website stickiness and engagement, evaluate peak traffic days, and much more.
- Closely related metric: Visits per Unique Visitor
The next metric to look at in your traffic analysis is Visits per Unique Visitor if you want to understand your unique visitors‘ behavior and engagement. With Similarweb, you can choose a time frame and region and monitor how many visits a user made and how many pages they viewed on average.
But that’s a topic for another post. Read here how to leverage Page Views and benchmark against your competitors .

How to use competitor’s unique visitors metric to amplify your digital strategy
Here’s one thing to remember about your target audience : It’s also your competitors’ target audience. So if you want to increase your unique visitors, you need to look at successful best-in-class companies along with players in your market showing significant growth.
Step 1 – Establish key competitors to analyze
First, identify which competitors generate the most unique visitors. They could be industry leaders or rising stars. At this point, it’s not about doing a full-blown competitive analysis, we’re simply going to find those people showing the highest number of unique visitors.
Ready? Then, let’s begin.
Action: List between 5-10 competitors to analyze as part of this task.
Tip : You can use Similarweb to identify market leaders and high-growth sites in your industry.
Step 2 – Establish the industry average
Understanding the industry average is a great starting point when setting any goals. In the next section, we list a few industry averages for the UVPM metric. But to gain an apples-for-apples representation and build a measurable strategy; establish your industry benchmarks.
Tip: In the same place on the Similarweb platform you can grab a snapshot of your industry benchmarks.

Here, you can view the standard industry benchmark for unique visitors, monthly visits, visit duration, pages per visit, and bounce rate. If you want, you can drill down and analyze specific competitors to get an idea of their individual wins and losses.
Step 3 – Do a quick competitive analysis of traffic and engagement stats
Unique visitors is one of the crucial engagement metrics to include in your analysis. But, it doesn’t always show the full story. At this point, you also need context, as this is where the biggest opportunity to find insights exist.
Action: Look at key metrics, like:
- Unique visitors
- Page visits
- Bounce rate
- Time on page
You can use these additional engagement metrics to get a more granular view and record the metrics to give you a point-in-time view that you can refer back to.
Here’s a quick example of how this exercise can help you find opportunities to grow the number of unique visits to your site.
If your number of unique visitors is higher than that of your competitors, but your bounce rate is also higher, this raises the question of how well your site meets the visitors’ expectations.
- Are the visitors you attract the right persona for your business?
- Are your meta descriptions aligned with the content on the page or do they mislead?
- Is your site navigation simple and is it easy for people to find what they need?
- Are your consumer journeys considered and clearly mapped?
There are a lot of questions you can ask once you unpack these metrics. But before you can break things down, it’s important you grab these other metrics to give you a complete picture of what’s happening on a site.
Step 4 – Examine marketing channels that drive the most unique visitors
Next, review rival’s marketing channels to see which drives the most traffic and unique visitors to their site.
Helpful: Make sure you record your findings in an easy format. Our downloadable competitive analysis frameworks are handy for this purpose.
Let’s say competitor A receives a significant amount of traffic from display ads; while your ad campaign performance is average. Rather than comparing all your competitor’s ads, you can now focus on analyzing this particular company’s campaigns because you know they work.
- Which keywords they target
- What they offer
- The types of CTAs they use
- How they design and word their ads
Similarly, you might discover a rival with a high number of social referrals, specifically from one platform. You can again, hone in and unpack their social strategy to emulate their success and get more unique visitors to your site.

Using Similarweb, you can view the marketing channels any business uses to drive traffic to their site. Along with each channel’s relative success. By clicking on any channel – let’s take display ads as an example, you can drill down even further to see the types of creatives being used, top publishers , landing pages, and more.
You can use the information from this process can help fine-tune your digital strategy. And help you understand your market position in all aspects of website traffic to identify areas of improvement too.
What is a good number of unique visitors based on my industry?
Before we answer this question, let’s remember that even companies in the same industry can be very different, to the point they often pursue different goals. A fashion website offering exclusive designer accessories does not need to generate the same amount of unique visitors as a popular consumer brand of affordable clothing.
Measuring unique visitors to your site is essential as an indicator of how successful you are driving traffic to your site . But it would be a mistake to stop there. What’s even more important is the quality of your traffic.
So, what are considered high-quality visitors for you? Those who will buy your products, use your service, engage with your website, and return for more. This is your target audience – and to attract them, you need to know who they are and what they are looking for. Successful competitors with the same target audience already know . That’s why they are a perfect place for you to start.
Similarweb’s dataset provides information that identifies your website’s demographics and your users’ online behavioral patterns.
You are not operating in a bubble, and the audience is not yours alone. Once you understand that, you also understand that viewing the stats for your own site, as Google Analytics lets you do, does not provide you with the full picture.
To get you started, here are the industry benchmarks we promised:
Average monthly Unique Visitors per key industries
Below are the monthly unique visitors benchmarks for five key industries. It’s important to check the changes on a monthly basis to ensure you’re always reviewing the most up-to-date figures.
Average monthly unique visitors for ecommerce and shopping websites, Aug 2022

Based on the top 100 ecommerce sites globally, the average number of unique visitors in the ecommerce industry is 122.5 million.
Average monthly unique visitors for finance websites, Aug 2022

Based on the top 100 finance sites globally, the average number of unique visitors in the finance industry is 311.2 million.
Average monthly unique visitors for news and media websites, Aug 2022

Based on the top 100 sites globally, the average number of unique visitors in the news and media industry is 410.7 million.
Average monthly unique visitors for CPG websites, Aug 2022

Based on the top 100 sites globally, the average number of unique visitors in the CPG industry is 1.166 million.
Average monthly unique visitors for TV and Streaming websites, Aug 2022

Go a Step Further with Similarweb
Similarweb Digital Research Intelligence can help with every stage of your analysis. And, if you’re interested, you can dig a little deeper, and discover audience demographics of the unique visitor metrics – either for your own site or that of your rivals.
In each stage of the 4-step process, you can use Similarweb to quickly view and record key website and engagement metrics. If you want to quickly track your performance or check in on how your rivals are performing at any point in time – Similarweb Digital Research Intelligence should be your tool of choice.
To get under the hood and explore the demographics of any site’s visitors, you can use the audience analysis tool to view things like:
Here, you see a complete set of demographics for a site. This includes traffic share by country, bounce rates, visit duration, page views, growth, and traffic share . Next, you get to see gender and age stats, visitor browsing behaviors, and interests.
Audience Overlap
If you want to benchmark unique visitors with key players in a market, the audience overlap feature is the quickest and easiest way to visualize how you stack up.

Here, you can compare up to five sites at a time, and see the respective UVPM for each company. At a glance, you can view audience overlap, which is the cross-visitation of a shared audience, and unreached potential visitors too.
When combined with your initial unique visitors analysis, traffic & engagement – these demographics give you x-ray vision into any site, its marketing strategies, and its target audience.
I know it’s a lot of data – but you know what they say?
Wrapping up: Unique Visitors
For any business, the unique visitors metric is a powerful KPI. It measures how successful (or not) a company is at driving new traffic to its website.
However, just looking at UVPM alone is not enough to prove success or improve performance. It’s one piece of a larger puzzle that can only be understood when complete.
Follow the steps we’ve outlined, and start leveraging the unique visitor metric to analyze competitors and outline a plan to increase your net-new traffic – today.
Boost Your Market Research with Similarweb
Enjoy 360° visibility into your industry and instantly adapt to market changes
What are unique visitors?
A unique visitor is a person who has visited a website at least once and is counted only once in the reporting time period.
What does UVPM stand for?
UVPM is short for unique visitors per month. It’s a common website and engagement benchmark that tells you how many unique visitors came to a site. It excludes repeat visitors and only counts their first visit.
How do you analyze unique visitors?
To analyze unique visitors, divide the number of visits by the number of unique visitors to yield the number of visits per individual user.
What is a high-quality visitor?
A high-quality visitor is one that will buy your products, use your service, engage with your website, and return for more.
Related Posts

Marketing OKRs: How to Stay Focused and Hit Your Targets

Digital Marketing Strategy: A Beginner’s Guide

What is a Marketing Plan and How Do You Create One?

How to Conduct a Social Media Competitor Analysis: 5 Quick Steps

How to Do an Ecommerce Competitor Analysis in 2024

Industry Benchmark Analysis 2024: Is Your Marketing Strategy Aligned?
Wondering what similarweb can do for you.
Here are two ways you can get started with Similarweb today!

Sign in to Community
Sign in to view all badges
Expand my Community achievements bar.

Adobe Analytics
What’s the difference between visitor, visits, and hits adobe analytics containers.

- Subscribe to RSS Feed
- Mark as New
- Mark as Read
- Printer Friendly Page

You must be a registered user to add a comment. If you've already registered, sign in. Otherwise, register and sign in.
- Certifications
- Instructor-led training
- View all learning options
Documentation
- Documentation home
- Experience Cloud release notes
- Document Cloud release notes
- Community home
- Community Advisors
- Experience League Showcase
- Advertising
- Audience Manager
- Campaign Classic v7 & Campaign v8
- Campaign Standard
- Experience Cloud
- Experience Manager Sites & More
- Experience Platform
- Journey Optimizer
- Real-Time Customer Data Platform
- Creative Cloud
- Document Cloud
- Marketo Engage
- Experience Cloud support
- Document Cloud support
- Community forums
- Adobe Developer
- Adobe status
Adobe account
- Log in to your account
- Corporate responsibility
- Investor Relations
- Supply chain
- Trust Center
- Diversity & Inclusion
- COVID-19 Responses
Misunderstood Metrics: New Users vs New Visitors in Google Analytics
Discrepancies in the new vs returning users behavior report.
You might have looked at your Behavior > New vs Returning users report in Google Analytics (GA) at some point and noticed some odd discrepancies in the numbers (see visual below).

Some immediate questions come to mind here:
- Why don’t the total number of New Visitors and Returning Visitors add up to overall Users?
- Why are there different terms for New Visitors and New Users?
- Why is the number of New Visitors different from the number of New Users?
Users vs Visitors
First thing to clarify is a Visitor vs a User:
Users (#1): Unique count of the total number of people that came to your site.*
Visitors (#3 & #4): User-level label that is applied to the person that came to your site. Any returning visitor was also a new visitor and does not lose the “new visitor” label just because the “returning visitor” one was added.
New and returning visitors are not mutually exclusive numbers, meaning that there is overlap between the two groups. If you came in as a new user during the time period being looked at, and later came back as a returning user in that same time period, then you’d appear in both the New Visitor and Returning Visitor counts. Therefore, when you sum up #3 and #4 in our visual, they don’t equal #1. That #1 is showing overall Users, with no duplicative statuses - so truly the unique count of users that came to your site during that time period.
New Users vs New Visitors
New User: The session-level status of a user who has never visited the site before. You can appear as a new user twice over the course of two sessions.
New Visitor: The user-level status of a user who has never visited the site before. You can only appear as a new visitor once.
A New User, meaning #2 and #5 in our visual, is the number of times a session was started with a user who had never visited the site before. But the question remains, why is the number of New Visitors (#3) different from the number of New Users (#2 and #5)?
This relates to the fact that GA automatically breaks and restarts sessions at midnight.

The breaking of sessions at midnight is a debatable choice by Google, but it exists nonetheless. If a new user is on the site at 11:50 PM, GA assigns a unique client ID cookie to them (ID: 123). This user is recognized in GA as a new visitor and a new user. 10 minutes later, the session breaks at midnight, and a new session is started on Day 2.
GA sees the same client ID (ID: 123) and knows this is the same new user from before, despite a new session being force-started.
GA attributes this post-midnight session as having a new user again since they technically aren’t a returning visitor, meaning we now have 2 sessions and 2 new user counts - one of each for both days.
However, they only count as one new visitor since “visitor” references the user-level status of the visitor, while “new user” relates to the session-level. So our Day 2 new user, no matter what site actions they take, is a new visitor and can only be counted once as such - i.e., if a user comes back as a new user multiple times (which seems illogical but is what happens in the case we’re discussing), they only are counted as a new visitor once, and if they come back as a returning user multiple times (this at least makes sense), they are only counted as a returning visitor once.
This tells us that New User, despite the name, is actually session-scoped, while New Visitor is user-scoped. Read more about what scope is and why it’s super important in GA .
Knowing that new users actually relates to the session count, we understand why #2 in our visual is equal to #6 with the total count of new user sessions.
The new and returning user sessions, #6 and #7, total up to the overall number of sessions, #8, as expected (so #6 + #7 = #8).
How to Accurately Calculate New vs Returning Users
Now that we know all of this, how do you actually calculate the number of new vs returning users? You can do this by using the following formulas:
- Returning Users = Returning Visitors
- New Users = Overall Users - Returning Visitors
OR if you refer to our visual:

- Returning Users = #4
- New Users = #1 - #4
For more information on GA idiosyncrasies, read on to the Seer Blog or subscribe to our newsletter below!

We love helping marketers like you.
Sign up for our newsletter to receive updates and more:
Related Posts

- Help Center
- Analytics for beginners
- Migrate from UA to GA4
- Manage accounts, properties, and users
- Manage data
- Understand reports
- Google Ads and attribution
- Audiences and remarketing
- Integrations
- Privacy Policy
- Terms of Service
- Submit feedback
- Announcements
- Analytics for beginners The value of digital analytics How Google Analytics 4 works How Google Analytics is organized Structure your Analytics account Set up Analytics for a website and/or app Set up data collection for an app Confirm data is being collected in Analytics How to navigate Analytics About events Set up and manage conversion events Get started with reports Link Google Ads and Analytics Get started with Advertising Google Analytics 4 training and support
- Migrate from UA to GA4 Introducing Google Analytics 4 (GA4) Universal Analytics versus Google Analytics 4 data How to check property type About connected site tags Make the switch to Google Analytics 4 (Migration guide) Common mistakes with tag setup Confirm data is being collected in Analytics Set up data collection for an app How to navigate Analytics Events in Google Analytics 4 vs Universal Analytics Google Analytics 4 training and support
- Manage accounts, properties, and users How Google Analytics is organized Create an organization Switch between accounts and properties Structure your Analytics account Edit / delete accounts, properties, and data streams Move a property Delete / restore accounts and properties Access and data-restriction management Add, edit, and delete users and user groups Universal Analytics view-related features in Google Analytics 4 properties View the history of account/property changes
- Manage data About events Universal Analytics versus Google Analytics 4 data Monitor events in debug mode About modeled conversions Set up and manage conversion events Set up cross-domain measurement Identify unwanted referrals Filter, report on, or restrict access to data subsets Data retention Data-deletion requests About Data Import
- Understand reports Get started with reports Data freshness Dimensions & metrics Get started with Explorations Reporting identity Analytics Insights
- Google Ads and attribution Link Google Ads and Analytics Advertising snapshot report Get started with Advertising About attribution and attribution modeling Select attribution settings Conversion paths report Model comparison report Google Ads links migration tool Goal and conversion migration guide
- Audiences and remarketing Create, edit, and archive audiences Audiences migration guide Suggested audiences Audience triggers Predictive metrics Predictive audiences Enable remarketing with Google Analytics data Activate Google signals for Google Analytics 4 properties Remarketing lists for search ads
- Integrations Link Google Ads and Analytics BigQuery Export integration Analytics Search Ads 360 integration Display & Video 360 integration Firebase integration Search Console integration Google Merchant Center integration Google Ad Manager integration Salesforce Marketing Cloud reporting integration
- Universal Analytics properties
- Report and analyze
- Acquisition reports
[UA] The difference between Google Ads Clicks, and Sessions, Users, Entrances, Pageviews, and Unique Pageviews in Analytics
Data in your Analytics account can be easy to misinterpret due to the many similar terms used in different reports. This article explains the terms that most often lead to questions.
Clicks vs. Sessions
Clicks vs. users, sessions vs. users, sessions vs. entrances, pageviews vs. unique pageviews.
There is an important distinction between clicks (such as in your Google Ads reports) and sessions (such as in your Audience reports). The Clicks column in your reports indicates how many times your advertisements were clicked by users, while Sessions indicates the number of unique sessions initiated by your users. There are several reasons why these two numbers may not match: A user may click your ad multiple times. When one person clicks on one advertisement multiple times in the same session, Google Ads records multiple clicks while Analytics recognizes the separate pageviews as one session. This is a common behavior among users engaging in comparison shopping. A user may click on an ad, and then later, during a different session, return directly to the site through a bookmark. The referral information from the original session is retained in this case, so the one click results in multiple sessions. A user may click on your advertisement, but prevent the page from fully loading by navigating to another page or by pressing the browser's Stop button. In this case, the Analytics tracking code is unable to execute and send tracking data to the Google servers. However, Google Ads still registers a click. To ensure more accurate billing, Google Ads automatically filters invalid clicks from your reports. However, Analytics reports these clicks as sessions on your website in order to show the complete set of traffic data. Learn more about the differences between clicks and sessions .
There is an important distinction between clicks (such as in your Google Ads reports) and users (such as in your Audience reports). The Clicks column in your Google Ads reports indicates how many times your advertisements were clicked by users, while Users indicates the number of unique (deduplicated) users who clicked your ads. There are several reasons why these two numbers may not match: A user may click your ad multiple times. When one person clicks on one advertisement multiple times in the same session, Google Ads records multiple clicks while Analytics recognizes a single user. This is a common behavior among users engaging in comparison shopping. A user may click on your advertisement, but prevent the page from fully loading by navigating to another page or by pressing the browser's Stop button. In this case, the Analytics tracking code is unable to execute and send tracking data to the Google servers, and no user is counted in this case. However, Google Ads still registers a click. To ensure more accurate billing, Google Ads automatically filters invalid clicks from your reports. However, Analytics reports all users who clicked ads in order to show the complete set of traffic data.
Analytics measures both sessions and users in your account. Sessions represent the number of individual sessions initiated by all the users to your site. If a user is inactive on your site for 30 minutes or more, any future activity is attributed to a new session. Users that leave your site and return within 30 minutes are counted as part of the original session. The initial session by a user during any given date range is considered to be an additional session and an additional user . Any future sessions from the same user during the selected time period are counted as additional sessions , but not as additional users .
Sessions are incremented with the first hit of a session, whereas entrances are incremented with the first pageview hit of a session. If the first hit of the session is not a pageview, you may see a difference between the number of session and the number of entrances .
A pageview is defined as a view of a page on your site that is being tracked by the Analytics tracking code. If a user clicks reload after reaching the page, this is counted as an additional pageview. If a user navigates to a different page and then returns to the original page, a second pageview is recorded as well. A unique pageview , as seen in the Content Overview report, aggregates pageviews that are generated by the same user during the same session. A unique pageview represents the number of sessions during which that page was viewed one or more times.
Was this helpful?
Need more help, try these next steps:.

Check out google.com/analytics/learn , a new resource to help you get the most out of Google Analytics 4. The new website includes videos, articles, and guided flows, and provides links to the Google Analytics Discord, Blog, YouTube channel, and GitHub repository.
Start learning today!
- Tag Management
- Experimentation
- Attribution
- Data Studio
We’ve moved. For new posts about enterprise products, check out the new Google Marketing Platform blog . For information on free products, follow our new Google Analytics products blog . Don’t worry: We’ll still keep this blog around in case you want to check out past posts.
"Absolute Unique Visitors" versus "New and Returning"
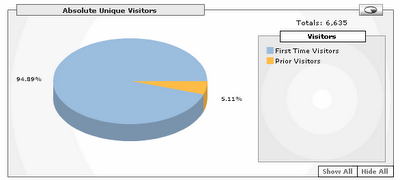
- Advanced Topics 85
- Analytics 50
- Analytics 360 Suite 39
- Announcements 238
- Attribution 34
- Beginner Topics 52
- Business Insights 84
- Case Study 64
- Data Studio 28
- Developer 43
- Experimentation 21
- Features 105
- Learning Resources 45
- Optimize 17
- Partners 29
- Related Products 45
- Surveys 360 8
- Training and Events 103
Learning Center
- Analytics Academy
- Demo Account
- User to User Forum
- Help Center
Company-wide
- Official Google Blog
- Research Blog
- Student Blog
- Official Android Blog
- Chrome Blog
- Lat Long Blog
- Developers Blog
- Ads Developer Blog
- Android Developers Blog
IMAGES
VIDEO
COMMENTS
The Difference Between Visits and Visitors. Before delving into actionable strategies and best practices, it is essential to clarify what we mean by 'visits' and 'visitors' in the context of Google Analytics. Visits, also referred to as 'sessions,' represent a group of interactions that take place on your website within a given timeframe. A ...
Click To Tweet. Let's quickly recap the distinction between these two metrics: A page view occurs whenever a browser loads your site. Therefore, one visitor can generate many page views. A visit occurs whenever someone arrives at your page from an external source, such as Google search results or another website.
Unique visitors are identical to visitors on a daily basis (Day 1: Unique visitors = Visitors = 3). If we now consider a period of several days, we obtain 8 Visitors (3+1+2+2+2+2, the Day Visitors are added together), and 3 Unique Visitors (deduplicated). In the Analytics Suite, unique visitors can also be analysed on multiple websites (level 1).
Average Visit Duration is the time difference between when someone viewed the first and last pages in a visit. Google Calculates the average visit duration by adding the total amount of time available during the date range you specify and dividing that number by the total number of visits. For Example: Total Visits Duration: 1000 minutes
As Bryan Ng of Coup 365 says, "Users are unique, and sessions are how many times a page was being visited. User (Z) can visit your webpage 10 times, and that counts 10 sessions and 1 user. User (Y) visits the same webpage 5 times, and that counts 5 sessions and 1 user. Webpage total: 15 sessions and 2 users.".
There are three main metrics in Google Analytics terminology: Page Views, Visitors and Unique Visitors. They are each slightly different. First there is the concept of a Visit. This is essentially a browsing session. Visits last until there is 30 minutes of inactivity, or at midnight.
Key takeaways. In Google Analytics 4, visitors are called users, and visits are called sessions. GA4 groups distinct users in four different buckets. As a result, you can see 4 types of unique visitors in GA4. GA4 uses four methods to track users and identify them as unique visitors. You can change the way GA4 tracks visitors, but it's risky.
Meaningful Metrics: New and Returning Visitors. Caveat: because of the way Google Analytics works, a user will be identified as a New User if they use different devices or have enabled privacy settings. This means you do not know if a "New User" is actually new. However you can be very confident that a Returning Visitor is really is returning.
Google Analytics unique visitors are one of the most important web analytics metrics and shows you insights regarding the growth and evolution of your site's audience. An increase in the total number of unique visitors means that your site is being accessed by new people over a certain time period.
The biggest change you'll notice is the switch from "visits" and "visitors" to sessions and users. No longer will you see the term "visit" in Google Analytics. The switch in wording is something you will just have to get used to. The data itself isn't going to change, though. A session is still the period in which a visitor ...
To create a new vs returning visitors table in GA4: Go to Explore. Then create a Free form report. Under Dimensions select New / established . New / established is like new vs returning. Instead of new meaning it is the first visit, it means the first visit is within the last seven days.
In this #webquickie video, I will explain the difference between users, sessions, hits, and page views in Google Analytics and I'll mention how visitors and ...
Pageviews vs Sessions. A session is a unique period of activity for a user. If you have the same visitor viewing your site multiple times in one day, they will be counted as multiple sessions. Google Analytics counts a single session as a period of activity for a single user. The session duration can be any length of time that an individual ...
The Difference Between New and Returning Visitors. We know: the difference between new and returning visitors seems pretty self-explanatory, and for the most part, it is! But Google does differentiate between the two a little differently than you and I might. New Visitors are those navigating to your site for the first time on a specific device ...
Pageviews > Unique Pageviews > Sessions = Entrances = Visits. Now that some of the confusion has been cleared, you can start using these measurements to your benefit. These metrics are common in most Google Analytics reports, and there are many more that can be used to help improve your site's performance. Check out this article: Bounce Rate vs ...
Visitors: In Google Analytics, visits from the same browser or terminal are defined as coming from the same visitor if they arrive on the same day. In other words. "Visitors" count the users that visit your site in a single day. The following day, the system starts counting again.
Visitors based on custom variables: form field, defined categories, customer ID. These segments are then further broken down into containers, which are based on a Visitor, Visits, and Hits. Knowing the difference of these three is very important, as it determines what is both included and excluded in the segment. Visitor Container.
First thing to clarify is a Visitor vs a User: Users (#1): Unique count of the total number of people that came to your site.*. Visitors (#3 & #4): User-level label that is applied to the person that came to your site. Any returning visitor was also a new visitor and does not lose the "new visitor" label just because the "returning ...
Analytics for beginners; Migrate from UA to GA4; Manage accounts, properties, and users; Manage data; Understand reports; Google Ads and attribution; Audiences and remarketing; Integrations; Community; Analytics
When Google Analytics says "new visitors" or "returning visitors", they mean "visits by new users", or "visits by returning users". For example user A has visited your site before today and user B is new. Each visits 2 times on the same day separated by at least 30 minutes: User A Visit 1: Returning user, Returning visitor; Visit 2: Returning ...
ga:visits means visits. A visitor may make multiple visits in a date range. A visitor may make multiple visits in a date range. Also see this Google Analytics help page .
However, Analytics reports these clicks as sessions on your website in order to show the complete set of traffic data. Learn more about the differences between clicks and sessions. Clicks vs. Users. There is an important distinction between clicks (such as in your Google Ads reports) and users (such as in your Audience reports).
For our first post of 2007, we'd like to add clarity to the difference between two reports that you are probably already using. Among the vast array of reports that Google Analytics provides, "Absolute Unique Visitors" and "New vs. Returning" are two that give information on what percentage of visitors your website retains .