Suggestions or feedback?

MIT News | Massachusetts Institute of Technology
- Machine learning
- Social justice
- Black holes
- Classes and programs
Departments
- Aeronautics and Astronautics
- Brain and Cognitive Sciences
- Architecture
- Political Science
- Mechanical Engineering
Centers, Labs, & Programs
- Abdul Latif Jameel Poverty Action Lab (J-PAL)
- Picower Institute for Learning and Memory
- Lincoln Laboratory
- School of Architecture + Planning
- School of Engineering
- School of Humanities, Arts, and Social Sciences
- Sloan School of Management
- School of Science
- MIT Schwarzman College of Computing
Study reveals a universal travel pattern across four continents
Press contact :, media download.

*Terms of Use:
Images for download on the MIT News office website are made available to non-commercial entities, press and the general public under a Creative Commons Attribution Non-Commercial No Derivatives license . You may not alter the images provided, other than to crop them to size. A credit line must be used when reproducing images; if one is not provided below, credit the images to "MIT."

Previous image Next image
What explains how often people travel to a particular place? Your intuition might suggest that distance is a key factor, but empirical evidence can help urban studies researchers answer the question more definitively.
A new paper by an MIT team, drawing on global data, finds that people visit places more frequently when they have to travel shorter distances to get there.
“What we have found is that there is a very clear inverse relationship between how far you go and how frequently you go there,” says Paolo Santi, a research scientist at the Senseable City Lab at MIT and a co-author of the new paper. “You only seldom go to faraway places, and usually you tend to visit places close to you more often. It tells us how we organize our lives.”
By examining cellphone data on four continents, the researchers were able to arrive at a distinctive new finding in the urban studies literature.
“We might shop every day at a bakery a few hundred meters away, but we’ll only go once a month to the fancy boutique miles away from our neighborhood. This kind of intuitive notion had never been empirically tested. When we did it we found an incredibly regular and robust law — which we have called the visitation law,” says Carlo Ratti, a co-author of the paper and director of the Senseable City Lab, which led the research project.
The paper, “The universal visitation law of human mobility,” is published today in Nature .
The paper is co-authored by Markus Schläpfer, a scholar in the Urban Complexity Project at the ETH Future Cities Lab in Singapore; Lei Dong, a researcher at Peking University in Beijing; Kevin O’Keeffe, a postdoc at the MIT Senseable City Lab; Santi, a research director at Istituto di Informatica e Telematica, CNR (the National Research Council of Italy); Michael Szell, an associate professor in Data Science at IT University of Copenhagen; Hadrien Salat of the Future Cities Laboratory, Singapore-ETH Centre; Samuel Anklesaria, a researcher at the MIT Senseable City Lab; Mohammad Vazifeh, a senior postdoc at the MIT Senseable City Lab; Ratti; and Geoffrey West, a professor at and former president of the Santa Fe Institute. Schläpfer, Dong, Santi, and Szell are also former members of the Senseable City Lab.
To conduct the study, the researchers used anonymized cellphone data from large communications providers to track the movement of people in the metro areas of Abidjan, Ivory Coast; Boston; Braga, Lisbon, and Porto, Portugal; Dakar, Senegal; and Singapore.
Cellphone data are ideal for this kind of study because they establish both the residence area of people and the destinations they travel to. In some cases, the researchers defined areas visited by using grid spaces as small as 500 square meters. Overall, the researchers charted over 8 billion location-indicating pieces of data generated by over 4 million people, charting movement for a period of months in each location.
And, in each case, from city to city, the same “inverse law” of visitation held up, with the charted data following a similar pattern: The frequency of visits declined over longer distances, and higher-density areas were filled with people who had, on aggregate, taken shorter trips. To the extent that there was some variation from this pattern, the largest deviations involved sites with atypical functions, such as ports and theme parks.
The paper itself both measures the data and presents a model of movement, in which people seek out the closest locations that offer particular kinds of activity. Both of those buttress “central place theory,” an idea developed in the 1930s by German scholar Walter Christaller, which seeks to describe the location of cities and towns in terms of the functions they offer to people in a region.
The scholars note that the similarity in movement observed in very different urban areas helps reinforce the overall finding.
“This generalized behavior is not just something you observe in Boston,” Santi says. “From a scientific viewpoint, we are adding evidence about a generalized pattern of behavior.”
The researchers also hope the finding, and the methods behind it, can be usefully applied to urban planning. Santi suggests this type of study can help predict how substantial changes in the physical layout of a city will affect movement within it. The method also makes it possible to examine how changes in urban geography affect human movement over time.
“The visitation law could have many practical applications — from the design of new infrastructure to urban planning,” adds Ratti. “For instance, it could help implement the concept of the ‘Fifteen-Minute City,’ which aims to reorganize physical space around walkable neighborhoods and which has become very popular during the Covid-19 pandemic. Our law suggests that we can indeed capture a large fraction of all urban trips within a fifteen-minute radius, while leaving the rest — perhaps 10 percent — further away.”
Support for the research was provided by the National Science Foundation, the AT&T Foundation, the Singapore-MIT Alliance for Research and Technology (SMART), the MIT Center for Complex Engineering Systems, Audi Volkswagen, BBVA, Ericsson, Ferrovial, GE, the MIT Senseable City Lab Consortium, the John Templeton Foundation, the Eugene and Clare Thaw Charitable Trust, the U.S. Army Research Office Minerva program, the Singapore National Research Foundation, and the National Natural Science Foundation of China.
Share this news article on:
Press mentions, financial times.
Writing for the Financial Times , Prof. Carlo Ratti explores the concept of the “15-minute city,” which is aimed at creating walkable neighborhoods. “The 15-minute city must be paired with investment in transport between neighborhoods,” writes Ratti, noting that investment is especially needed in public transportation to ensure that 15-minute cities do not contribute to greater segregation.
Motherboard
Researchers from the MIT Senseable City Lab have uncovered a new travel pattern in human mobility that remains consistent across four continents, reports Beck Ferreira for Motherboard . “The notion that distance and frequency of visitation are related is in accordance with intuition,” the researchers explain. “What is surprising is that the relationship between these two quantities can be described by a simple and clean mathematical law.”
United Press International (UPI)
UPI reporter Brooks Hays writes that a new study by MIT researchers finds that people tend to follow a predictable travel pattern that remains consistent in countries around the world. The findings could help urban planners “better understand how populations interact with their surroundings, as well as assist city planners with zoning, infrastructure and other development decisions,” writes Hays.
Previous item Next item
Related Links
- Carlo Ratti
- Paolo Santi
- Senseable City Lab
- Department of Urban Studies and Planning
- School of Architecture and Planning
Related Topics
- Urban studies and planning
- National Science Foundation (NSF)
- Transportation
- Social sciences
Related Articles

Tracking contagion in cities, using mobile phone data

Taking a city’s pulse with moveable sensors

Study: Commuting times stay constant even as distances change
More mit news.

Two from MIT awarded 2024 Paul and Daisy Soros Fellowships for New Americans
Read full story →

MIT Emerging Talent opens pathways for underserved global learners

The MIT Edgerton Center’s third annual showcase dazzles onlookers

3 Questions: A shared vocabulary for how infectious diseases spread

Seven from MIT elected to American Academy of Arts and Sciences for 2024

Two MIT teams selected for NSF sustainable materials grants
- More news on MIT News homepage →
Massachusetts Institute of Technology 77 Massachusetts Avenue, Cambridge, MA, USA
- Map (opens in new window)
- Events (opens in new window)
- People (opens in new window)
- Careers (opens in new window)
- Accessibility
- Social Media Hub
- MIT on Facebook
- MIT on YouTube
- MIT on Instagram
Trip chaining patterns of tourists: a real-world case study
- Published: 14 September 2023
Cite this article

- Cong Qi 1 ,
- Jonas De Vos 2 ,
- Tao Tao 3 ,
- Linxuan Shi 4 &
- Xiucheng Guo 1
356 Accesses
3 Altmetric
Explore all metrics
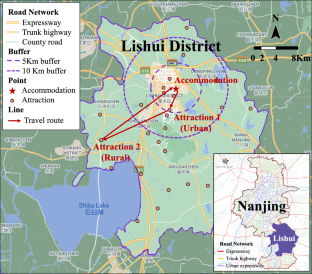
Insights into tourist travel behaviours are crucial for easing traffic congestions and creating a sustainable tourism industry. However, a significant portion of the literature analysed tourist travel behaviour by predefined tourist trip chains which result in the loss of more representative classification. Using tourist travel survey data from Nanjing, China, this paper presents an innovative methodology that combines the tourist trip chain identification and the trip chain discrete choice model to comprehensively analyse the travel behaviour of tourists. The discretized trip chains of tourists are clustered using the ordering points to identify the clustering structure (OPTICS) clustering algorithm to identify typical tourist trip chains, which will then be considered as the dependent variable in the nested logit model to estimate the significant explanatory variables. The clustering results show that there are two main categories, namely single and multiple attraction trip chains, and seven subcategories, which were named according to the characteristics of trip chains. The clustering result is analysed and three main trip chain patterns are derived. Departure city, travel cost, travel time, and travel mode show significant influence on the choice between single and multiple attraction trip chains. The urban attraction trip chain is more favoured by tourists with children, and the typical trip chain shows stronger dependence on travel intention. Visiting Lishui for the first time only affects the choice of the multiple suburban attraction trip chain. These findings are valuable for optimising tourist public transport infrastructure, promoting travel by public transport and better tourism management.
This is a preview of subscription content, log in via an institution to check access.
Access this article
Price includes VAT (Russian Federation)
Instant access to the full article PDF.
Rent this article via DeepDyve
Institutional subscriptions
Smart tourism: foundations and developments.

Ride-hailing, travel behaviour and sustainable mobility: an international review

What is a walkable place? The walkability debate in urban design
Afshardoost, M., Eshaghi, M.S.: Destination image and tourist behavioural intentions: a meta-analysis. Tour. Manag. 81 , 104154 (2020). https://doi.org/10.1016/j.tourman
Article Google Scholar
Ankerst, M., Breunig, M.M., Kriegel, H.-P., et al.: OPTICS: ordering points to identify the clustering structure. ACM SIGMOD Conf. 28 (2), 49–60 (1999). https://doi.org/10.1145/304182.304187
Balac, M., Horl, S., Schmid, B.: Discrete choice modeling with anonymized data. Transportation (2022). https://doi.org/10.1007/s11116-022-10337-1
Bautista-Hernández, D.A.: Individual, household, and urban form determinants of trip chaining of non-work travel in México City. J. Transp. Geogr. 98 , 103227 (2022). https://doi.org/10.1016/j.jtrangeo.2021.103227
Chen, X., Wan, X., Li, Q., et al.: Trip chain based travel mode shares driven framework using cellular signaling data and web based mapping service data. Transp. Res. Rec. 2673 (3), 51–64 (2019). https://doi.org/10.1177/0361198119834006
Chen, Y., Dai, Y., Liu, A., et al.: Can the COVID-19 risk perception affect tourists’ responsible behavior intention: an application of the structural equation model. J. Sustain. Tour. (2021). https://doi.org/10.1080/09669582.2021.1977938
Daisy, N.S., Millward, H., Liu, L.: Trip chaining and tour mode choice of non-workers grouped by daily activity patterns. J. Transp. Geogr. 69 , 150–162 (2018). https://doi.org/10.1016/j.jtrangeo.2018.04.016
Daisy, N.S., Liu, L., Millward, H.: Trip chaining propensity and tour mode choice of out-of-home workers: evidence from a mid-sized Canadian city. Transportation 47 (2), 763–792 (2020). https://doi.org/10.1007/s11116-018-9915-2
Duan, Z., Wang, C., Zhang, H.M., et al.: Using longitudinal mobile phone data to understand the stability of individual travel patterns. Transp. Res. Rec. 2643 (1), 166–177 (2017). https://doi.org/10.3141/2643-18
Feng, X., Sun, H., Wu, J., et al.: Trip chain based usage patterns analysis of the round trip carsharing system: a case study in Beijing. Transp. Res. Part A Policy Pract. 140 , 190–203 (2020). https://doi.org/10.1016/j.tra.2020.08.017
Gao, G., Sun, H., Wu, J.: Activity based trip chaining behavior analysis in the network under the parking fee scheme. Transportation 46 (3), 647–669 (2019). https://doi.org/10.1007/s11116-017-9809-8
García, J., Juaneda, C., Raya, J.M., et al.: A study of traveller decision making determinants: prioritizing destination or travel mode? Tour. Econ. 21 (6), 1149–1167 (2015). https://doi.org/10.5367/te.2015.0517
Gross, S., Grimm, B.: Sustainable mode of transport choices at the destination public transport at German destinations. Tour. Rev. 73 (3), 401–420 (2018). https://doi.org/10.1108/tr-11-2017-0177
Gutiérrez, A., Miravet, D.: The determinants of tourist use of public transport at the destination. Sustainability 8 (9), 908 (2016). https://doi.org/10.3390/su8090908
Hahsler, M., Piekenbrock, M., Doran, D.: Dbscan: fast density based clustering with R. J. Stat. Softw. 91 (1), 1–30 (2019). https://doi.org/10.18637/jss.v091.i01
Halat, H., Zockaie, A., Mahmassani, H.S., et al.: Dynamic network equilibrium for daily activity-trip chains of heterogeneous travelers: application to large-scale networks. Transportation 43 (6), 1041–1059 (2016). https://doi.org/10.1007/s11116-016-9724-4
Hedau, A.L., Sanghai, S.S.: Development of trip generation model using activity based approach. Int. J. Civil Struct. Environ. Infrastruct. Eng. Res. Dev. 4 (3), 61–77 (2014)
Google Scholar
Hermawati, P., Adisasmita, S.A., Ramli, M.I., et al.: Choices models of trip chain and transportation mode for international tourists in tourism destination island. Int. J. Geomate (2019). https://doi.org/10.21660/2019.55.88460
Karl, M.: Risk and uncertainty in travel decision making: tourist and destination perspective. J. Travel Res. 57 (1), 129–146 (2018). https://doi.org/10.1177/0047287516678337
Khan, M., Machemehl, R.B.: Analyzing tour chaining patterns of urban commercial vehicles. Transp. Res. Part A Policy Pract. 102 , 84–97 (2017). https://doi.org/10.1016/j.tra.2016.08.014
Kieu, L.M., Bhaskar, A., Chung, E.: Passenger segmentation using smart card data. IEEE Trans. Intell. Transp. Syst. 16 (3), 1537–1548 (2015). https://doi.org/10.1109/tits.2014.2368998
Kim, H.-R., Yi, C., Jang, Y.: Relationships among overseas travel, domestic travel, and day trips for latent tourists using longitudinal data. Tour. Manage. 72 , 159–169 (2019). https://doi.org/10.1016/j.tourman.2018.11.018
Kim, S., Lee, S., Ko, E., et al.: Changes in car and bus usage amid the COVID-19 pandemic: relationship with land use and land price. J. Transp. Geogr. (2021). https://doi.org/10.1016/j.jtrangeo.2021.103168
Krizek, K.J.: Neighborhood services, trip purpose, and tour based travel. Transportation 30 (4), 387–410 (2003). https://doi.org/10.1023/a:1024768007730
Lew, A.A., McKercher, B.: Modeling tourist movements: a local destination analysis. Ann. Tour. Res. 33 (2), 403–423 (2006). https://doi.org/10.1016/j.annals.2005.12.002
Li, L., Cao, M., Yin, J., et al.: Observing the characteristics of multi activity trip chain and its influencing mechanism. KSCE J. Civ. Eng. 24 (11), 3447–3460 (2020). https://doi.org/10.1007/s12205-020-1927-8
Lue, C.C., Crompton, J.L., Fesenmaier, D.R.: Conceptualization of multi-destination pleasure trips. Ann. Tour. Res. 20 (2), 289–301 (1993). https://doi.org/10.1016/0160-7383(93)90056-9
Ma, X., Wu, Y.J., Wang, Y., et al.: Mining smart card data for transit riders’ travel patterns. Transp. Res. Part C Emerg. Technol. 36 , 1–12 (2013). https://doi.org/10.1016/j.trc.2013.07.010
Ma, X., Wang, Y., McCormack, E., et al.: Understanding freight trip chaining behavior using a spatial data mining approach with GPS data. Transp. Res. Rec. 2596 , 44–54 (2016). https://doi.org/10.3141/2596-06
Mariante, G.L., Ma, T.-Y., Van Acker, V.: Modeling discretionary activity location choice using detour factors and sampling of alternatives for mixed logit models. J. Transp. Geogr. 72 , 151–165 (2018). https://doi.org/10.1016/j.jtrangeo.2018.09.003
Miao, L., Im, J., Fu, X., et al.: Proximal and distal post-COVID travel behavior. Ann. Tour. Res. 88 , 103159 (2021). https://doi.org/10.1016/j.annals.2021.103159
Nanni, M., Pedreschi, D.: Time-focused clustering of trajectories of moving objects. J. Intell. Inform. Syst. 27 (3), 267–289 (2006). https://doi.org/10.1007/s10844-006-9953-7
Oppermann, M.: A model of travel itineraries. J. Travel Res. 33 (4), 57–61 (1995). https://doi.org/10.1177/004728759503300409
Pop, R.-A., Saplacan, Z., Dabija, D.-C., et al.: The impact of social media influencers on travel decisions: the role of trust in consumer decision journey. Curr. Issues Tour. (2021). https://doi.org/10.1080/13683500.2021.1895729
Qi, C., Zhu, Z., Guo, X., et al.: Examining interrelationships between tourist travel mode and trip chain choices using the nested logit model. Sustainability. 12 (18), 7535 (2020). https://doi.org/10.3390/su12187535
Scheiner, J., Holz-Rau, C.: Women’s complex daily lives: a gendered look at trip chaining and activity pattern entropy in Germany. Transportation 44 (1), 117–138 (2017). https://doi.org/10.1007/s11116-015-9627-9
Schneider, F., Ton, D., Zomer, L.-B., et al.: Trip chain complexity: a comparison among latent classes of daily mobility patterns. Transportation 48 (2), 953–975 (2021). https://doi.org/10.1007/s11116-020-10084-1
Shiftan, Y.: Practical approach to model trip chaining. Transp. Res. Rec. 1645 , 17–23 (1998). https://doi.org/10.3141/1645-03
Talwar, S., Srivastava, S., Sakashita, M., et al.: Personality and travel intentions during and after the COVID-19 pandemic: an artificial neural network (ANN) approach. J. Bus. Res. (2021). https://doi.org/10.1016/j.jbusres.2021.12.002
Tang, X., Wang, D., Sun, Y., et al.: Choice behavior of tourism destination and travel mode: a case study of local residents in Hangzhou, China. J. Transp. Geogr. 89 , 102895 (2020). https://doi.org/10.1016/j.jtrangeo.2020.102895
Tanjeeb, A., Hyland, M.: Exploring the role of ride hailing in trip chains. Transportation 50 , 959–1002 (2022). https://doi.org/10.1007/s11116-022-10269-w
Vu, H.Q., Li, G., Law, R., Ye, B.H.: Exploring the travel behaviors of inbound tourists to Hong Kong using geotagged photos. Tour. Manage. 46 , 222–232 (2015). https://doi.org/10.1016/j.tourman.2014.07.003
Wong, I.A., Fong, L.H.N., Law, R.: A longitudinal multilevel model of tourist outbound travel behavior and the dual cycle model. J. Travel Res. 55 (7), 957–970 (2016). https://doi.org/10.1177/0047287515601239
Wong, I.A., Law, R., Zhao, X.: Time variant pleasure travel motivations and behaviors. J. Travel Res. 57 (4), 437–452 (2018). https://doi.org/10.1177/0047287517705226
Wu, L., Zhang, J., Fujiwara, A.: Dynamic analysis of Japanese tourists’ three stage choices: tourism participation, destination choice, and travel mode choice. Transp. Res. Rec. 2322 , 91–101 (2012). https://doi.org/10.3141/2322-10
Xiang, Z., Magnini, V.P., Fesenmaier, D.R.: Information technology and consumer behavior in travel and tourism: insights from travel planning using the internet. J. Retail. Consum. Serv. 22 (1), 244–249 (2015). https://doi.org/10.1016/j.jretconser.2014.08.005
Yang, Y., Fik, T.J., Zhang, J.: Modeling sequential tourist flows: where is the next destination? Ann. Tour. Res. 43 , 297–320 (2013). https://doi.org/10.1016/j.annals.2013.07.005
Yang, L., Shen, Q., Li, Z.: Comparing travel mode and trip chain choices between holidays and weekdays. Transp. Res. Part A Policy Pract. 91 , 273–285 (2016). https://doi.org/10.1016/j.tra.2016.07.001
Download references
This research was funded by Postgraduate Research&Practice Innovation Program of Jiangsu Province, Grant Number KYCX23_0303.
Author information
Authors and affiliations.
School of Transportation, Southeast University, No.2 Dongnandaxue Road, Nanjing, 211189, China
Cong Qi & Xiucheng Guo
Bartlett School of Planning, University College London, 14 Upper Woburn Place, London, WC1H 0NN, UK
Jonas De Vos
Department of Civil and Environmental Engineering, Carnegie Mellon University, Pittsburgh, PA, 55454, USA
Department of Civil and Environmental Engineering, The George Washington University, Washington, DC, 20052, USA
Linxuan Shi
You can also search for this author in PubMed Google Scholar
Contributions
CQ: conceptualization, investigation, formal analysis, methodology, writing—original draft, resources, software. JDV: project administration, supervision, writing—review and editing. TT: validation, writing—review and editing. XG: formal analysis, funding acquisition. LS: data curation, visualization.
Corresponding author
Correspondence to Xiucheng Guo .
Ethics declarations
Conflict of interest.
Conflict of interest on behalf of all authors, the corresponding author states that there is no conflict of interest.
Additional information
Publisher's note.
Springer Nature remains neutral with regard to jurisdictional claims in published maps and institutional affiliations.
Rights and permissions
Springer Nature or its licensor (e.g. a society or other partner) holds exclusive rights to this article under a publishing agreement with the author(s) or other rightsholder(s); author self-archiving of the accepted manuscript version of this article is solely governed by the terms of such publishing agreement and applicable law.
Reprints and permissions
About this article
Qi, C., De Vos, J., Tao, T. et al. Trip chaining patterns of tourists: a real-world case study. Transportation (2023). https://doi.org/10.1007/s11116-023-10418-9
Download citation
Accepted : 15 August 2023
Published : 14 September 2023
DOI : https://doi.org/10.1007/s11116-023-10418-9
Share this article
Anyone you share the following link with will be able to read this content:
Sorry, a shareable link is not currently available for this article.
Provided by the Springer Nature SharedIt content-sharing initiative
- Travel behaviour
- OPTICS cluster
- Nested logit model
- Find a journal
- Publish with us
- Track your research
Thank you for visiting nature.com. You are using a browser version with limited support for CSS. To obtain the best experience, we recommend you use a more up to date browser (or turn off compatibility mode in Internet Explorer). In the meantime, to ensure continued support, we are displaying the site without styles and JavaScript.
- View all journals
- My Account Login
- Explore content
- About the journal
- Publish with us
- Sign up for alerts
- Open access
- Published: 10 February 2022
Analysis of spatial patterns and driving factors of provincial tourism demand in China
- Xuankai Ma 1 , 2 , 3 ,
- Zhaoping Yang 2 &
- Jianghua Zheng 1
Scientific Reports volume 12 , Article number: 2260 ( 2022 ) Cite this article
5231 Accesses
20 Citations
1 Altmetric
Metrics details
- Environmental economics
- Socioeconomic scenarios
- Sustainability
Modeling and forecasting tourism demand across destinations has become a priority in tourism research. Most tourism demand studies rely on annual statistics with small sample sizes and lack research on spatial heterogeneity and drivers of tourism demand. This study proposes a new framework for measuring inter-provincial tourism demand's spatiotemporal distribution using search engine indices based on a geographic perspective. A combination of spatial autocorrelation and Geodetector is utilized to recognize the spatiotemporal distribution patterns of tourism demand in 2011 and 2018 in 31 provinces of mainland China and detect its driving mechanisms. The results reveal that the spatial distribution of tourism demand manifests a vital stratification phenomenon with significant spatial aggregation in the southwest and northeast of China. Traffic conditions, social-economic development level, and physical conditions compose a constant and robust interaction network, which dominates the spatial distribution of tourism demand in different development stages through different interactions.
Spatial and temporal evolution and influencing factors of tourism eco-efficiency in Fujian province under the target of carbon peak

Investigating the spatial effect of operational performance in China’s regional tourism system

Structural characteristics and influencing factors of a spatial correlation network for tourism environmental efficiency in China
Introduction.
Tourism is an essential driver of world economic development. The world was affected by the COVID-19 outbreak in 2019, and according to a report by the World Tourism Organization 1 , the world's top ten consumer countries showed continued growth in tourism consumption against the backdrop of a global economic slowdown. According to the Ministry of Culture and Tourism of the People’s Republic of China ( https://www.mct.gov.cn/ ), China's 2020 annual domestic tourism numbered 2.879 billion trips, down 52.1% from a year earlier. The first quarter of 2021 saw 11.872700 billion domestic trips organized by national travel agencies, increasing 138.50% year-on-year. As the contribution of tourism to the regional economy is improving more and more significantly, the study of tourism demand has become a popular research topic 2 . Many scholars have carried out tourism demand forecasting through qualitative analysis, time series models, econometric models with artificial intelligence, and the accuracy of forecasting has gradually improved. However, tourism and tourists are closely correlated in terms of spatial mobility, and if spatial effects are ignored, a model estimation can be biased and produce misleading coefficient estimates 3 , 4 , 5 . Deng and Athanasopoulos were the first to incorporate spatiotemporal dynamics into an Australian domestic tourism demand model study 6 , and Yang and Zhang showed that spatiotemporal models have a significantly enhanced effect on the performance of tourism demand forecasting between domestic provinces in China 7 . Liu et al. noted that demographic factors, climate, key transportation modes, economic level, and other aspects of tourism demand were not investigated 8 . Therefore, it is imperative to understand the spatiotemporal patterns and driving mechanisms of tourism demand.
From the tourism supply side, the geographical and spatial clustering of tourism-related services produces spatial dependence and scale effects at the macro level, thus providing tourists with more acceptable prices and convenient services to achieve regional tourism growth. From the tourism demand side, tourists from the same region have more similar social psychology and tourism demand 9 , their tourism demand patterns are similar in terms of spatial preferences, and travel patterns show a more consistent cyclicality in time. Domestic tourism is an undisputed driver of economic development and poverty alleviation in less developed regions than international tourism 10 . Pompili et al. argued that choosing the provincial level as the geographic unit to study tourism flows yields more valuable results 11 . The results of the detection of spatial effects within a region can provide a scientific and empirical reference to local governments, tourism planners and administrative units regarding resource allocation and infrastructure development.
Several studies have explored the factors affecting tourism demand. For example, Priego et al. explored the impact of climate change on domestic tourism flows in Spain 12 . Massidda and Etzo studied the contribution of road infrastructure to tourism demand in domestic tourism in Italy 9 . Priego et al. emphasize the importance of meteorological factors on domestic travel destinations in Spain 12 . Technological innovation 13 and knowledge spillovers 14 cannot be ignored in driving tourism productivity and making tourism demand grow. Alvarez‐Diaz et al. 15 , Marrocu and Paci 16 , Massidda and Etzo 9 confirmed that the size of the population is also one of the drivers of tourism demand. Despite the large number of studies exploring the factors affecting tourism demand, most researchers have focused more on the impact of single aspects of socio-economic or natural factors on tourism demand, and there are no studies based on a geographic perspective that integrate the various dominant factors into a comprehensive mechanism of impact on tourism demand.
We found from the early literature that the number of tourists and tourism income served as the main proxies for tourism demand modeling. With the development of the Internet, some researchers 8 , 17 found that tourists' search engines for tourism information retrieval are the starting point and an essential part of tourism decision and travel. Li et al. summarized relevant 2012–2019 in their latest review 18 . We know about search engine data primarily based on empirical studies investigating the eximious contribution to tourism demand observation and forecasting. With Google Trends being widely used for tourism demand forecasting at multiple spatial scales worldwide 19 , Baidu Index performs even better in the Greater China region 20 . Song et al. demonstrated that Internet data has a significant driving effect on tourism demand research, with search engine data being the most common Internet data source used by researchers 19 . It is now well established from various literature that analytical methods have been implemented to address the single driving mechanisms of tourism demand. In their paper, Marrocu and Paci indicated that the application of spatial autoregressive models gave the spatial dependence patterns of tourism flows access to be effectively presented 16 . Yang and Fik investigated tourism growth change in 342 cities in China using spatial growth regression models 21 . Deng et al. used a spatial econometric analysis framework to analyze the impact of air pollution on inbound tourism in China 22 . In general, tourism demand is not affected by any individual factor, and the interactions among the factors affect the distribution of tourism demand. Therefore, it is crucial to detect the interrelated effects of tourism demand drivers. However, most existing studies ignore the interaction among the drivers of tourism demand. In addition, most existing models used in the literature make assumptions about the data and fail to reveal the interaction among the factors.
To fill these gaps, this study aims to address the spatial heterogeneity and drivers of tourism demand by using 678,900 Origin–Destination flows (OD flows) of tourism demand data from 31 Chinese provinces at the years 2011 and 2018, which helps gain insight into the spatial heterogeneity of tourism demand exhibited in the period of rapid economic development. Second, to our knowledge, this might be the first attempt to present a theoretical framework for a multi-factor driving mechanism of tourism demand, which incorporates social-economic development, population size, urban ecological conditions, tourism resources, physical conditions, traffic conditions, and technological innovation. Third, from the perspective of spatially stratified heterogeneity, this study taps the influence of the main driving factors and the interaction between different potential factors on the spatial heterogeneity of tourism demand. In addition, the study of tourism demand should not only focus on the influence of local economic activities and the natural environment but also the influence of inter-regional spatial correlation. Therefore, this study uses spatial autocorrelation and geographic detector models to analyze the spatial variation of tourism demand and its drivers at the provincial level.
The rest of the study is organized as follows: “ Materials and methodology ” section provides an overview of the proxies affecting tourism demand and the data and methods used in this paper. “ Results ” section analyzes the drivers and spatial characteristics of tourism demand. Finally, “ Discussion ” and “ Conclusions ” sections are the discussion and conclusion of the findings, respectively.
Materials and methodology
Study areas.
After the world economic crisis in 2008, China started its economic recovery in 2011, followed by an average annual growth of 9.48% in GDP and 14.99% in total domestic tourism consumption until 2018 (Fig. 1 b,c). This paper investigates the factors driving the changes in the spatial distribution of tourism demand at a provincial level in China in 2011 and 2018 to provide a basis for planning decision-makers in developing countries and regions. This study regarded the provinces as the primary geographical unit, and 31 administrative provinces in mainland China were selected as the study area. Due to the unavailability of data, Hong Kong, Macao, and Taiwan are not included in the study area (Fig. 1 ).

An overview map of the study area: ( a ) 31 provinces in mainland China; ( b ) economic conditions in the study area from 2011–2018; ( c ) tourism in the study area from 2011 to 2018. Data on China's economy are from the National Bureau of Statistics of China ( http://www.stats.gov.cn/ ) and the Chinese Academy of Social Sciences ( http://english.cssn.cn/ ). Standard map services are provided by the Ministry of Natural Resources of China ( http://bzdt.ch.mnr.gov.cn/ ), GS (2020)4619.
Dominant factors and proxy variables of tourism demand
From a systemic perspective, the underlying driving mechanism of tourism demand is constituted by the tourist travel intention of the source and the destination's attractiveness. It is influenced by the resistance of temporal distance, spatial distance, and social distance 23 , 24 , 25 . Natural conditions and human factors determine tourism demand (Fig. 2 ). In this study, social-economic development (Z1), population (Z2), urban ecology (Z3), tourism resources (Z4), physical conditions (Z5), traffic conditions (Z6), and technology innovation (Z7) are used as factors that directly affect tourism demand. Considering the availability of data, GDP per capita, value-added of tertiary industry, and the average wage of employees is used to characterize the level of socio-economic development. The total population and nighttime light index measure the population scale. Urban ecological condition is indicated by Urban park green area. Museums and A-class scenic spot index represent the richness of tourism resources. The physical environmental conditions consist of altitude, average daily hours of sunshine, average daily temperature, green space coverage index. Transportation conditions are reflected by the urban road area, highway mileage, and railroad mileage. The number of enterprises in the high-tech industry represents the region's scientific and technological innovation capability. The search intensity of the Baidu index was employed to quantify tourism demand.

Determinants and their geographical proxy variables concerning the spatial distribution of tourism demand.
Tourism demand of inter-province
Search engine big data are one of the data sources that can accurately quantify tourism demand. Search engines collect records of Internet users retrieving information on the Internet to form search engine indices with high timeliness. Baidu index ( https://index.baidu.com/ ) has better accuracy in the Greater China region for measuring tourism demand, and keywords query it. The keyword database consisted of the combinations of destination provinces name + "tourism". The Baidu index of each keyword could be decomposed according to the region and time, to obtain the daily search intensity of internet users in province A for tourism information in province B. We constructed an origin–destination (OD) spatiotemporal matrix in 2011 and 2018, which contains the intensity of travel information retrieved by residents of one province on the Internet for another province for each day. The correlation matrix of tourism demand among provinces visualized in Fig. 3 was obtained by summing up the daily tourism demand flows by year and accumulated in terms of destination provinces to obtain the tourism retrieval index of each province for a year. It characterized the total tourism demand of that province. Additionally, the annual Baidu Index of province-A Internet users query for tourism information about province-B is defined as a tourism demand flow for this OD.

Correlation matrix of tourism demand between provinces: Based on the daily Baidu indexes accumulated throughout the year in ( a ) 2011; ( b ) 2018. The Y-axis is the origin, and the X-axis is the abbreviation that replaces the destination, the name of each province. The color of each grid represents the total annual amount of tourism demand from the source province to the destination province. The grid color From lighter to darker represents the strength of tourism demand flow.
Indicators for influencing factors
We collected statistical panel data released in 2012 and 2019 from the China City Statistical Yearbook ( http://www.stats.gov.cn/tjsj/tjcbw/ ), including official statistics on the economic development level, population, urban ecological conditions, transportation conditions, and science and technology innovation. A-class tourism resources lists were extracted from the summary of government documents published on each local government website, and the tourism resources were numerically mapped according to A-1, AA-2, AAA-3, AAAA-4, and AAAA-5 remapping. The tourism resource addresses were geocoded into spatial point data, and kriging interpolation was implemented for spatial interpolation to generate the A-class tourism resources index raster. In addition, we used remote sensing data as a geographic proxy variable for physical conditions and population distribution. The NPP-VIIRS-like NTL Data from Harvard Dataverse ( https://library.harvard.edu/services-tools/harvard-dataverse/ ), which represents the intensity of human activity at night, the elevation data is from the Resource and Environmental Science Data Center of the Chinese Academy of Sciences ( https://www.resdc.cn/ ), the climate data is from the National Meteorological Science Data Center of China ( http://data.cma.cn/ ), and the green space coverage index is from the USGS ( https://www.usgs.gov/ ). All proxy variables were free of being counted according to provincial administrative boundaries, and the raw data were in a GeoDetector model where sampling points would capture the values of different variables.
Methodology
Exploratory spatial data analysis.
Exploratory spatial data analysis is a series of spatial data statistical analyses applied to describe and visualize the spatial and temporal distribution patterns of tourism demand. Global spatial autocorrelation 26 is adopted to determine whether the spatial distribution pattern of tourism demand is clustered, dispersed, or random 27 . The local spatial autocorrelation 28 is practiced in identifying areas where spatial clustering and outliers occur to explore their spatial effects 29 . Considering the spatial data of provinces are polygons and checked by topology, Queen contiguity is utilized to indicate the spatial weight matrix between provinces 30 .
Spatial stratification heterogeneity analysis
GeoDetector is an advanced spatial statistical analysis model used to study factors' impact on diseases at a specific geographical area early 31 . Furthermore, it gradually developed into various research fields with spatial characteristics, such as ecological security, food production, urban land use, carbon emissions. It is a hypothesis that if the independent variable directly influences the dependent variable in space, then the spatial distribution of the dependent variable should converge with the spatial distribution of the independent variable 32 . The model detects the similarity of two variables in spatial distribution patterns from the perspective of spatially stratified heterogeneity 33 .
In this paper, GeoDetector was adopted to analyze the factors affecting the spatial distribution of tourism demand in 31 provinces of China (Fig. 4 ). Factor detection, ecological detection, and interactive detection submodules were applied to quantify their spatial heterogeneity and interactions between factors on the spatial distribution of tourism demand. The Q statistic measured and explained the influence of the independent variable X on the dependent variable Y on spatial heterogeneity. The expressions are as follows.
where: \(Q\) -statistic is a measure of the explanatory power of the influence of factor X on tourism demand Y; M represents the number of strata (subdivisions); \(N\) represents the number of provincial geographical units in the study area; \({N}_{j}\) represents the number of provinces in subdivision \(j\) ; \({\sigma }^{2}\) and \({\sigma }_{j}^{2}\) indicate the variance of tourism demand in the whole study area and the variance of tourism demand in each subdivision, respectively. The greater the value of Q, the stronger the influence of factor X on tourism demand Y.

Principle of geodetector.
Stratification of geographic proxy variables has a significant impact on the accuracy of factor detection. The optimization algorithm for stratifying geographic proxy variables parameters proposed by Song et al. offered optimizing spatial discretization 34 . The optimization algorithm assumes that each variable is stratified using different unsupervised discretization methods to form different stratification schemes. If one alternative scheme obtains an enormous Q-statistic based on factor detection calculations, this stratification scheme captures the most significant driving force between that variable and the observed variables.
The study area was spaced at 50 km intervals, and 3795 sampling points were generated to sample 16 continuous-type variables. Quantile method, natural break method, geometric break method, standard deviation break method, and equivalence breakpoint method were used as statistical stratification methods with intervals of 3–6, and the Q-statistic of proxy variables and observations under different stratification schemes were probed. Finally, the scheme with the enormous Q-statistic was selected as the stratification and interval parameters for this proxy variable.
Spatial patterns of tourism demand in provinces
Spatial distribution.
Figure 5 illustrates the spatial distribution of tourism demand and flows between provinces in 2011 and 2018. In 2011, tourism demand was mainly distributed in China's first-tier cities with Beijing and Shanghai and the border provinces from southwest to northwest, with Hainan, Yunnan, Tibet, and Xinjiang being the main tourism demand destinations 35.33% of tourism demand in the study area. In 2018, tourism demand showed a trend of migration to first-tier cities, with Yunnan, Tibet, Shanghai, Chongqing, and Guizhou accounting for 36.46% of the total tourism demand.

Spatial distribution of tourism demand and tourism demand flow: ( a ) tourism demand in 2011, and ( e ) is in 2018; ( b – d ) are the inter-provincial directional tourism demand flows in 2011, which are high-intensity flow, medium intensity flow, and low-intensity flow respectively, and ( f – h ) is in 2018.
From the spatial perspective of tourism flow, there are 930 tourism flows between provinces with a minimum Euclidean distance of 115 km, a maximum of 3600 km, and a median of 1286 km. Long-distance travel 35 is a characteristic of tourism between domestic provinces. In 2011 the tourists' origins were concentrated in eastern China, and there were two clusters of high-intensity tourism flows distributed from Beijing and the ring-Beijing area to Yunnan and Hainan; this phenomenon altered significantly in 2018, with high-intensity tourism flows concentrated on one cluster of tourism flows from eastern China to Yunnan Province. Medium-intensity tourism flows presented a complex network with a stochastic pattern in 2011; in 2018, the complexity of the tourism network decreased, with steady clusters of tourism flows originating from the eastern provinces to Xinjiang and Tibet, while the northeastern region became a complete exporter of tourists. Comparing the low-intensity tourism flows in 2011 and 2018, it can be attended that the overall origin and destination were practically completely connected, i.e., there were tourism flows from both border provinces and the central region. The central provinces also energetically export tourists to the peripheral provinces, diverting the overall tourism flow network to a more luxuriant state. In summary, we can catch that the domestic tourism network in China during the period of rapid economic development showed a remarkable complex pattern, with the origins of tourists consolidated in the densely populated and economically developed areas in the east and the destinations distributed in the first-tier cities, and remote areas in the central and western regions.
From 2011 to 2018, the northeastern provinces, Beijing-Tianjin-Hebei region (Beijing, Tianjin, Hebei), Yangtze River Delta region (Shanghai, Jiangsu, Zhejiang, Anhui), and Pearl River Delta region (Guangzhou) are stable tourist sources; the average value of tourism demand in each province rose from 642,515 to 1,529,387, an increase of 2.38 times (Fig. 6 ). Yunnan and Guizhou in the southwest and Gansu in the west grew at a much higher rate than the national average; Heilongjiang, Jilin, and Liaoning in the northeast grew at a much lower rate than the average; and Hainan in the south became the only province in the country where tourism demand decreased.

Spatial distribution of the ratio of tourism demand in 2018 to 2011.
Spatial dependency
The spatial distribution pattern of tourism demand shifted from medium to high clustering in 2011 and 2018, and the positive Moran’s I revealed the existence of high-value to high-value clustering or low-value to low-value clustering of tourism demand in the study area, and the spatial pattern and spatial dependence of tourism demand with evident clustering. The z-score increased by 177.58% during this period, and the p-value decreased by 88.96%. The probability of rejecting the null hypothesis increased from 90 to 95%. Thus, the spatial clustering trend of tourism demand strengthened.
The global Moran’s I identified the overall spatial dependence of tourism demand in each province within the study area, and Local spatial autocorrelation analysis was applied to uncover the local spatial association patterns. As can be seen from Fig. 7 , significant stratification of tourism demand in 2011 and 2018 on a local spatial basis in China (absolute value of Z-score > 2.56, p-value < 0.01), consisting mainly of high-high value clusters (H–H) and low-low value clusters (L-L). In 2011, the H-H cluster was in Yunnan Province in southwestern China, the high values surrounded by low values cluster (H-L) appeared in Beijing, and the L-L cluster was in Heilongjiang Province in northeastern China. In 2018, the H-H cluster was still in Yunnan province, and the L-L clusters were distributed in Heilongjiang, Jilin, and Liaoning province, covering the whole northeastern region. From the perspective of spatial and temporal distribution, tourism demand formed a growth pole in southwestern China centered on Yunnan from 2011 to 2018, and tourism demand in Guizhou, adjacent to Yunnan, grew significantly and showed a spatial diffusion effect the region (Fig. 7 ). While in northeast China, the number of L-L clusters increased, and the provincial growth rate of tourism demand in low-value agglomeration was much lower than the national average during the study period. The existence of the H-L cluster in Beijing in 2011 and the disappearance of this cluster in 2018 indicated that Beijing had strong competitiveness in the region in the early stage, and the weakening polarization effect and the increasing diffusion effect diminished in the later stage when tourism demand was gradually distributed in a balanced manner in the Beijing-ring region. It suggested that tourism demand was more stable in China spatially in high-value clustering, and low-value clustering had increased, forming an increasingly stable high-value area in the southwest and low-value area in the northeast. Therefore, tourism demand in one province largely influences tourism demand in the adjacent provinces.

Local indicators of spatial association (LISA) for tourism demand in ( a ) 2011 and ( b ) 2018. The numerical marks on the maps represent P values, ** 5% level of significance (P < 0.05); *** 1% level of significance (P < 0.01).
Driving forces of tourism demand
Influencing factors of tourism demand.
Figure 8 showed the explanatory power of the driving factors for tourism demand in 2011 vs. 2018. In 2011, The number of enterprises in the high-tech industry (0.5622) had the highest explanatory power, implying that GDP had a remarkably noticeable impact on tourism demand. Average daily hours of sunshine (0.4934), Urban park green space area (0.4928), Urban road area (0.4763), GDP per capita (0.4473), Railroad mileage (0.4229) had the same level of high explanatory power, which meant that these three drivers had the most noticeable impact on tourism demand. The number of museums (0.3932), value-added of tertiary industry (0.3892), Average wage of employees (0.3479), Total population (0.3429), Highway mileage (0.3024) were also significant drivers of tourism demand. Average daily temperature (0.2757) and altitude (0.2028) also influenced tourism demand. Green space coverage index (0.0616), A-class scenic spot index (0.0321). The nighttime light index (0.0062) had minimal explanatory power on tourism demand.

Power of determinant Q-statistic value for each driving factor in 2011 and 2018.
In 2018, the average daily hours of sunshine (0.5848) significantly affected tourism demand, expressing the strongest association with tourism demand: urban park green space area (0.4084), Average daily temperature (0.407). GDP per capita (0.4058) had a significant explanatory power on the spatial distribution of tourism demand. Urban road area (0.3924), Railroad mileage (0.3863), Average wage of employees (0.3753), The number of museums (0.37), Total population (0.3347), Highway mileage (0.3299), The number of enterprises in the high-tech industry (0.3191) were also significant factors influencing tourism demand. Tourism demand was limitedly influenced by the value-added of tertiary industry (0.2148), Altitude (0.1443). Green space coverage index (0.0198), A-class scenic spot index (0.0062). The nighttime light index (0.0054) had minimal effects on tourism demand.
Interaction of driving factors
One hundred twenty couple of interactions were generated yearly between the 16 factors in 2011 and 2018, the bulk of which had an enhancing effect on tourism demand, with the primary interaction type being nonlinear enhancement (55.83% in 2011 and 75.83% in 2018), followed by bi-variable enhancement (43.33% in 2011 and 23.33% in 2018). The explanatory power of the interaction on tourism demand was greater than that of the single factor with the maximum explanatory power.
As shown in Fig. 9 a,c, in 2011, Average wage of employees-Average daily hours of sunshine (0.9935), Average wage of employees-Urban road area, GDP per capita-Railroad mileage, were two-factor non-linearly enhanced interactions with Q-statistic for the interactions greater than 0.99, showing a tourism demand with extreme explanatory power. Urban park green space area-Highway mileage, Average daily hours of sunshine-Highway mileage, Average daily hours of sunshine-Railroad mileage, Average wage of employees-Highway mileage, The number of museums-Average daily hours of sunshine, Average wage of employees-Urban park green space area, Urban park green space area-The number of museums were two-factor none-linearly enhanced interactions with interaction Q-statistic values greater than 0.98, a significant increase in the influence of synergy on tourism demand.

GeoDetector results: Power of determinants in interaction in ( a ) 2011 and ( b ) 2018; the difference of the impacts between two explanatory variables in ( c ) 2011 and ( d ) 2018.
In 2018 (Fig. 9 b,d), Average daily temperature-Urban road area (0.9949), Urban park green space area-Average daily temperature, Average daily temperature-Highway mileage, Total population-Average daily temperature, GDP per capita-Highway mileage, Average wage of employees-Highway mileage, GDP per capita-Total population, The number of museums-Average daily temperature, were two-factor non-linearly augmented interaction patterns with interaction Q-statistic greater than 0.99, which almost wholly control the spatial distribution of tourism demand. Value-added of tertiary industry-Average daily temperature, GDP per capita-Average daily hours of sunshine, GDP per capita-Value added of tertiary industry, GDP per capita-Urban road area, GDP per capita-The number of museums, GDP per capita-Urban park green space area, were two-factor none-linearly enhanced and GDP per capita-Average daily hours of sunshine was two-factor enhanced with interaction Q-statistic values greater than 0.98.
The regional economic development and construction were the main drivers, followed by the size of the population and the base of tourism services, and again by the traffic conditions, with the influence of natural factors and tourism resources being minimal in 2011. Moreover, by 2018, the influence of tourism comfort factors began to rise, such as average daily hours of sunshine and average daily temperature, representing a significant increase. The level of social and personal economic development and transportation conditions also increased influence to 2011. It indicated that in the aftermath of the world economic crisis and during the economic recovery, the driving force affecting tourism demand is the city's economy and level of development. However, after high economic growth, tourists have more requirements for the comfort of the experience during tourism, and the economy is no longer the main driving force directly affecting the spatial distribution of tourism demand.
Interaction mechanism
We filtered the five combinations with the maximum Q-statistic values from each of the 120 interaction combinations for 2011 and 2018, respectively, with an average explanatory power greater than 0.99 and two-factor nonlinear enhancement. It indicates that these combinations play a decisive role in the spatial distribution of tourism demand. The dominant factors to which each proxy variable belongs are also shown in Table 1 . The ten combinations generated the interaction networks with the most explanatory power. The proxy variables and the determinants are mapped as nodes; the cumulative value of the Q statistics for the interactions between the node and other nodes determines the node's size. The interactions between the factors are edges, and the Q-statistic values for interaction measured the weight of the edges. Different hierarchical interaction networks are visualized in Fig. 10 revealed the interactive mechanism.

Diagram of Interactive Network: the interactive network of proxy variables in 2011 ( a ) and 2018 ( b ); interactive network of dominants in ( c ) 2011 and ( d ) 2018; ( e ) global interactive network based on proxy variables; ( f ) global interactive network based on dominants.
From the perspective of the interaction of proxy variables, a strong triangular network community was formed in 2011 by average wages of employees—average daily hours of sunshine-highway mileage. In 2018, the interaction network shaped a significant polarization with the average daily temperature at the center, and average daily temperature and highway mileage formed a chain community. From the perspective of the interaction of dominants, Fig. 10 c,d illustrate a substantial triangular network community formed by traffic conditions dominated by socio-economic development conditions and complemented by physical conditions in 2011. This community continued to persist in 2018, with the difference that the roles of physical and traffic conditions were switched.
Notably, the most significant interaction results in 2011 and 2018 were integrated to reveal the driving mechanisms impacting the distribution of tourism demand. Physical conditions existed at the core of the interaction network, mainly in the form of average daily temperature, which interacted extensively with other factors and was the central driver influencing the distribution of tourism demand, indicating that tourism comfort is the basis of the natural scenery tourism attraction. Socio-economic development followed closely behind in physical conditions, with the average wage of employees representing the general level of economic development in the region and the prosperity of the tertiary sector, characterizing the level of tourism services, as well as being the foundation for driving the city to be a tourist attraction. The importance of traffic conditions was uncovered in tourism accessibility and the compression of the time distance. The three formed a concrete network of interactions that influenced the spatial distribution of tourism demand.
Tourism is one of the critical engines of local economic development and serves as a regulatory tool for coordinated development within and between countries and regions. Tourism is extraordinarily vital and dynamic, and according to the latest report of the World Tourism Organization, tourism worldwide has shown a rapid recovery after the impact of COVID-19. This paper suggested a theoretical framework to explore the spatial distribution of driving tourism demand based on a spatially stratified heterogeneity perspective, obtained the dominant drivers to shape the spatial distribution of tourism demand, and discussed the interaction mechanisms among the drivers.
Internet Big data have derived a tremendous amount of Internet operation records of individual Internet users, which provide us with new means of observation. Early observations of tourism demand relied on management statistics of scenic spots and cities. After 2008 Internet search engines, big data were widely used as indicators to quantify tourism demand, and they proved to have good reliability at different geographic scales to accurately reflect the amount of tourism demand. For example, Yang et al. and Xin et al. predicted tourism demand in Hainan Province 36 , China, and Beijing Forbidden City 37 , Beijing, China. The results proved that the Baidu index could more accurately reflect tourism demand's spatial and temporal characteristics. This paper uncovered the spatial distribution of tourism demand and flow network patterns reflected by the Baidu index on a national scale (Figs. 3 , 6 ). It demonstrated that the Baidu index could characterize tourism demand dynamically and build tourism flow networks.
Notably, there were regional differences in the distribution of inter-provincial tourism demand in China. The study results showed that tourism demand increased significantly from 2011 to 2018, the spatial clustering pattern of tourism demand was not randomly distributed (Fig. 5 ); there were two types of spatial effects in regional tourism growth, namely spatial spillover and spatial heterogeneity 21 . The high tourism demand cluster was shaped in the southwest, and the low tourism demand cluster was rendered in the northeast (Fig. 7 ). The spatial competitive effect of high and low imbalance in the capital ring gradually vanishes, and the tourism demand in the central region tends to be homogeneous.
By investigating the spatial distribution pattern of domestic inter-provincial tourism demand in China, we recognized heterogeneity in the sensitivity of long-distance tourism flows to the distance in different intensities (Fig. 11 ). There was an explicit reversal at 1900 km for high-intensity tourism flows, i.e., the distance between origin and destination was shorter than 1900 km, and tourism demand positively corresponded with distance; conversely, whereas the was over 1900 km, tourism demand declined with increasing distance. Medium-intensity tourism flows were not sharp with distance. Low-intensity tourism flows obeyed the distance decay law.

Results of locally weighted regressions of distance and travel demand: ( a ) 2011 ( b ) 2018. 2011 and 2018 tourism demand flow intensities were normalized separately. Locally weighted regression 38 of distance and normalized tourism demand intensity was performed according to the stratification of tourism demand flows in Fig. 5 , where the Euclidean distances of flows were calculated in the Beijing_1954_3_Degree_GK_Zone_35 coordinate system.
The dominants that have a decisive influence on tourism demand were physical conditions, socio-economic development, and traffic conditions; the proxy variables are the average daily temperature, the average wage of employees, and highway mileage.
Physical conditions had high explanatory power for the spatial distribution of tourism demand, proving that natural scenery tourism was more prevalent in China than urban humanistic tourism. Tourist attraction and comfort of the natural scenery type were determined physical conditions; for instance, world natural heritage sites have a stronger role in promoting tourism 39 . Murphy et al. analyzed daily time-scale park visitation and weather data for Pinery Provincial Park, Canada, from 2000 to 2009, demonstrating the high sensitivity of tourism demand to average daily temperatures 40 .
While socio-economic development furnishes the foundation for breeding urban humanistic tourism, the average wage of employees is an efficient indicator of the region's economic development 41 , where high-quality tourist reception, available public information, travel safety, and diversified recreational convenience services are important factors attracting tourists. Meanwhile, efficient administrative supervision services in economically developed regions directly impact public information, recreational convenience, safety protection, and recreational convenience 42 .
Traffic conditions make it possible to connect tourists to tourist attractions. Wang et al. (2020) uncovered a well-coupled relationship between tourism efficiency and traffic accessibility in Hubei Province 43 , China, from 2011 to 2017. Highway mileage enhanced the coverage of inter-regional connections and compressed tourists' time costs to their destinations; on the other hand, it also increased the polarization of intra-regional connections, thus benefiting the central regions rather than the peripheral ones from the traffic 44 . This finding was consistent with the results that Southwest China forms a high tourism demand cluster, while Northeast China is a low tourism demand cluster in “ Spatial dependency ” section and Fig. 7 . Another recent study 45 has observed that less-developed central and western regions attract more visitors than developed eastern regions by improving transportation conditions in China.
Several aspects need to be considered in related follow-up studies. First, this study analyzed the drivers of tourism demand at the provincial level in China, with prominent medium- and long-distance tourism characteristics. In contrast, complete tourism demand occurs between prefecture-level cities, which should be considered the primary research unit in the future. However, writing a crawler program to request raw data from the Baidu index to obtain the daily tourism demand O-D flow has limitations. Therefore, moderately reducing the scope of the study may be helpful. Secondly, direct dominants in this study's theoretical framework of the driving mechanism are economic development level, population size, urban ecological conditions, tourism resources, natural environment, transportation conditions, and science and technology innovation. The results showed that the geographical variables represented by the tourism resources index, night lighting index, and green space coverage index have little impact on tourism demand, it might be caused by the difference between the scale of rasters and spatial panel data, these rasters may have more efficiently representation on the scale of urban. Therefore, more representative ones should be selected in future research as proxy variables. Finally, the COVID-19 global pandemic significant public safety event on tourism demand is also very impacting. The effects of severe public contingencies and the government's immediate response policies on tourism demand should be added to the tourism demand driving mechanism in the future.
Conclusions
This study adopted Baidu index data spatialized into flow space, and multi-source data to investigate domestic tourism demand's spatial pattern and drivers during China's rapid economic development (2011–2018). The results show that (1) China's domestic tourism demand has significantly increased, shaping a spatial pattern in which first-tier cities and western regions where the core tourism destinations and the tourism attractiveness of northeastern regions gradually disappeared. The tourism demand network is increasingly prosperous and gradually develops from disorderly to orderly, with eastern regions as the main source of tourists. (2) From the single driving factor, the factor with the strongest and increasing control over the spatial distribution of tourism demand is sunshine hours > the average wage of employees > highway mileage. (3) In terms of the composite factor interaction results, the interaction network formed by physical conditions-economic development level-transportation conditions steadily and strongly determines the spatial distribution pattern of tourism demand.
The novelty of this study is the flow-based spatialization of the search engine index (Baidu index), which efficiently mapped the spatial mode of tourism demand and unearthed the network formed by domestic tourism flows, domestic long-distance travel in China is positively correlated with distance in terms of travel demand between the source and destination within 1900 km and vice versa. Additionally, the factors affecting the spatial distribution of tourism demand were interpreted from spatial heterogeneity, and the significant impact of the interaction between factors on tourism demand was resolved and captured the complex network. The findings of this paper can provide a reference for regional tourism planning decision-makers. Simultaneously, it can also provide a systematic tourism demand driving mechanism for tourism demand forecasting researchers and promote modeling accuracy.
International Tourism Highlights, 2020 Edition (World Tourism Organization (UNWTO), 2021). https://doi.org/10.18111/9789284422456 .
Song, H., Qiu, R. T. R. & Park, J. A review of research on tourism demand forecasting: Launching the Annals of Tourism Research Curated Collection on tourism demand forecasting. Ann. Tour. Res. 75 , 338–362 (2019).
Article Google Scholar
Song, H. & Li, G. Tourism demand modelling and forecasting—A review of recent research. Tour. Manag. Anal. Behav. Strateg https://doi.org/10.1016/j.tourman.2007.07.016 (2008).
Goh, C. & Law, R. The methodological progress of tourism demand forecasting: A review of related literature. J. Travel Tour. Market. 28 , 296–317 (2011).
Wu, D. C., Song, H. & Shen, S. New developments in tourism and hotel demand modeling and forecasting. Int. J. Contemp. Hosp. Manag. https://doi.org/10.1108/IJCHM-05-2015-0249 (2017).
Deng, M. & Athanasopoulos, G. Modelling Australian domestic and international inbound travel: A spatial–temporal approach. Tour. Manag. 32 , 1075–1084 (2011).
Yang, Y. & Zhang, H. Spatial-temporal forecasting of tourism demand. Ann. Tour. Res. 75 , 106–119 (2019).
Liu, P., Zhang, H., Zhang, J., Sun, Y. & Qiu, M. Spatial-temporal response patterns of tourist flow under impulse pre-trip information search: From online to arrival. Tour. Manag. 73 , 105–114 (2019).
Article CAS Google Scholar
Massidda, C. & Etzo, I. The determinants of Italian domestic tourism: A panel data analysis. Tour. Manag. 33 , 603–610 (2012).
Giambona, F. & Grassini, L. Tourism attractiveness in Italy: Regional empirical evidence using a pairwise comparisons modelling approach. Int J Tour. Res 22 , 26–41 (2020).
Pompili, T., Pisati, M. & Lorenzini, E. Determinants of international tourist choices in Italian provinces: A joint demand–supply approach with spatial effects. Pap. Reg. Sci. 98 , 2251–2273 (2019).
Priego, F. J., Rossello, J. & Santana-Gallego, M. The impact of climate change on domestic tourism: A gravity model for Spain. Reg. Environ. Change 15 , 291–300 (2015).
Cabrer-Borras, B. & Serrano-Domingo, G. Innovation and R&D spillover effects in Spanish regions: A spatial approach. Res. Policy 36 , 1357–1371 (2007).
Joppe, M. & Li, X. P. productivity measurement in tourism the need for better tools. J. Travel Res. 55 , 139–149 (2016).
Article ADS Google Scholar
Alvarez-Diaz, M., D’Hombres, B., Ghisetti, C. & Pontarollo, N. Analysing domestic tourism flows at the provincial level in Spain by using spatial gravity models. Int. J. Tour. Res. 22 , 403–415 (2020).
Marrocu, E. & Paci, R. Different tourists to different destinations. Evidence from spatial interaction models. Tour. Manag. 39 , 71–83 (2013).
Bing, P. & Fesenmaier, D. R. Online information search: Vacation planning process. Ann. Tour. Res. 33 , 809–832 (2006).
Li, X., Law, R., Xie, G. & Wang, S. Review of tourism forecasting research with internet data. Tour. Manag. 83 , 104245 (2021).
Song, H., Qiu, R. & Park, J. A review of research on tourism demand forecasting. Ann. Tour. Res. 75 , 338–362 (2019).
Wen, L., Liu, C., Song, H. & Liu, H. Forecasting tourism demand with an improved mixed data sampling model. J. Travel Res. 60 , 336–353 (2021).
Yang, Y. & Fik, T. Spatial effects in regional tourism growth. Ann. Tour. Res. 46 , 144–162 (2014).
Deng, T., Li, X. & Ma, M. Evaluating impact of air pollution on China’s inbound tourism industry: A spatial econometric approach. Asia Pac. J. Tour. Res. 22 , 1–10 (2017).
Bar-Anan, Y., Liberman, N. & Trope, Y. The association between psychological distance and construal level: Evidence from an implicit association test. J. Exp. Psychol. Gen. 135 , 609–622 (2006).
Park, R. E. Race and Culture (The Free Press, 1950).
Google Scholar
Trope, Y. & Liberman, N. Construal-level theory of psychological distance. Psychol. Rev. 117 , 440–463 (2010).
Moran, P. A. Notes on continuous stochastic phenomena. Biometrika 37 , 17–23 (1950).
Article MathSciNet CAS Google Scholar
Cliff, A. & Ord, V. J. Spatial Processes: Model and Application (1981).
Anselin, L. Local indicators of spatial association—LISA. Geogr. Anal. 27 , 93–115 (1995).
Zhang, C., Lin, L., Xu, W. & Ledwith, V. Use of local Moran’s I and GIS to identify pollution hotspots of Pb in urban soils of Galway, Ireland. Sci. Total Environ. 398 , 212–221 (2008).
Article ADS CAS Google Scholar
Drukker, D. M., Hua, P., Prucha, I. R. & Raciborski, R. Creating and managing spatial-weighting matrices with the spmat command. Stata J. 12 , 242–286 (2013).
Wang, J. F., Zhang, T. L. & Fu, B. J. A measure of spatial stratified heterogeneity. Ecol. Ind. 67 , 250–256 (2016).
Wang, J. et al. Geographical detectors-based health risk assessment and its application in the neural tube defects study of the Heshun region, China. Int. J. Geogr. Inf. Sci. 24 , 107–127 (2010).
Wang, J. & Xu, C. Geodetector: Principle and prospective. Acta Geogr. Sin. https://doi.org/10.11821/dlxb201701010 (2017).
Song, Y., Wang, J., Ge, Y. & Xu, C. An optimal parameters-based geographical detector model enhances geographic characteristics of explanatory variables for spatial heterogeneity analysis: Cases with different types of spatial data. GISci. Remote Sens. 57 , 593–610 (2020).
Bacon, B. & LaMondia, J. J. Typology of travelers based on their annual intercity travel patterns developed from 2013 longitudinal survey of overnight travel. Transp. Res. Rec. J. Transp. Res. Board 2600 , 12–19 (2016).
Yang, X., Bing, P., Evans, J. A. & Lv, B. Forecasting Chinese tourist volume with search engine data. Tour. Manag. 46 , 386–397 (2015).
Xin, L. A., Bing, P., Rl, D. & Xh, E. Forecasting tourism demand with composite search index. Tour. Manag. 59 , 57–66 (2017).
Cleveland, W. Robust locally weighted regression and smoothing scatterplots. J. Am. Stat. Assoc. 74 , 829–836 (1979).
Article MathSciNet Google Scholar
Yang, C.-H. et al. Analysis of international tourist arrivals in China: The role of World Heritage Sites. Tour. Manag. https://doi.org/10.1016/j.tourman.2009.08.008 (2010).
Article PubMed Google Scholar
Murphy, P., Pritchard, M. P. & Smith, B. The destination product and its impact on traveller perceptions. Tour. Manag. https://doi.org/10.1016/S0261-5177(99)00080-1 (2000).
Faggian, A., Modrego, F. & McCann, P. Human capital and regional development. Handbook of Regional Growth and Development Theories (2019).
Liu, C. & Wang, D. Satisfaction of foreign visitors with public service system of Chinese urban tourism in Suzhou ( in Chinese ). Urban Dev. Stud. 22 , 101–110 (2015).
Wang, Z., Liu, Q., Xu, J. & Fujiki, Y. Evolution characteristics of the spatial network structure of tourism efficiency in China: A province-level analysis. J. Destination Market. Manag. 18 , 100509 (2020).
Faber, B. Trade integration, market size, and industrialization: evidence from China’s National Trunk Highway System. Rev. Econ. Stud. 81 , 1046–1070 (2014).
Gao, Y., Su, W. & Wang, K. Does high-speed rail boost tourism growth? New evidence from China. Tour. Manag. https://doi.org/10.1016/j.tourman.2018.12.003 (2019).
Download references
Acknowledgements
The authors acknowledge the help of Dr.Yongze Song and reviewers on improving and commenting on the manuscript. This work was supported by The Second Tibetan Plateau Scientific Expedition and Research Program (STEP) [Grant No. 2019QZKK1004].
Author information
Authors and affiliations.
College of Resource and Environment Sciences, Xinjiang University, Ürümqi, 830046, China
Xuankai Ma & Jianghua Zheng
Xinjiang Institute of Ecology and Geography, Chinese Academy of Sciences, No.818, Beijing South Road, Ürümqi, 830011, Xinjiang, China
Xuankai Ma & Zhaoping Yang
University of Chinese Academy of Sciences, Beijing, 100049, China
You can also search for this author in PubMed Google Scholar
Contributions
X.M. conceived and designed the study, conducted the data analysis and visualization, and wrote the manuscript. Z.Y. provided project administration, supervision, validation. J.Z. gave guidance to improve the results in revision. All authors reviewed and commented on the manuscript.
Corresponding author
Correspondence to Zhaoping Yang .
Ethics declarations
Competing interests.
The authors declare no competing interests.
Additional information
Publisher's note.
Springer Nature remains neutral with regard to jurisdictional claims in published maps and institutional affiliations.
Rights and permissions
Open Access This article is licensed under a Creative Commons Attribution 4.0 International License, which permits use, sharing, adaptation, distribution and reproduction in any medium or format, as long as you give appropriate credit to the original author(s) and the source, provide a link to the Creative Commons licence, and indicate if changes were made. The images or other third party material in this article are included in the article's Creative Commons licence, unless indicated otherwise in a credit line to the material. If material is not included in the article's Creative Commons licence and your intended use is not permitted by statutory regulation or exceeds the permitted use, you will need to obtain permission directly from the copyright holder. To view a copy of this licence, visit http://creativecommons.org/licenses/by/4.0/ .
Reprints and permissions
About this article
Cite this article.
Ma, X., Yang, Z. & Zheng, J. Analysis of spatial patterns and driving factors of provincial tourism demand in China. Sci Rep 12 , 2260 (2022). https://doi.org/10.1038/s41598-022-04895-8
Download citation
Received : 13 November 2021
Accepted : 04 January 2022
Published : 10 February 2022
DOI : https://doi.org/10.1038/s41598-022-04895-8
Share this article
Anyone you share the following link with will be able to read this content:
Sorry, a shareable link is not currently available for this article.
Provided by the Springer Nature SharedIt content-sharing initiative
This article is cited by
Study on the geographic distribution and influencing factors of dai settlements in yunnan based on geodetector.
- Hongfei Tao
- Jingfan Zhou
Scientific Reports (2024)
Spatial–temporal analysis and spatial drivers of hepatitis-related deaths in 183 countries, 2000–2019
Scientific Reports (2023)
Analysis of spatial patterns and driving factors of domestic medical tourism demand in North East India
- Tanmoy Biswas
GeoJournal (2022)
By submitting a comment you agree to abide by our Terms and Community Guidelines . If you find something abusive or that does not comply with our terms or guidelines please flag it as inappropriate.
Quick links
- Explore articles by subject
- Guide to authors
- Editorial policies
Sign up for the Nature Briefing newsletter — what matters in science, free to your inbox daily.

Personalities shaping travel behaviors: post-COVID scenario
Journal of Tourism Futures
ISSN : 2055-5911
Article publication date: 31 August 2022
This study aims to offer insights into a sounder understanding of tourist behavior and travel patterns by systematically identifying psychological manifestations reflected in the basic human value system in the pandemic-induced environment.
Design/methodology/approach
A large random sample (49,519 respondents from 29 European countries), generated from the core module Round 9 of the European Social Survey, was used. A post-COVID-19 psychological travel behavior model was constructed by using 12 variables within two opposing value structures (openness to change versus conservatism), shaping specific personalities.
Four types of tourists were identified by using K-means cluster analysis (risk-sensitive, risk-indifferent, risk-tolerant and risk-resistant). The risk-sensibility varied across the groups and was influenced by socio-demographic characteristics, economic status and even differed geographically among nations and traveling cultures.
Research limitations/implications
First, data were collected before the pandemic and did not include information on tourism participation. Second, the model was fully driven by internal factors – motivation. Investigation of additional variables, especially those related to socialization aspects, and some external factors of influence on travel behaviors during and after the crisis, will provide more precise scientific reasoning.
Originality/value
The model was upgraded to some current constructs of salient short-term post-COVID-19 travel behavior embedded in the core principles of universal human values. By separating specific segments of tourists who appreciate personal safety and conformity, from those sharing the extensive need for self-direction and adventure, the suggested model presents a strong background for predicting flows in the post-COVID-19 era.
- Travel behavior
- Human values
- Personality types
- Risk perception
- Travel restriction and regulations
Terzić, A. , Petrevska, B. and Demirović Bajrami, D. (2022), "Personalities shaping travel behaviors: post-COVID scenario", Journal of Tourism Futures , Vol. ahead-of-print No. ahead-of-print. https://doi.org/10.1108/JTF-02-2022-0043
Emerald Publishing Limited
Copyright © 2022, Aleksandra Terzić, Biljana Petrevska and Dunja Demirović Bajrami
Published in Journal of Tourism Futures . Published by Emerald Publishing Limited. This article is published under the Creative Commons Attribution (CC BY 4.0) licence. Anyone may reproduce, distribute, translate and create derivative works of this article (for both commercial and non-commercial purposes), subject to full attribution to the original publication and authors. The full terms of this licence may be seen at http://creativecommons.org/licences/by/4.0/legalcode
Introduction
At specific points in time, various risks affect people’s lives and behaviors, causing changes in consumer habits in line with the new situation. Tourism is highly sensitive to risks (natural hazards, wars, pandemics, terrorism, politics, environmental risks, etc.) that influence sudden changes in the tourist market ( Lee et al. , 2021 ). Any severe risk that outbreaks promptly reduces the tourism flows due to the decision of tourists not to visit dangerous destinations, but also due to government restrictions that cause shifts in tourist demand and affect travelers’ choices and behaviors ( Fotiadis et al. , 2021 ). The recent global COVID-19 pandemic endangered people’s health and lives, disturbed everyday life, disrupted the economy and brought tourism to a standstill. The COVID-19 outbreak followed by lasting travel bans and strict regulations changed almost every aspect of tourism. The whole tourism system went through profound negotiations on multiple levels. Underpinned by reasonable concerns among tourists and governments on travel risks, each country defined its own regulatory measures and entrance rules. A whole two years of COVID-19 frightening and fighting, along with lasting travel bans, brought a reasonable question of what to expect in the forthcoming tourist seasons. When dealing with uncertainties, the existing differences in risk construction are potentially crucial for assessing existing risks and their implications for the travel industry ( Gossling et al. , 2020 ; Hall et al. , 2020 ). There were some indications that harsh restrictions even magnified travel intentions, particularly among those most severely affected by the pandemic ( Boto-Garcíaand Leoni, 2021 ). Aside from travel restrictions, different prohibitions and sanctions imposed as coercive measures for diplomatic and political reasons. Fluctuating mobility bans caused confusion among tourists, creating various perceptions of the ease of traveler access ( Seyfi et al. , 2020 ) and outlined radical behavioral changes.
Demand aspects are changing swiftly because of the growing uncertainties in the world. Vales and the psychological response to crises could provide insight into probable scenarios in pandemic and post-pandemic situations. In line with Li and Cai (2012) , this study investigated the effects of values on travel motivation and behavioral intentions of European tourists. It contributes to motivational and behavioral tourism research by improving comprehension of the psychological manifestations of tourist motivation and behavior by applying multiple methodologies and big data quantifications. A developed post-COVID-19 travel behavior model implied the existence of distinct tourist segments by distinguishing those who genuinely appreciate personal safety and conformity from those with intensified travel needs.
Literature review
The devastating impacts of COVID-19 on tourism demand and future travel behavior have been widely discussed ( Brouder, 2020 ; Ivanova et al. , 2021 ; Aebli et al. , 2022 ). Tourists’ risk perception and protective behavior during or after crises (wars, terrorism, health, financial collapse, natural disasters, etc.) have been discussed repeatedly, while a multitude of studies have recently been published regarding COVID-19 effects on tourism ( Chua et al. , 2021 ; Matiza, 2022 ; Podra et al. , 2021 ; Ahmad et al. , 2021 ).
Motivation, opportunity and ability are lead factors influencing travel intentions, but the perception of travel risks is focal for making travel decisions ( Hasan et al. , 2017 ). Motivation isa principal psychological aspect that directs an individual’s behavior, activity, travel intentions, choices and behaviors ( Dann, 1981 ; Demirović et al. , 2019 ; Yoon and Uysal, 2005 ). Travel motivation and decision-making include gauging perceived benefits against perceived costs or risks ( Aebli et al. , 2022 ) and reaching extremes during COVID-19 circumstances. Restrictions occurring in pandemics inhibit continued traveling and lower the subjective perception of well-being ( Hwang and Lee, 2019 ; Brodeur et al. , 2021 ). Some studies strived to identify the behavioral patterns caused by fearful reactions to crises and uncertainties ( Kock et al. , 2020 ; Miao et al. , 2021 ), while others even proposed the existence of crisis-resistant tourists who follow their travel plans despite unexpected internal and external events ( Hajibaba et al. , 2015 ).
Personality and human values
Personality is strongly related to psychological processes, defined as an enduring disposition that causes characteristic behavioral patterns, shaped by values, being closely linked to motivation ( Parks and Guay, 2009 ). Psychological theories ( Locke, 2000 ; Rokeach, 1973 ; Roccas and Sagiv, 2010 ) indicated that needs, values and goals were arranged hierarchically, as needs influenced the development of value systems, while values influenced the decision to pursue various goals (e.g. to travel). The fulfillment of long-term goals leads to the attainment of values and satisfaction of needs ( Parks and Guay, 2009 ). Values stand for the manifestation of culture as the basis on which attitudes, cognition, emotions and behaviors evolve ( Hills, 2002 ; Li and Cai, 2012 ; Schwartz, 2012 ).
Schwartz’s theory ( Schwartz, 2012 ) is the most well-known and widely used value theory, which identified and described dynamic relationships between motivationally distinct value groups (power, achievement, hedonism, stimulation, self-direction, universalism, benevolence, conformity, tradition and security). This theory classified human values into four dimensions: openness to change, self-enhancement, conservation and self-transcendence. The basic human value sets determine motivation and can be employed to predict general travel behavior, destination choices, leisure activities, preferences, trip length, etc. ( Salim Saji et al. , 2015 ; Terzić et al. , 2021 ).
Aebli et al. (2022) use Herzberg’s theory of motivation to consider tourists’ needs and observed risks as opposing sets of psychological factors shaping travel willingness during and after the COVID-19 pandemic. People’s psychological reactions are embedded in the underlying psychological constructs – human values. According to Parks and Guay (2009) , values are more general than attitudes and are ordered by importance, as a person will tend to follow the more important value when two values are in conflict.
Risk perception, protection motivation, travel intentions and behaviors
Risk perception has a severe impact on travel intentions and destination choices ( Denda et al. , 2021 ), as people tend to carry out travel decisions in a way that mitigates threats, reflecting the basic psychological defense strategy of humans ( Miao et al. , 2021 ). Even though tourism demand declines as heath risk increases ( Yang et al. , 2020 ), there is also an opportunity to develop a sort of tourism resilience ( Gossling et al. , 2020 ). Perception of risk may vary depending on different cases and subjective risk assessment, dependent on individual psychological characteristics, socio-demographic factors, cultural background, previous travel experiences and the influence of various external factors such as media ( Pennington-Grey and Schroeder, 2013 ). When a tourist is confronted with a threat (health risk), the psychological response is to take protective action by performing a coping appraisal that influences changes in attitudes and travel intention ( Seow et al. , 2022 ). Common psychological responses related to COVID-19 were reflected in increased xenophobia, tourist ethnocentrism and negative crowding perception ( Kock et al. , 2020 ; Miao et al. , 2021 ). Taking into account the effects of aggressive media reports, Miao et al. (2021) use “terror management theory” and “posttraumatic growth” as theoretical grounding for understanding the psychological processes underlining overt human behaviors during COVID-19 pandemic. Miao et al. (2021) proposed proximal and distal travel behavior to represent short-term (travel abstinence, disruptive travel behavior, rational travel and compensative travel behavior) and long-term post-COVID-19 travel behavior (distal bounded travel behavior, voluntary de-crowding, mindful tourism and travel as a quest for meaning).
Using a large random sample generated by the European Social Survey (ESS), this study seeks to test whether the human value system can provide a basis for dividing Europeans into various personalities and behavioral types, using a large random sample generated by the ESS and if such segments can be empirically linked to crisis-resilient tourist behavior.
Research methodology
We engaged the protection motivation theory and used the post-COVID-19 travel behavior construct developed by Miao et al. (2021) to construct a post-COVID-19 travel behavior model based on human value systems. To do this, we have upgraded the salient proximal post-COVID-19 travel behavior construct by using the personality traits defined by universal human values ( Schwartz and Bardi, 2001 ) as principles governing all aspects of people’s lives ( Figure 1 ).
Data extracted from the core module Round 9 of the ESS ( ESS, 2018 ) consisted of a random sample of 49,519 respondents from 29 European countries. Over two-third of the Europeans participated in tourism in 2019, which provides some certainty that the data can be considered reliable for the examination of the travel intentions of Europeans ( Terzić et al. , 2021 ). The ESS database allows result generalization, while extant socio-demographical, political, economical and geographical data provided can be continuously added and tested using different samples and timeframes. The constructed model based on psychological constructs can be used for predicting post-pandemic travel to indicate expected tourist behaviors.
The original human values construct ( Schwartz, 2012 ) was reduced from the initial 21 to 12 variables directly related to general safety and conformity, openness to change, and hedonism. Variables considered influential to tourism decision-making were divided into two categories: (1) o penness to change and (2) c onservatism . Six variables were used to assess openness to change , including self-direction and stimulation values, reflected in independent thought and action (choosing, exploring, creativity, excitement, novelty and challenge in life) and certain aspects of hedonism (tourism satisfaction). The fundamental motive of exploration was a focal evolutionary driver of modern tourism activity. Conservatism (six variables), on the other hand, reflected greater general importance of issues of security, conformity and tradition. These characteristics were reflected in certain restraint of actions and violations of social norms and expectations, placing personal security and safety on a pedestal and indicating general anxiety avoidance (demotivation). For the study, we focused on opposing value sets – c onservation (security and conformity) as a demotivation factor, and o penness to change (hedonism and stimulation) as a motivator indicating intensified tourists’ needs. The proposed model divided people who are more conservative in terms of the role of personal safety from those whose travel needs and adventure-seeking blur their risk perception and stimulate more risky behavior. The latter were used as indicators of a person’s willingness to engage in traveling and transmitted into the post-pandemic behavioral construct.
Performing a K-means cluster analysis in SPSS 24.0 software was used for data processing. The K-means clustering represents one of the most commonly used quantitative analysis techniques in tourism for market segmentation ( Dolnicar et al. , 2014 ; Fuchs and Höpken, 2022 ). The main limitations of K-means lay in the potential of cluster overlapping, the need for pre-defining the number of clusters, dimensionality and unbalance in cluster sizes ( Fränti and Sieranoja, 2018 ). In this study, clusters were defined based on previously established models ( Miao et al. , 2021 ) and empirical findings ( Aebli et al. , 2022 ; Hajibaba et al. , 2015 ). The dimensionality problem was avoided by using a large random sample and the modest number of variables provided by the ESS database, as suggested by Dolnicar et al. (2014) . Despite the slight disproportion in cluster sizes, the size of each cluster was large enough to provide confidence in the presented results and to reflect a more realistic situation in life.
Sample profile
Among the sample, there was slight domination of female respondents (51.4%) compared to males (48.6%). Young adults up to 39 years made up 36.2% of the sample, middle-aged people (aged 40 to 65) made up 42.9% and seniors (aged 66 to 90) made up 20.9% of the total sample. Secondary education was the most common (58%), followed by advanced vocational and lower tertiary (BA) education (22%) and higher tertiary education (12.1%). Employed and self-employed persons (89.1%) were dominant respondents. The primary source of the household income was salary from employment (66%), pensions (24.1%) or unemployment or other social benefits (4.5%).
Defining clusters
Human values (12 variables) on the opposite sides of the human value system were manipulated to produce clusters reflecting the psychological types of potential tourists, particularly those with outlined travel needs and those with contrasting conservative characteristics. The first cluster analysis (containing two to six clusters) indicated that three- and four-cluster solutions provided the best cluster solution. The use of four clusters to indicate behavioral patterns was chosen in accordance with Miao et al. (2021) . Conduction of the K-means non-hierarchical cluster analysis classified 48,789 respondents (with valid responses) into four clusters. ANOVA found that all included variables were statistically different ( Table 1 and Figure 2 ). Means were calculated for each variable and compared for the whole sample. The final cluster solution was achieved due to no or small change in cluster centers, with the maximum absolute coordinate change for any center 0.000, with 84 iterations and minimal distance between initial centers 12.41.
The ANOVA analysis showed that the values reflected in the statements “Important to seek adventures and having an exciting life,” “Seek fun and things that give pleasure,” “Try new and different things in life” and “Having a good time” strongly affected the segmenting process. These statements were in direct relationship with tourism motivation. Other issues related to general safety and stability are of outmost importance in the crisis-related (pandemic) circumstances and give some insight into possible behavioral aspects of different groups considering defined and proposed safety measures at destinations.
Table 2 presents some patterns of the clusters' socio-demographic characteristics. There was evident slight gender difference across clusters indicating women were more risk-sensitive than men. Sharper age differences existed, marking older respondents risk-sensitive, while younger groups were predominantly risk resistant. Travel risk perception increases with age and decreases with travel experience. The influence of gender and age on risk perceptions was consistent with the results of previous research ( Floyd and Pennington-Gray, 2004 ; Lepp and Gibson, 2003 ).
According to Bernini and Carcolici (2015) , economic stability has the greatest impact on tourism participation and consumption. Differences in tourism participation reflect inequalities in living standards, as disposable income is an important determinant influencing tourist behavior, participation and spending ( Bernini and Fang, 2021 ). Risk-sensitive and risk-resistant personalities are dependent on subjective general health evaluation and current financial status assessment. Education and economic status were important aspects, as risk-sensitive personalities were predominant among less educated and economically disadvantaged groups.
Certain aspects of the overall trust in governmental decisions revealed that the risk-indifferent group displays a slightly lower confidence in national politics than other groups. Emotional attachment levels to country and Europe might indicate possible travel boundaries in post-pandemic circumstances. The risk-sensitive and risk-tolerant groups have an extremely high emotional attachment to their country of residence, and the risk-tolerant and risk-resistant groups are highly attached to Europe. Such attitudes might indicate the expected level of ethnocentrism that will most probably affect post-COVID-19 travel behaviors. The same is reflected in some moral obligations to support the domestic tourism economy by staying within national borders ( Kock et al. , 2020 ). Figures 3 and 4 present the uneven geographical distribution of certain tourist types in Europe with a clear dominance of risk-tolerant personalities.
In 2019, 64.9% of the EU population (aged 15 or over) made at least one travel for personal purposes, but tourism participation share ranged from 85% in The Netherlands to 28.6% in Romania ( Eurostat, 2020 ). Nearly half of the Europeans (45%) who did not participate in tourism reported financial reasons as one of the main reasons for not traveling, 25% mentioned no motivation to travel and another 24% of non-tourists outlined health problems ( Eurostat, 2020 ). The standard travel patterns of European nations before the COVID-19 pandemic are presented in Figure 5 . Travel habits are likely to be transmitted into post-COVID-19 travel patterns, as previous knowledge and experiences provide certain confidence for tourists.
To provide more precise conclusions, stratification filters were used to exclude those highly unlikely to engage in travel activities due to the justified risks of poverty or health-related disability. The effects on cluster groups were minimal, as socio-demographic characteristics of defined clusters were experiencing insignificant changes (0.2%–0.5%). The spatial distribution of clusters remains stable, experiencing changes up to 1%: in risk-resistant cluster (−0.1 to −0.7%), risk-tolerant group (−0.7%–0.3%), risk-indifferent group (−0.6 to 0.4%) and risk-sensitive group (−0.1 to 1.4%). The risk-resistant and risk-tolerant groups were most stable. However, the share of the risk-sensitive group was slightly enlarged, particularly on account of the economically unstable SEE countries: Slovakia, Estonia, Croatia, Bulgaria and Serbia (up to 1.4%).
Increased perceived security in a travel context does not necessarily motivate travel because motivation is stimulated by higher-level socio-psychological needs (self-achievement), whereas safety concern is an elementary need of avoiding unpleasant situations/death ( Aebli et al. , 2022 ). Tourists exhibit a “zone of tolerance” when faced with high motivation and high risks, appearing to be willing to modify their behavior if the overall perceived risk associated with travel does not exceed an individual threshold. In dealing with a crisis (COVID-19 pandemic) some tourists may still travel and apply risk reduction strategies, while others will desist from traveling ( Aebli et al. , 2022 ). Risk-related behavior can be determined by the risk category and perceived behavioral control, indicating potential differences in crisis resistance ( Hajibaba et al. , 2015 ). Neuburger and Egger (2021) identified segments of travelers with distinctive characteristics based on their perceived risk of traveling during the pandemic and changes in travel behavior: the anxious, the nervous and the reserved. Our study identified four different risk-related tourist segments based on the psychological constructs embedded in the human values and showed that there was a clear dominance of the risk-tolerant personalities (34%), followed by the risk-indifferent (22.7%) and risk-sensitive (23.2%) groups. The smallest share was present in risk-resistant one (20.1%). Furthermore, differences in socio-demographic characteristics of defined cluster groups were present.
Conservatism is the supreme factor influencing the behavior of risk-sensitive group (Cluster 1). This group is dominated by middle/aged and senior respondents (aged 55 plus), with a slight prevalence of women. Moreover, this group is characterized by modest education (secondary), low to medium household income coming from wages or pensions and slightly lower subjective health perception compared to other groups. They indicate the insignificant effect of “openness to change” in their value system. Travel abstinence behavior is expected, reflected in a significant decline in travel members of a risk-sensitive group in proximal post-pandemic circumstances. However, younger, healthier or more financially secure members of this cluster may continue to travel domestically, or in exceptional cases, regionally. Travels will most likely be organized strictly according to social norms and defined rules, with extreme caution toward the pandemic flow and outstanding prudence in cost–benefit evaluations.
The risk-indifferent group (Cluster 2) maintains slight domination of middle-aged and older men, living as couples or families. Average education (secondary or tertiary), medium to high household incomes and good to fair subjective general health are present. This group reflects the more modes to influence of both “openness to change” and “conformity” factors. However, they demonstrate greater affinity for “making own decisions and being free” while opposing “proper behavior and following the defined rules.” Such group characteristics are in line with “invincible me” as proximal travel behavior ( Miao et al. , 2021 ), whose behavioral patterns reject the existence of “potential risk” and follow societal rules, strongly opposed to changing their travel habits. Despite being relatively less interested in travel, this type of personality is likely to avoid sustainable destinations and seek hedonic destinations that do not have bans and rigorous regulations. This personality trait alarms for potentially problematic behavior and avoidance of defined rules, especially concerning social distancing.
Risk-tolerant and risk-resistant groups are those whose travel needs have the potential to overpower the risk perception in proximate post-COVID-19 travels. The dominant risk-tolerant group (Cluster 3) displays equal distribution of age and gender. There is a domination of couples and family living, with the prevalence of secondary education, medium to high-income levels and excellent health condition. Exhibiting a high level of “openness to change” and equally important values related to personal safety and security, their behavior resembles Miao et al. (2021) “corona light” rational travel behavior. Such personalities are likely to make careful choices keeping up to the well-known domestic or regional destinations to ensure safety and confidence, excluding all potential risks (overcrowding, swift changes in prices and regulations).
The humblest presence has the risk-resistant group (Cluster 4) whose willingness to travel is dominated by the “openness to change” values. The risk-resistant group is significantly younger than other groups, made of economically independent (mostly employed) and/or financially supported youth, with better financial status, very healthy and predominantly living in a household composition of three or more. Highly educated juvenile males dominate in this cluster. This kind of personality likes to try new and different things, have a good time, make their own decisions and seek adventures, pleasure, fun and excitement. Personal safety and security are of lesser importance, indicating extremely intense travel needs that suppress risk-related factors, even in times of pandemics (in line with findings of Hajibaba et al. , 2015 ). It stands for “binge” travel behavior ( Miao et al. , 2021 ) when personalities try to compensate for a previously experienced loss. Apart from great willingness to travel, this group is directed to more sustainable travel choices, far-away destinations providing more stimulation and experiences than standardized tourist products, but mostly staying within the European continent. Despite frequent findings that crisis-resistant tourists are often single (family-free), Hajibaba et al. (2015) found that internal crisis-resistant tourists are more frequently traveling with their partner and children (30.5%) and less alone (13.3%). According to Kim et al. (2021) , the compensatory tourism consumption may be expected after the pandemic crisis, as COVID-19 will likely increase the latent travel demand. Exotic destinations with low infection numbers and mild governmental bans will become extremely popular among higher-income segments of risk-resistant and risk-indifferent groups.
The geographical distribution of cluster groups within countries show the dominance of risk-resistant groups in Iceland, The Netherlands, Switzerland and Sweden (> 30%), whose tourist stereotypes indicate very active and adventure-seeking personalities ( Terzić et al. , 2021 ). Risk-tolerant groups dominate in Slovenia (>60%), Cyprus (>50%), Belgium, Austria, Spain, Denmark, Croatia, Czechia (>40%), Finland and Germany (>30%). The latter marked as countries with stable economies, high quality of life index and sustainable tourism performance ( Băndoi et al. , 2020 ) reflect in well-established travel habits (with over 80% travel-active populations).
The results revealed the high presence of risk-sensitive groups in Poland, Italy, Serbia, Bulgaria and Croatia. These countries have a lower quality of life index and a modest share of active tourist populations ( Băndoi et al. , 2020 ), characterized by a predominance of domestic travel ( Figure 5 ). Such behavior is also in line with common traveling patterns of popular destination countries like France, Croatia, Greece, Italy, Montenegro and Spain, whose domestic tourism is traditionally higher than outbound ( Figure 5 ).
Relatively passive tourists, placed under the risk-indifferent group, can be found in the most significant numbers in Lithuania (40%), Portugal and Iceland (>30%), Bulgaria, Estonia and Norway (>25%). The determining psychological trait for this group is strong opposition to “following rules and proper behavior” and lack of travel motivation. This cluster represents personalities (stereotypes) that are considered rather passive and domestically oriented, such as people in Bulgaria and Portugal, but are also present in countries with predominantly active tourist populations, such as Norway, Iceland and Estonia. Such personalities indicate a lack of need for exploration and unwillingness to exit a personal comfort zone. Strong opposition to confine to defined behavioral rules and avoidance of restrictive measures in times of pandemic will inevitably lead to the favorization of domestic travels within this group.
Conclusions
Travel bans were lifted to a large extent by March 2022, announcing pandemic relief. Nevertheless, a new crisis in the form of the Russian–Ukrainian war ensued, bringing concerns about the possible escalation of the conflict in Europe. The latter have swiftly shifted media attention and public worries from COVID-19 to another topic. Yet, the tourism recovery process has already started, still strongly dependent on people’s travel motivations and overall risk perceptions. The new circumstances brought a reasonable question of what to expect in the forthcoming period. Mindful observations indicated that two crucial factors are likely to determine the future of tourism: politics and personalities. Politics and regulatory policies immensely impact travel intentions and decisions, in line with the slow international tourism recovery process. General risk perception in times of pandemic went beyond health-related issues, spilling over economic and regional political tensions, while controversial travel bans and sanctions affected not only targeted countries but perceptions of travel risks in general. The enforcement of quarantine on international travelers has immense implications for the relative attractiveness of countries to tourists after lockdowns have been eased. The safe resumption of outbound tourism will continue to highly depend on a coordinated response among countries considering travel restrictions, harmonized security and hygiene protocols, as well as effective communication to help restore consumer confidence and trust.
Risk perceptions and behavioral responses differ significantly between individuals, groups and even nations. In general, European tourists proved to be crisis-tolerant as their travel intentions remained strong despite pandemic concerns and all existing obstacles to travel. As people’s travel needs were suppressed and significantly magnified due to the previous long-term restrictions, psychological constructs will likely prevail on the demand side. Along with various socio-economic aspects, evaluation of personal health status, reliability of governmental decisions and available health services in destination countries will be very important for the decision-making process. Tourists will undoubtedly seek the most flexible destination countries, providing some confidence in risk mitigation and the lowest impact on satisfaction aspects.
Theoretical and practical implications
This study has important implications for theory and practice, extending the body of knowledge on consumer behavior by investigating the effects of perceived risks on travel motivation and behavioral intention in the context of European tourists projected to post-pandemic circumstances. In a theoretical context, the use of psychological constructs for explaining travel motivation and behavior supports predicting tourist flows and related economic effects in the tourism recovery process. Risk perception and travel needs act in opposing directions when it comes to travel motivation and related behaviors. Furthermore, the proposed model provides evidence that values can affect travel motivation and behaviors to a great extent. Also, other internal and external factors influence travel motivation as well. The findings of this study indicated that despite the fact that perceived risks of COVID-19 negatively affected travel motivation, it has increased significantly travel needs and changed travel preferences in the post-pandemic period. Tourism experiences act as sort of stress relievers, as leisure travels provide opportunities for relaxation, physical and mental recovery (“escapism” and “discovery”). Two years of constant COVID-19-related stress, produced by various reasons, increased people’s need for recovery, a need for movement, a need for travel. However, those needs are not of same importance and strength for all. The given construct provides some indication that various nations differ significantly in these aspects, which influence their travel behavior. Thus, outlining the existence of specific tourist stereotypes is based on their demographic and cultural background. Due to predicted changes in tourist behavior, the tourism industry could benefit from observing psychological characteristics and demands of specific market segments (clusters), and in line with this, re-evaluate tourist product development. The proposed model illustrates the importance of combining different methodologies and data sources to produce tourism forecasts. Empirical studies providing reliable quantifications and predictions in tourism were lacking, and the comparability and replicability of such models were often questionable. In this line, the ESS database provided valuable source of information with a potential to indicate travel motivation (psychological constructs), socio-demographic, economic and health-related indicators for various European countries. Those were utilized in the construct and transformed to a tourism-prediction model. The developed model is applicable to various types of risks that might have direct effects on tourism flows. Contrary to the pandemic that had global and rather uniform characteristics, the effects of other types of risks are more localized, reflected in most negative effects on the tourism sector within affected and nearby countries.
As the research indicates potential demand markets across Europe, practical implications lay in given insights into basic behavioral information for developing post-pandemic tourism recovery strategies. Although coordinating tourism recovery strategies across Europe may seem politically difficult, insight into psychological constructs (motivational aspects), tourism trends and related behavioral patterns of Europeans may provide solutions to dealing with potential risks. Various measures defined by tourism policy regulators on the national level to control the pandemics strongly affect tourist decision-making, obstructing travel intentions more severely than health concerns. Providing some expectations on behavioral aspects among tourists, appropriate and timely responses in the risk management process can be provided. The effects of the COVID-19 pandemic produced increased demand for personal safety and security grants during the travel planning process. Despite expectations of fast tourism recovery, the effects of pandemic on tourism industry, caused by deep psychological distress, will last for long time and will be less predictable. Destination policymakers are especially interested in ensuring destination safety, which can be accomplished by communicating destination trust to reduce fear and uncertainty among tourists. Addressing the most vulnerable groups and encouraging their travel participation by increasing destination trust, while identifying and managing potentially risky/unwanted behaviors, is regarded as beneficial in shaping future travel intentions.
Limitations and recommendations for future research
The research has several limitations. First, ESS data were collected before the pandemic and do not include information on tourism participation nor risk perception measured during the pandemic. Therefore, it provides limited tourism-related predictions, while geographical distribution of clusters (potential tourism markets) must be taken into consideration with caution and with support of other more recent of future empirical findings. Second, the model is fully driven by internal factors – motivation. Investigation of additional variables, especially those related to social and economic aspects, and some external factors of influence on travel behaviors, can provide more precise scientific reasoning. Effects of political stability and confidence are also of great importance in this particular timeframe and current crises. The proposed basic model can be upgraded to create more complex theoretical construct with higher predictability potential and continuously replicated and tested. The next ESS Round 10 (2020/2021) will include COVID-19-related questions that open new research possibilities for testing the presented results. Exploring similarities and differences between European nations in terms of travel needs and cultures, as well as the formation of tourist stereotypes, are of future research interest. Comparing results to similar research in different cultural and geographical settings is also a challenge.
A post-COVID-19 travel behavior model
Visualization of the impact of risk on travel behavior of specific personalities (cluster groups)
Geographical distribution of risk-related personalities within Europe
Spatial distribution of dominant types on regional (NUTS 3) level
Common travel patterns of European nations
Clusters reflecting psychological types (personalities) of the potential tourists
Aebli , A. , Volgger , M. and Taplin , R. ( 2022 ), “ A two-dimensional approach to travel motivation in the context of the COVID-19 pandemic ”, Current Issues in Tourism , Vol. 25 No. 1 , pp. 60 - 75 .
Ahmad , A. , Jamaludin , A. , Zuraimi , N.S.M. and Valeri , M. ( 2021 ), “ Visit intention and destination image in post-Covid-19 crisis recovery ”, Current Issues in Tourism , Vol. 24 No. 17 , pp. 2392 - 2397 .
Băndoi , A. , Jianu , E. , Enescu , M. , Axinte , G. , Tudor , S. and Firoiu , D. ( 2020 ), “ The relationship between development of tourism, quality of life and sustainable performance in EU countries ”, Sustainability , Vol. 12 No. 4 , p. 1628 .
Bernini , C. and Cracolici , M.F. ( 2015 ), “ Demographic change, tourism expenditure and life cycle behavior ”, Tourism Management , Vol. 47 , pp. 191 - 205 .
Bernini , C. and Fang , R. ( 2021 ), “ Living standard and Chinese tourism participation ”, International Journal of Tourism Research , Vol. 23 No. 3 , pp. 287 - 300 .
Boto-García , D. and Leoni , V. ( 2021 ), “ Distance traveled in times of pandemic: an endogenous switching regression approach ”, Tourism Economics , OnlineFirst .
Brodeur , A. , Clark , A.E. , Fleche , S. and Powdthavee , N. ( 2021 ), “ COVID-19, lockdowns and well-being: evidence from google trends ”, Journal of Public Economics , Vol. 193 , 104346 .
Brouder , P. ( 2020 ), “ Reset redux: possible evolutionary pathways towards the transformation of tourism in a COVID-19 world ”, Tourism Geographies , Vol. 22 No. 3 , pp. 484 - 490 .
Chua , B.L. , Al-Ansi , A. , Lee , M.J. and Han , H. ( 2021 ), “ Impact of health risk perception on avoidance of international travel in the wake of a pandemic ”, Current Issues in Tourism , Vol. 24 No. 7 , pp. 985 - 1002 .
Dann , G.M. ( 1981 ), “ Tourist motivation an appraisal ”, Annals of Tourism Research , Vol. 8 No. 2 , pp. 187 - 219 .
Demirović , D. , Berjan , S. , Milentijević , N. , El Bilali , H. and Syromiatnikova , Y.A. ( 2019 ), “ Exploration of tourist motivation and preferred activities in rural areas ”, Journal of the Geographical Institute ‘Jovan Cvijić’ SASA , Vol. 69 No. 1 , pp. 29 - 37 .
Denda , S. , Micić , J. and Terzić , A. ( 2021 ), “ The impact of contemporary politically induced security crisis on tourist behaviour: the perception of the Serbian younger adult population ”, Revista Española de Investigaciones Sociológicas , Vol. 174 , pp. 69 - 88 .
Dolnicar , S. , Grün , B. , Leisch , F. and Schmidt , K. ( 2014 ), “ Required sample sizes for data-driven market segmentation analyses in tourism ”, Journal of Travel Research , Vol. 53 No. 3 , pp. 296 - 306 .
EES - European Social Survey Round 9 Data ( 2018 ), Data File Edition 3.1 , NSD - Norwegian Centre for Research Data– Data Archive and distributor of ESS data for ESS ERIC , Norway , available at: https://ess-search.nsd.no/en/study/bdc7c350-1029-4cb3-9d5e-53f668b8fa74 ( accessed 8 March 2021 ).
Eurostat ( 2020 ), Participation in Tourism for Personal Purposes, 2019 , [Data file] , European Commission , available at: https://ec.europa.eu/eurostat/databrowser/view/tour_dem_totot/default/table?lang=en ( accessed 15 June 2021 ).
Floyd , M.F. and Pennington-Gray , L. ( 2004 ), “ Profiling risk perceptions of tourists ”, Annals of Tourism Research , Vol. 31 No. 4 , pp. 1051 - 1054 .
Fotiadis , A. , Polyzos , S. and Huan , T.C.T. ( 2021 ), “ The good, the bad and the ugly on COVID-19 tourism recovery ”, Annals of Tourism Research , Vol. 87 , 103117 .
Fränti , P. and Sieranoja , S. ( 2018 ), “ K-means properties on six clustering benchmark datasets ”, Applied Intelligence , Vol. 48 No. 12 , pp. 4743 - 4759 .
Fuchs , M. and Höpken , W. ( 2022 ), “ Clustering ”, in Egger , R. (Ed.), Applied Data Science in Tourism , Springer , Cham , pp. 129 - 149 .
Gossling , S. , Scott , D. and Hall , C.M. ( 2020 ), “ Pandemics, tourism and global change: a rapid assessment of COVID-19 ”, Journal of Sustainable Tourism , Vol. 29 No. 1 , pp. 1 - 20 .
Hajibaba , H. , Gretzel , U. , Leisch , F. and Dolnicar , S. ( 2015 ), “ Crisis-resistant tourists ”, Annals of Tourism Research , Vol. 53 , pp. 46 - 60 .
Hall , M.C. , Scott , D. and Gössling , S. ( 2020 ), “ Pandemics, transformations and tourism: be careful what you wish for ”, Tourism Geographies , Vol. 22 No. 3 , pp. 577 - 522 .
Hasan , M.K. , Ismail , A.R. and Islam , M.F. ( 2017 ), “ Tourist risk perceptions and revisit intention: a critical review of literature ”, Cogent Business and Management , Vol. 4 No. 1 , 1412874 .
Hills , M.D. ( 2002 ), “ Kluckhohn and Strodtbeck's values orientation theory ”, Online Readings in Psychology and Culture , Vol. 4 No. 4 .
Hwang , J. and Lee , J. ( 2019 ), “ A strategy for enhancing senior tourists’ well-being perception: focusing on the experience economy ”, Journal of Travel and Tourism Marketing , Vol. 36 No. 3 , pp. 314 - 329 .
Ivanova , M. , Krasimirov Ivanov , I. and Ivanov , S. ( 2021 ), “ Travel behaviour after the pandemic: the case of Bulgaria ”, Anatolia , Vol. 32 No. 1 , pp. 1 - 11 .
Kim , E.E.K. , Seo , K. and Choi , Y. ( 2021 ), “ Compensatory travel post Covid-19: cognitive and emotional effects of risk perception ”, Journal of Travel Research , OnlineFirst .
Kock , F. , Norfelt , A. , Josiassen , A. , Assaf , A.G. and Tsionas , M.G. ( 2020 ), “ Understanding the COVID-19 tourist psyche: the evolutionary tourism paradigm ”, Annals of Tourism Research , Vol. 85 , 103053 .
Lee , C. , Olasehinde-Williams , G. and Akadiri , S.S. ( 2021 ), “ Geopolitical risk and tourism: evidence from dynamic heterogeneous panel models ”, International Journal of Tourism Research , Vol. 23 No. 1 , pp. 26 - 38 .
Lepp , A. and Gibson , H. ( 2003 ), “ Tourist roles, perceived risk and international tourism ”, Annals of Tourism Research , Vol. 30 No. 3 , pp. 606 - 624 .
Li , M. and Cai , L.A. ( 2012 ), “ The effects of personal values on travel motivation and behavioral intention ”, Journal of Travel Research , Vol. 51 No. 4 , pp. 473 - 487 .
Locke , E. ( 2000 ), “ Motivation, cognition, and action: an analysis of studies of task goals and knowledge ”, Applied Psychology , Vol. 49 No. 3 , pp. 408 - 429 .
Matiza , T. ( 2022 ), “ Post-COVID-19 crisis travel behaviour: towards mitigating the effects of perceived risk ”, Journal of Tourism Futures , Vol. 8 No. 1 , pp. 99 - 108 .
Miao , L. , Im , J. , Fu , X. , Kim , H. and Zhang , Y.E. ( 2021 ), “ Proximal and distal post-COVID travel behavior ”, Annals of Tourism Research , Vol. 88 , 103159 .
Neuburger , L. and Egger , R. ( 2021 ), “ Travel risk perception and travel behaviour during the COVID-19 pandemic 2020: a case study of the DACH region ”, Current Issues in Tourism , Vol. 24 No. 7 , pp. 1003 - 1016 .
Parks , L. and Guay , R.P. ( 2009 ), “ Personality, values, and motivation ”, Personality and Individual Differences , Vol. 47 No. 7 , pp. 675 - 684 .
Pennington-Gray , L. and Schroeder , A. ( 2013 ), “ International tourist’s perceptions of safety and security: the role of social media ”, Matkailututkimus - The Finnish Journal of Tourism Research , Vol. 9 No. 1 , pp. 7 - 23 .
Podra , O. , Petryshyn , N. , Bayik , O. , Bobko , U. and Levkiv , H. ( 2021 ), “ The impact of Covid-19 pandemic on the volume of labor migration, employment, and remittances ”, Journal of the Geographical Institute ‘Jovan Cvijić’ SASA , Vol. 71 No. 2 , pp. 195 - 202 .
Roccas , S. and Sagiv , L. ( 2010 ), “ Personal values and behavior: taking the cultural context into account ”, Social and Personality Psychology Compass , Vol. 4 No. 1 , pp. 30 - 41 .
Rokeach , M. ( 1973 ), The Nature of Human Values , Free Press , Detroit .
Salim Saji , B. , Vij , M. and Kabiraj , S. ( 2015 ), “ Selection of tourism destination as a representation of human values ”, Business Perspectives and Research , Vol. 3 No. 2 , pp. 95 - 108 .
Schwartz , S.H. ( 2012 ), “ Toward refining the theory of basic human values ”, in Salzborn , S. , Davidov , E. and Reinecke , J. (Eds), Methods, Theories, and Empirical Applications in the Social Sciences , Springer , New Nork, NY , pp. 39 - 46 .
Schwartz , S.H. and Bardi , A. ( 2001 ), “ Value hierarchies across cultures: taking a similarities perspective ”, Journal of Cross-Cultural Psychology , Vol. 32 No. 3 , pp. 268 - 290 .
Seow , A.N. , Choong , C.K. , Chen , I.C. and Choong , Y.O. ( 2022 ), “ Can protection motivation theory explain the perception of international tourists' on medical tourism? ”, Journal of Hospitality and Tourism Insights , Vol. 5 No. 2 , pp. 394 - 412 .
Seyfi , S. , Hall , C.M. and Shabani , B. ( 2020 ), “ COVID-19 and international travel restrictions: the geopolitics of health and tourism ”, Tourism Geographies , doi: 10.1080/14616688.2020.1833972 .
Terzić , A. , Demirović , D. , Petrevska , B. and Limbert , W. ( 2021 ), “ Active sport tourism in Europe: applying market segmentation model based on human values ”, Journal of Hospitality and Tourism Research , Vol. 45 No. 7 , pp. 1214 - 1236 .
Yang , Y. , Zhang , H. and Chen , X. ( 2020 ), “ Coronavirus pandemic and tourism: dynamic stochastic general equilibrium modeling of infectious disease outbreak ”, Annals of Tourism Research , Vol. 83 , 102913 .
Yoon , Y. and Uysal , M. ( 2005 ), “ An examination of the effects of motivation and satisfaction on destination loyalty: a structural model ”, Tourism Management , Vol. 26 No. 1 , pp. 45 - 56 .
Further reading
UNWTO ( 2021 ), “ Global tourism sees upturn in Q3 but recovery remains fragile ”, available at: https://www.unwto.org/taxonomy/term/347 ( accessed 15 December 2021 ).
Corresponding author
Related articles, we’re listening — tell us what you think, something didn’t work….
Report bugs here
All feedback is valuable
Please share your general feedback
Join us on our journey
Platform update page.
Visit emeraldpublishing.com/platformupdate to discover the latest news and updates
Questions & More Information
Answers to the most commonly asked questions here
- Credit cards
- View all credit cards
- Banking guide
- Loans guide
- Insurance guide
- Personal finance
- View all personal finance
- Small business
- Small business guide
- View all taxes
You’re our first priority. Every time.
We believe everyone should be able to make financial decisions with confidence. And while our site doesn’t feature every company or financial product available on the market, we’re proud that the guidance we offer, the information we provide and the tools we create are objective, independent, straightforward — and free.
So how do we make money? Our partners compensate us. This may influence which products we review and write about (and where those products appear on the site), but it in no way affects our recommendations or advice, which are grounded in thousands of hours of research. Our partners cannot pay us to guarantee favorable reviews of their products or services. Here is a list of our partners .
Where Americans Are Traveling in 2024: By the Numbers

Many or all of the products featured here are from our partners who compensate us. This influences which products we write about and where and how the product appears on a page. However, this does not influence our evaluations. Our opinions are our own. Here is a list of our partners and here's how we make money .
Americans are traveling abroad in droves.
The number of U.S. citizens flying to international destinations reached nearly 6.5 million passengers in March, according to the International Trade Administration. That’s the highest March total in over five years and shows that the post-pandemic “revenge travel” trend is the new normal.
It wasn’t just March, which usually sees a spike in international departures for spring break. In every month of 2024 so far, more Americans left the country than last year and 2019. These trends point to a blockbuster summer for overseas travel.
Nearly half of Americans (45%) plan to travel by air and/or stay in a hotel this summer and expect to spend $3,594 on average, on these expenses, according to a survey of 2,000 U.S. adults, conducted online by The Harris Poll and commissioned by NerdWallet.
That's despite rising travel prices that have caused some hesitancy among would-be travelers. About 22% of those choosing not to travel this summer cite inflation making travel too expensive as a reason for staying home, according to the poll.
So where are traveling Americans going? And what does it mean for those looking to avoid crowds of tourists and higher travel prices?
New travel patterns
Nearly every region in the world saw an increase in U.S. visitors in March 2024 compared with March 2023, according to International Trade Administration data. Only the Middle East saw a decline of 9%. Yet not every region saw the same year-over-year bump. U.S. visitors to Asia saw a 33% jump, while Oceania and Central America each saw a 30% increase.
Comparing 2024 with 2023 only tells part of the story, however. The new patterns really emerge when comparing international travel trends to 2019. For example, Central America received 50% more U.S. visitors in March 2024 compared with March 2019. Nearly 1.5 million Americans visited Mexico, up 39% compared with before the pandemic. That’s almost as many visitors as the entire continent of Europe, which has seen a more modest 10% increase since 2019.
Only Canada and Oceania saw fewer visitors in March 2024 than in 2019, suggesting that interest in these locations has not rebounded. Indeed, the trends indicate a kind of tourism inertia from COVID-19 pandemic-era lockdowns: Those destinations that were more open to U.S. visitors during the pandemic, such as Mexico, have remained popular, while those that were closed, such as Australia, have fallen off travelers’ radars.
Price pressures
How these trends play out throughout the rest of the year will depend on a host of factors. Yet, none will likely prove more important than affordability. After months of steadiness, the cost of travel, including airfare, hotels and rental cars, has begun to sneak up again.
About 45% of U.S. travelers say cost is their main consideration when planning their summer vacation, according to a survey of 2,000 Americans by the travel booking platform Skyscanner.
That’s likely to weigh further on U.S. travelers’ appetite for visiting expensive destinations such as Europe, while encouraging travel to budget-friendly countries. It could also depress overall international travel as well, yet so far, Americans seem to be traveling more.
For those looking to avoid crowds while maintaining a budget, Skyscanner travel trends expert Laura Lindsay offered a recommendation many of us might need help finding on a map.
“Albania has been on the radar of travelers looking for something different,” Lindsay said. "Most people have yet to discover it, but flights and tourism infrastructure are in place, and there are fewer crowds in comparison to trending European destinations like Italy, Greece, or Portugal.”
On the flip side, American travelers looking to avoid crowds of compatriots would do well to avoid Japan, which has seen a staggering 50% increase in U.S. tourists between March 2019 and 2024.
How to maximize your rewards
You want a travel credit card that prioritizes what’s important to you. Here are our picks for the best travel credit cards of 2024 , including those best for:
Flexibility, point transfers and a large bonus: Chase Sapphire Preferred® Card
No annual fee: Bank of America® Travel Rewards credit card
Flat-rate travel rewards: Capital One Venture Rewards Credit Card
Bonus travel rewards and high-end perks: Chase Sapphire Reserve®
Luxury perks: The Platinum Card® from American Express
Business travelers: Ink Business Preferred® Credit Card
On a similar note...


An official website of the United States government
The .gov means it’s official. Federal government websites often end in .gov or .mil. Before sharing sensitive information, make sure you’re on a federal government site.
The site is secure. The https:// ensures that you are connecting to the official website and that any information you provide is encrypted and transmitted securely.
- Publications
- Account settings
Preview improvements coming to the PMC website in October 2024. Learn More or Try it out now .
- Advanced Search
- Journal List
- Springer Nature - PMC COVID-19 Collection
Toward a ‘New Normal’? Tourist Preferences Impact on Hospitality Industry Competitiveness
Maria teresa cuomo.
1 Department of Economics and Statistics, University of Salerno, via Giovanni Paolo II, 132, 84084 Fisciano, SA Italy
Debora Tortora
2 Department of Business and Law, University of Milan ‘Bicocca’, Milano, Italy
Alessandro Danovi
3 Department of Business, University of Bergamo, Bergamo, Italy
Giuseppe Festa
Gerardino metallo.
The recent outbreak of novel coronavirus (Covid-19) has led to a global panic due to its fatal nature which has harshly impacted the tourist sector and on the place reputation in general. This study aims to compare the factors that develop tourist preferences in terms of (i) what drives the favorability of tourist preferences? (ii) what relationship exists between tourist expectations, proximity, and favorable reputation? and (iii) what are the main influences of tourist preferences on hospitality system competitiveness pre and post Covid-19? By employing structural equation modeling, this study advances knowledge into the research variables’ relationships and advances reputation and marketing performance and practices in the hospitality industry.
Introduction
The magnitude and severity of the Covid-19 pandemic have dealt a heavy blow to the world travel and tourism sector, with profound economic and social repercussions (Mathieson and Wall 1982 ; Sigala 2020 ) on the entire supply chain and on the hospitality system, in particular. Just to have a benchmark, the Covid-19 outbreak impact on the American travel industry in 2020 was about nine times of that from 9/11. Hotel room revenue was cut in half, from $167 billion to $85 billion. Hotels were running at about 44% occupancy in 2020, down from 66% in 2019 (Kwok 2021 ). Furthermore, the impact of Covid-19 on business travel has varied (from April to December 2020) by region with huge contractions: in North America it declined by 79%; Western Europe 77%; Latin America 59%; Eastern Europe 63%; and Asia Pacific and Middle East and Africa 52% (Stimson 2021 ). Thus, very deep wounds will probably mark a change of direction in the way the tourism offer is provided (Hall et al. 2020 ; Gössling et al. 2020 ). With an overall rethinking, the tourist industry will have to show an unprecedented capacity to serve the changing needs of the tourist, so as to preserve the sector reputation, while at the same time trying to bring out alternative tourist needs (Nientied and Shutina 2020 ; Wachyuni and Kusumaningrum 2020 ). Ability to reorganize and reactivate the offer, together with an effective interpretation of the demand (Sigala 2020 ), will be the new keywords to remain competitive. Will the hospitality industry be able to capitalize in the moment?
Accordingly, the aim of the study is to provide insights that will help hospitality system to understand and interpret new tourist preferences that can build new normality, based on alternative formulas to capture tourists in line with emerging market sensitivities. Considering these arguments and this new context, the current research aims to provide responses to the following queries: (i) Which factors develop tourist preferences? (ii) What drives the favorability of tourist preferences? (iii) Is there a relationship between tourist expectations, proximity, and favorable reputation? and (iv) What are the main influences of tourist preferences on hospitality system competitiveness?
To answer to the abovementioned questions, a conceptual model based on these relationships is developed. To address these relationships, we will use the theory of needs and the theory of demand with variable consumer preferences. Then, the research seeks to examine preferences of tourist about factors that potentially explain expectations, proximity, and reputation and to study whether and how the tourist preferences may influence the hospitality system competitiveness in pre-Covid-19 and during and post-Covid-19 pandemic, using empirical testing of data collected on a sample of 441 tourists in Italy.
The tourism sector represents a perfect scenario for the analysis, due to a sad record: it was the first sector to face the catastrophic and devastating effects of the viral emergency, with evident and current difficulties both in terms of the sector's capacity to maintain and traces of recovery on the outlet markets (Fiavet 2020 ). It should also be remembered that most of the tourism activities are related to hospitality and, therefore, require contact often—direct and physical—with potential users. That makes difficult to respect the necessary and inevitable ‘social distancing’ practices in the management of the relationship with the virus (Wen et al. 2020 ) and often brings international visitors to the decision to abandon the trip (for 1 out of 4 tourists, UNWTO 2020 ). This prerogative of tourism production systems, in this historical phase, is supposed to be a high critical factor, imposing a radical revision of the internal organization and business models for the benefit of workers and tourists (Sigala 2020 ).
It is always difficult to venture predictions and less than ever in such a picture of uncertainty. Indeed, the countless numbers of forecasts announced in last months by the experts and the press shared a common view: a paralysis of the sector. The most credited Italian estimates, in fact, foresee overall decreases in turnover of almost 30 billion, with an equally significant decrease for the incoming tourism, reduced by 260 million admissions (− 43,4% in 2020 compared to 2019, Cst 2020 ), with a drop in the connected tourist expenditure of around 4.5 billion (Demoskopika 2020 ). Depending on the duration of the outbreak, then, the companies in the travel and tourism chain could even double their loss.
In this light, the paper is structured as follows: it starts with an explanation of the conceptual model and presenting a series of hypotheses. Next, the paper sets out the research method. A large-scale field survey investigation is undertaken to examine the results of the research hypotheses. Finally, discussion, implications, and conclusions are presented.
Theoretical Background and Conceptual Framework
Far beyond analyzing the appropriateness of the interventions—public and private—put in place so far for the support of the tourism sector (which perhaps deserves further study), it is worthwhile to focus the discussion on the responsiveness of the players of the segment to the changes that have occurred (Cillo et al. 2021 ). It is not yet clear if and when it will be possible to restore the status quo ante . However, the tourist offer should adopt a step-by-step approach. Therefore, after the initial moment of the health emergency, to be addressed by trying to resist and limit damages, in the current period of coexistence with the virus, it will be necessary to first manage the emerging needs required by the tourist (i.e., a need for security, Nientied and Shutina 2020 ). Appropriate reassurance actions will make it possible to recover the trust relationship with the target audience, sometimes limited by crisis information systems and communication (Yu et al. 2020 ). Only after having stimulating and reorganizing the production of tourist services, it will be possible to proceed with initiatives to stimulate the demand in terms of expectations, preferences, proximity, reputation, and impacts on hospitality system competitiveness (Sukumar et al. 2020 ). Moving toward the return to normality, it will be necessary to strengthen the tourist offer with renewed sense contents, obviating the age-old problem of overcrowding from mass tourism.
The conceptual model applied in this study is based on two theories. The first one is the theory of needs (Maslow’s hierarchy of needs), while the second is the theory of demand with variable consumer preferences (Basmann 1956 ). The well-known Maslow theory of needs is considered to define the quality of service as a definition of customers’ needs. This is particularly true in the tourism sector, whereas tourist expectations may be very consistent in the definition of the attributes of the supply (Bi et al. 2020 ) and in the following definition of preferences.
The theory of demand with variable consumer preferences is based on the fact that individual consumers have no unique ordinal utility index function, that is conversely replaced by a family of ordinal utility functions to be maximized, thus defining advertising elasticity of demand to be satisfied (Chen 2015 ). In this research, tourist preferences may be considered as a second-order factor, based on inter-correlations among several first-order factors (i.e., tourist expectations, proximity and place/destination reputation). We employed and extended tourist preferences patterns to develop the conceptual model that considers preferences directly affecting vacationer choices in terms of hospitality. The results can be useful to enable managers of the hospitality industry to better understand the competitive positioning of their organizations in the marketplace (Hsu et al. 2009 ) and to define the strategies and actions able to enhance the competitiveness of the entire system.
Hence, Fig. 1 presents the conceptual model applied in this study.

Conceptual framework
Tourist Expectations and Preferences
According to the literature, expectations refer to the aspects, both tangibles and intangibles, that tourists wish or are expected to find in the supply. In that sense, they identify a benchmark to determine customer satisfaction (Pleger Bebko 2000 ; Tripathi and Siddiqui 2010 ). Always in line with previous studies (Banerjee and Chua 2016 ; Dube and Renaghan 1999 ; Parasuraman et al. 1991 ; Radojevic et al. 2018 ), the factors included in the present analysis are retrieved by service quality measurements described by the Servqual scale (Parasuraman et al. 1985 ; Zeithaml et al. 1990 , 1993 ), and are confirmed as a stable tool for measuring service expectations—and perceptions—across service industries (e.g., hospitality services). According to the Servqual scale, the items to be considered are tangibles, reliability, empathy, assurance, and responsiveness (Parasuraman et al. 1991 ). Moreover, our analysis will focus exclusively on expectations because the aim of the research is to measure the system of preferences of the hospitality systems, thus overlooking the next post-positivistic model that takes into account three stages of consumer decision processes: pre-purchase influences and decision- making, post-purchase evaluation, and future decision-making (Chen and Gursoy 2001 ; Moutinho 1987 ; Mazursky 1989 ).
Therefore, the firm’s ability to collect and use information about customer needs, called market-sensing capabilities (Likoum et al. 2018 ), has a positive influence on tourist services planning and need to be constantly increased, in order to intercept future requirements and desires of the demand. This ability to sense and react to the changes of consumer needs and desires, especially linked to crisis events, updating and increasing the value offering, represents a critical factor for maintaining and increasing competitiveness of the hospitality system and the corporate reputation as well (Chun 2005 ; Kircova and Esen 2018 ; Pritchard and Wilson 2018 ).
Based on these considerations, the first hypothesis is as follows:
The World Tourism Organization (UNWTO)
Proximity and Tourist Preferences
Carrying on the analysis, the study suggests that tourist preferences are affected by proximity in terms of cultural and physical distance. The first dimension—cultural distance (Boschma 2005 ; Hofstede 1983 , 2001 ; Rodríguez-Pose 2011 ; Rutten and Boekema 2012 ; Torre 2008 )—is expressed furthermore as traditions, history, food, etc. of the country of destination; it is very relevant in the assessment of tourism services (Ahn and McKercher 2015 ; de Carlos et al. 2019 ; McKercher and Du Cros 2003 ). The latter—physical distance—, refers to the perceived attractiveness of the destination/accommodation, influenced by a barycentric location, according to tourists planned tours. On this stance, distance does not only represent a physical parameter, but it is related to a psychological and subjective understanding of the tourists’ appreciation of places, perceived as attractive to visit (Jeuring and Haartsen 2017 ) and accommodations adequate to their standards and desires. Therefore, many tourists consider places near home too familiar and ordinary to satisfy their needs of escape, sense of discovery, searching for exciting experiences associated with being on holiday (Nicolau 2008 ). In addition, instead of the objectively measured spatial separation, the relational aspects between objects—attractions—across space and their contextualization become meaningful (Larsen and Guiver 2013 ; Larsen 2015 ). Thus, the second hypothesis is the following:
Proximity – in terms of physical and cultural distance – has a positive impact on tourist preferences.
Reputation and Tourist Preferences
Among numerous definitions of reputation (Fombrun and Shanley 1990 ; Fombrun 1996 ; Wagner and Peters 2009 ; Urde and Greyser 2015 ), we focus on the tourists' viewpoint. Hence, according to the tourist perception, it can be taken into consideration his/her overall evaluation of a firm, based on his/her reactions to the firm’s products, services, communication activities, interactions (Walsh and Beatty 2007 ). Then, adapting the concept to a place/destination assessment, we considered its celebrity and offer in terms of attractions to visit or arranged for entertainment, which may influence the price/quality ratio. Moreover, promotional activities dynamically contribute to generating the tourist idea about destination. Consequently, a favorable reputation protects an area and its economic operators/stakeholders against the adverse event, as in health crisis, reassuring vacationers on the engagement of the whole system in making all the proper actions to contrast negative phenomenon (Coafee and Rogers 2008 ; Cillo et al. 2021 ). Tourists, on their hand, have a propensity for according a greater trust on such operators compared to destinations with a lower reputation (Foroudi et al. 2016 ). Hence, investing in a place/destination reputation constitutes a strategy that both public and private partners need to reinforce, as confirmed by the Covid-19 pandemic event. Thus, the third hypothesis is as follows:
Place reputation has a favorable impact on tourist preferences.
Tourist Preferences and Hospitality System Competitiveness
Then, we investigated the influence of tourist preferences on hospitality system competitiveness in terms of infrastructures, technology and innovation, history and culture, and macro-environment (Kim et al. 2019 ). Numerous and well managed public infrastructures (Bahar and Kozak 2007 ; Bordas 1994 ; Crouch and Ritchie 1999 ; Dwyer and Kim 2003 ; Enright and Newton 2005 ; Gooroochurn and Sugiyarto 2005 ; Kozak and Rimmington 1999 ), make the tourist experience easier, permitting the host to concentrate on the valuable aspects of the vacation. In addition, well-developed technology and innovation have a relevant impact on the tourist experience (Bordas 1994 ; Chon and Mayer 1995 ; Gooroochurn and Sugiyarto 2005 ; Heath 2003 ). Many studies underlined the unavoidable impact of the development of ICT (Ciampi et al. 2021 ) on the growing attractiveness of destinations and accommodations, increasingly characterized by intensive information sharing and value co-creation (Akehurst 2009 ; Porter and Heppelmann 2014 ; Da Costa Liberato et al. 2018 ; Stamboulis and Skayannis 2003 ). Therefore, the culture of sharing and its participatory implications are becoming more and more part of the travel experience for experts and scholars in the sector. Finally, numbers and variety of cultural attractions and places to visit—macro-environment—increase the hospitality system competitiveness (Bordas 1994 ; Chon and Mayer 1995 ; Crouch and Ritchie 1999 ; Dwyer and Kim 2003 ; Enright and Newton 2005 ; Sukumar et al. 2020 ), diversifying the offering in response to the tourist requests and satisfaction (Hong et al. 2020 ). Hence, we formulated the last hypothesis:
Tourist preferences have a positive effect on hospitality system competitiveness.
Data Collection
To afford our research questions, we collected data regarding tourists’ perception before and during and post the pandemic crisis. The reason why to choose Italy is the importance of the tourism and hospitality sector, which is one of the key economic drivers of the Country (telegraph.co.uk 2020 ). However, due to Covid-19, the sector had to face issues globally. The research illustrated that Covid-19 pandemic has significant influences on revenues of the sector by diminution over 40 billion euros, compared to the same period of the earlier year (Statista.com 2020 ).
To analyze the effects of Covid-19 pandemic on the hospitality system, this study concentrated on the demand for accommodation services based on two main reasons.
- (i) The accommodation facilities, initially and still today with great difficulties, had to respond to the changing needs of the tourist, both in that they are not really ready but above all because they had to wait to receive regulatory guidelines and address regarding the methods of providing the services and the time of reopening. This has been confirmed by a sample of hotel structures and territorial tourism development actors who have confirmed the difficulty in responding to potential changes without prior government indications. In this regard, the opening and service protocols have been issued only recently (05-11-2020) connected to the impossibility of moving among Italian regions (06-03-2020). In any case, the analysis of the offer could hardly have made explicit the changes in the expectations of the demand and in the new tourist behaviors (during and post-Covid). On the other hand, the analysis of the demand conducted in the paper has allowed and allows better to bring out the changing needs of the demand in terms of tourist preferences.
- (ii) The analysis directly observed the change of attitude of tourists who represent the real actors on which the changes are brought by the pandemic, only as a consequence reversed on the hospitality structures.
We distributed a questionnaire among social media and tourism association in Italy between April and June 2020. We got 473 answers, 441 of which were considered usable. Table Table1 1 illustrates that the sample was composed by a slight majority of female (52.4%) young (born between 1991 to 2000 42.4%); elevated: graduated at secondary school (47.8%), and postgraduate (40.6%). 68.9% of the participants had traveled for vacation around three times during last year (16.1%). 50.6% of the applicants were interested in visiting.
Participant characteristics
We built the research item measurements according to the literature review and earlier researches. We used six items to measure expectations via five constructs: tangibles, reliability, responsiveness, assurance, and empathy (Banerjee and Chua 2016 ; Dube and Renaghan 1999 ; Parasuraman et al. 1991 ; Radojevic et al. 2018 ). Proximity was assessed by cultural distance (Boschma 2005 ; Hofstede 1983 , 2001 ; Rodríguez-Pose 2011 ; Rutten and Boekema 2012 ; Torre 2008 ) and physical distance (Ahn and McKercher 2015 ; de Carlos et al. 2019 ; McKercher and Du Cros 2003 ). The measurement items for reputation were assessed with four items: image, communication, price/quality relation, and attractions (Fombrun and Shanley 1990 ; Fombrun 1996 ; Wagner and Peters 2009 ; Urde and Greyser 2015 ). Tourist preferences were tested as a single item (Lockyer 2005 ). In addition, hospitality system competitiveness was expressed with four items: Infrastructure (Bahar and Kozak 2007 ; Bordas 1994 ; Crouch and Ritchie 1999 ; Dwyer and Kim 2003 ; Enright and Newton 2005 ; Gooroochurn and Sugiyarto 2005 ; Kozak and Rimmington 1999 ), Technology and Innovation (Bordas 1994 ; Chon and Mayer 1995 ; Gooroochurn and Sugiyarto 2005 ; Heath 2003 ), History and culture (Bahar and Kozak 2007 ; Crouch and Ritchie 1999 ; Draper et al. 2011 ; Dwyer and Kim 2003 ; Enright and Newton 2005 ; Go and Govers 2000 ; Heath 2003 ; Kozak and Rimmington 1999 ; Mazanec et al. 2007 ), and Macro-environment (Bordas 1994 ; Chon and Mayer 1995 ; Crouch and Ritchie 1999 ; Dwyer and Kim 2003 ; Enright and Newton 2005 ). Table Table2 2 illustrates the item measurements and references, while the full questionnaire is included in Table Table2. 2 . We used a seven-point Likert scale(1 = min importance, 7 = max importance).
Measurement model evaluation for constructs
Analysis and Model Testing
We examined the research model by using the partial least squares structural equation modeling (PLS-SEM). Based on the number of items together with sample size, PLS-SEM is the better software, as it avoids the constraints of AMOS (Hair et al. 2014 ). In this study, we employed the measurement and structural models.
Measurement Model
To examine the reliability and validity, the measurement model was used as a preliminary inspection of the construct’s performance within the entire sample. Cronbach’s α and composite reliability were assessed for internal consistency reliability and the items are satisfactory (an α and CR above 0.80) (Nunally and Bernstein 1994 ). Discriminant validity and convergent validity (AVE) were tested for each variable. Table Table2 2 shows that the results of AVEs for variables are above 0.50 (Field 2013 ). In addition, the indicators’ outer loadings on a construct signifying the discriminant validity is attained (Chin 1998 ). The results confirmed the respectable reliability of all measures. Table Table3 3 demonstrates the correlations between the research constructs.
Correlations between constructs
**The correlation is significant at p > 0.01
Structural Model Assessment
We assessed the structural model results after confirming the construct measures. The collinearity between the constructs was tested before examining the path coefficient assessment. By examining each set of predictors in the structural model for collinearity, each predictor shows the Variance inflation factors (VIF) value was lower than 0.5. Then, we evaluated the significance of path coefficients to explore the hypothesized relationships proposed by the research conceptual model. As Table Table4 4 demonstrates, the importance of the research path coefficients was tested by employing 5000 bootstrapping to create t -statistics.
Path coefficients
The statistics demonstrated that H1, the impact of tourist expectations on tourist preferences (pre-Covid: β = 0.600; post-Covid: β = 0.776, p < 0.001) was significant from both samples. H2, the impact of proximity on tourist preferences was supported refering to within/pre-COVID ( β = 0.217, p < 0.001); however, the relationships were insignificant refering to post-Covid ( β = 0.034, p > 0.001). H3 was supported (pre-Covid: β = 0.337; post-Covid: β = 0.245, p < 0.001) and it shows a positive impact of place/destination reputation on tourist preferences. H4 is also supported (Pre-Covid: β = 0.626; post-Covid: β = 0.626, p < 0.001) showing the strong impact of tourist preferences on hospitality system competitiveness.
Lastly, we estimated R 2 values in the path model for the endogenous variables. The R 2 values of our model demonstrated some degree of relationships and clarified over 0.928% of the variances of tourist preferences. To improve the predictive accuracy, we employed Stone-Geisser’s Q 2 value by employing the blindfolding technique for an omission distance of D = 7. Hair et al. ( 2014 ) stated that the model could be trusted when the predictive relevance of Q 2 is larger than 0. Based on the results illustrated in Table Table5, 5 , there is a support for the model’s predictive relevance (Chin 1998 ).
Results of R 2 and Q 2 values
Discussions and Implications
Based on the aim of the paper and to minimize the gaps previously underlined, we employed and extended tourist preferences patterns in order to develop our conceptual model (Fig. 1 ) that considers preferences directly affecting travelers’ decisions in terms of hospitality. The results can be helpful to enable operators of the tourism industry to better interpret the new needs of the marketplace (Hsu et al. 2009 ) improving the competitiveness of the entire hospitality system.
On this stream, the analysis carried out on pre-Covid and during and post-Covid pandemic is suitable in underlining that when a tourist defines his/her criteria to choose toward lodging, food and drink services, transports, events (Chiang et al. 2019 ) to attend, and attractions to visit, the first-order factors identified are very consistent and relevant. It is clear the strong tie between tourist expectations and tourist preferences, as demonstrated in H1. In fact, both in pre-Covid and during and post-Covid measurements, the impact of expectations on tourist preferences is observed, indicating that they are scarcely affected by external adverse conditions, e.g., the pandemic event. Hence, the outcomes highlight in terms of theoretical implications that the firm’s ability to collect and act on information about tourist desires has a positive influence on tourist services planning and need to be constantly increased, intercepting future requirements and aspirations of the demand (as widely demonstrated in previous studies: Banerjee and Chua 2016 ; Dube and Renaghan 1999 ; Parasuraman et al. 1991 ; Radojevic et al. 2018 ). Practically speaking, tourism operators need to really engage in the dialog with customers; social media, for instance, may constitute very interesting tools to directly connect with them (Cuomo et al. 2021 ).
Moreover, the study hints that tourist preferences are affected by proximity, expressed as a cultural and physical distance in H2. Employing this perspective, we may interpret the results of this research. They show that the impact of proximity on tourist preferences was supported with reference to pre-Covid time. However, the relationships were non-significant when referred to during and post-Covid. This likely expresses a theoretical implication, whereas pandemic outbreak actually has modified the Maslow's hierarchy of needs, ratifying the renewal of safety requirements in terms of personal security and relocating the relevance of proximity—conceived as similarity/closeness instead of distance (Diaz-Soria 2017 )—in tourist preferences. However, deeply analyzing the results, it is evident that in the during and post-Covid, the proximity dimension—both in terms of cultural affinity (Hofstede 1983 , 2001 ) and physical closeness of the destination (Ahn and McKercher 2015 ; McKercher and Du Cros 2003 )—can better satisfy the safety needs aforementioned, encouraging tourists to prefer less exotic or faraway destinations (Ahn and McKercher 2015 ). In this sense, local, regional, or national destinations have been preferred by 72,3% of the sample as a goal of their next vacation, while 12.2% declare they will not go on holidays in 2020. From a practical point of view, this outcome means that closer destinations communicate to the travelers a major sense of control and security, due to a better and easier knowledge toward national procedures and regulations adopted for the progressive resumption of tourism services and for health protocols in Italian hospitality establishments. So, proximity can be considered a ‘new commodity’ and the appreciation of the home region/nation as an appealing form of a tourism destination. In economic and managerial terms, while dramatically changing travel patterns on industry and destinations, Covid-19 crisis creates opportunities for sustainable and proximity tourism (Jeuring and Haartsen 2017 ; Higgins-Desbiolles et al. 2019 ; Romagosa 2020 ). As a matter of fact, home trips may also support a different type of tourism, more respectful of nature and of the visited communities, avoiding mass tourism destinations, where the health danger remains more uncertain (Jamal and Budke 2020 ). If accurately planned and incentivized, with both public and private support, this contingent variance on the tourism pattern may represent a durable response to the over-tourism phenomenon (Goodwin 2017 ; Koens et al. 2018 ; Milano et al. 2018 ), affecting many Italian cities (the case of Venice, Seraphin et al. 2018 ), while in the meantime less famous or popular destinations may be proposed as safer places, enjoyable and sustainable from an economic, social, and environmental viewpoint.
These considerations have an impact on the relevance of place/destination reputation (Fombrun 1996 ; Wagner and Peters 2009 ; Urde and Greyser 2015 ) and respect tourist preferences both in pre-Covid and during and post-Covid. Hence, the tourist perception is completely confirmed in H3. Overall evaluation of a firm is based on the reactions to the firm’s goods, services, communication activities, interactions with its representatives, and/or known corporate activities (Walsh and Beatty 2007 ) in terms of price/quality relations, image, attractions, and communication.
Lastly, we investigated the influence of tourist’s preferences on hospitality system competitiveness, as confirmed in H4 for both pre-Covid and during and post-Covid pandemics. More specifically, innovation, infrastructures, history and culture, and macro-environment improve tourist experience, and they define the most valuable aspects of vacation as described and confirmed by the literature (Gooroochurn and Sugiyarto 2005 ; Akehurst 2009 ; Porter and Heppelmann 2014 ; Da Costa Liberato et al. 2018 ; Cillo et al. 2021 ). The theory is confirmed in this case, but the managerial impact needs to understand how it is important to take into account the different variables that impact on tourist’s preferences in order to build strong competitive advantages in the hospitality system.
Limitations, Future Perspectives of Research, and Conclusions
Despite the interesting results presented above, the study has some limitations. The main limit regards the geographic area of the research process, since the country of origin of the participants under investigation significantly influences the characteristics of the sample, in such case formed by Italian tourists. National culture, system of offering, level of income, etc., deeply affect tourist perceptions and are reflected in the outcomes of the analysis. Thus, to overcome this limit, it would be useful to extend the test to an international sample. Future research, indeed, might compare different clusters of national tourists to evaluate contrasting preferences. The actual sample is also composed mainly by Millennials, in search of unique and authentic experiences, even in the hospitality sector. This generation has less availability of money, but is digital addicted and sensitive toward sustainable issues in the tourism sector, showing greater attention to local communities. However, it would be very compelling to compare the results enlarging the sample to Baby Boomers and Generation X—Covid-19 Generation (Zwanka and Buff 2020 ). Future studies might analyze the consequences of the hospitality system competitiveness. Furthermore, following studies on possible post-Covid-19 scenarios are essential to help tourism stakeholders profile the offer well, but more accurate data collected on more representative groups are needed.
Finally, the specific period of the analysis needs to be considered. The hospitality industry, and the tourism sector more in general, is facing immense challenges at present, strictly stressed by the global health crisis provoked by the novel Coronavirus–caused respiratory disease Covid-19 (Strielkowski 2020 ). Even though travel and tourism have been the first economic victims of that situation, at the same time, they have been the principal defendant ‘to sit at the dock’. Since nowadays people move mostly for for tourism reasons, some ascribed to leisure/business movements due to the dissemination all over the world of the Corona outbreak, developed in China last year.
Thus, even though this opinion cannot be shared, the hospitality and travel operators are due to suddenly recover the failure of trust from tourists and local communities. The key lies in the ability to satisfy the surfacing of emergent needs—or perhaps the renewal of old ones on the base of the Maslow Pyramid—linked to safety above all, that have an influence on the effective accessibility and pleasantness of the vacation, affecting the actual touristic demand of hospitality. From now on and waiting for international voyagers come back, the hospitality actors and the public agents need to transform this weakness into an opportunity (Sigala 2020 ), by investing in the under-tourism and tourism of proximity phenomena—strictly connected to local development (Diaz-Soria 2017 )— as the most feasible solutions to answer, in the middle term, the dramatic freeze of the global hospitality offer. For these reasons, it could be interesting investigating on the following topics for the future: no-touch technology anywhere, free cancelations up to 48 h, proximity of high-level hospital facilities, and their impacts on the tourist preferences.
Hence, all stakeholders, including tourists, have a great responsibility, in terms of redirecting tourism, from both supply and demand side, toward a truly sustainable and resilient system, able to answer to future challenges in a more balanced manner, from an economic, social, and environmental viewpoint. This new normal may actually represent a process toward the comprehensive transformation of touristic territories, while always balancing the arrangement of attractive systems of offering, local quality of living, and sustainable development of an area, in terms of favorable repercussions for all the players involved (Uriely et al. 2002 ). By this way, tourism can be considered as a form of deep civic engagement—more than a simple consumption—favoring the development of a new ethos of sustainable tourism.
Biographies
is an Associate Professor of Business Economics at the University of Salerno where she teaches “Management and Innovation” and “Management”. She teaches also at the Business School of the ‘Bicocca’ University in Milan. She is Member of several Editorial Committees of national and international journals. She has published in top international journals about identity and reputation, digital transformation, consumer behaviour, corporate, and investment assessment. She has presented papers and research outcomes at numerous Conferences all around the world. She carries out research, consultancy, and training to various organizations (both public and private) on finance and performance, investment assessment, market research, and marketing.
is currently researcher in “Business Management” at the University “Bicocca” of Milan (Italy) where he teaches “Management”. Her main subjects of interest concern Augmented reality and marketing, Consumer Behaviour, Retail and experience, and Brand and Corporate Reputation. She has published in several journals, both national and international; she has also presented papers and research outcomes at numerous international conferences. According to ASN (National Scientific Habilitation), she received the habilitation for the Associate Professorship. Actually she serves as a member of the editorial board on the Journals: Esperienze d’Impresa and Global Journal of commerce & Management Perspective.
is an Associate Professor of Business Economics at the University of Bergamo, where he teaches and “Management” and “Marketing”. He teaches also at the Business School of the ‘Bocconi’ University in Milan. He is Member of several Editorial Committees of national and international journals. He has published in top international journals about corporate finance, business crises, corporate, and investment assessment. He has presented papers and research outcomes at numerous Conferences all around the world. He carries out research, consultancy, and training to various organizations (both public and private) on finance, restructuring and turnaround, and investment assessment.
is an Associate Professor of Management at the Department of Economics and Statistics of the University of Salerno, Italy, EU. He holds a PhD in Economics and Management of Public Organizations from the University of Salerno, where he is the Scientific Director of the Postgraduate course in Wine Business and the Past Vice-Director of the Second Level Master’s in Management of Healthcare Organisations – Daosan. He is also the Chairman of the Euromed Research Interest Committee on Wine Business. His research interests focus mainly on wine business, corporate venture capital, information systems, and healthcare management.
is a Full Professor of Business Economics at the University of Salerno, where he teaches “Business Plan and development”. He is Member of several Editorial Committees of national and international journals. He has published in top national and international journals about corporate finance, digital transformation, and corporate performance. He carries out research, consultancy, and training to various organizations (both public and private) on finance and performance, investment assessment, and M&A.
Open access funding provided by Università degli Studi di Salerno within the CRUI-CARE Agreement.
Declarations
On the behalf of all authors, the corresponding author states there is no conflict of interest.
Publisher's Note
Springer Nature remains neutral with regard to jurisdictional claims in published maps and institutional affiliations.
Contributor Information
Maria Teresa Cuomo, Email: ti.asinu@omoucm .
Debora Tortora, Email: [email protected] .
Alessandro Danovi, Email: [email protected] .
Giuseppe Festa, Email: ti.asinu@atsefg .
Gerardino Metallo, Email: ti.asinu@llatemeg .
- Ahn MJ, McKercher B. The effect of cultural distance on tourism: A study of international visitors to Hong Kong. Asia Pacific Journal of Tourism Research. 2015; 20 (1):94–113. doi: 10.1080/10941665.2013.866586. [ CrossRef ] [ Google Scholar ]
- Akehurst G. User generated content: The use of blogs for tourism organisations and tourism consumers. Service Business. 2009; 3 (1):51–61. doi: 10.1007/s11628-008-0054-2. [ CrossRef ] [ Google Scholar ]
- Bahar O, Kozak M. Advancing destination competitiveness research: Comparison between tourists and service providers. Journal of Travel and Tourism Marketing. 2007; 22 (2):61–71. doi: 10.1300/J073v22n02_05. [ CrossRef ] [ Google Scholar ]
- Banerjee, S., and Chua, A. Y. (2016). In search of patterns among travellers’ hotel ratings in TripAdvisor. Tourism Management, 53(Apr), 125–131.
- Basmann RL. A theory of demand with variable consumer preferences. Econometrica, Journal of the Econometric Society. 1956; 24 (1):47–58. doi: 10.2307/1905258. [ CrossRef ] [ Google Scholar ]
- Bi, J. W., Liu, Y., Fan, Z. P., and Zhang, J. (2020). Exploring asymmetric effects of attribute performance on customer satisfaction in the hotel industry. Tourism Management 77, 104006.
- Bordas E. Competitiveness of tourist destinations in long distance markets. The Tourist Review. 1994; 49 (3):3–9. doi: 10.1108/eb058158. [ CrossRef ] [ Google Scholar ]
- Boschma R. Proximity and innovation: A critical assessment. Regional Studies. 2005; 39 (1):61–74. doi: 10.1080/0034340052000320887. [ CrossRef ] [ Google Scholar ]
- Chen JS, Gursoy D. An investigation of tourists’ destination loyalty and preferences. International Journal of Contemporary Hospitality Management. 2001; 13 (2):79–85. doi: 10.1108/09596110110381870. [ CrossRef ] [ Google Scholar ]
- Chen LF. Exploring asymmetric effects of attribute performance on customer satisfaction using association rule method. International Journal of Hospitality Management. 2015; 47 (May):54–64. doi: 10.1016/j.ijhm.2015.03.002. [ CrossRef ] [ Google Scholar ]
- Chiang CF, Chen WY, Hsu CY. Classifying technological innovation attributes for hotels: An application of the Kano model. Journal of Travel and Tourism Marketing. 2019; 36 (7):796–807. doi: 10.1080/10548408.2019.1575786. [ CrossRef ] [ Google Scholar ]
- Chin W. The partial least squares approach to structural equation modelling. In: Marcoulides G, editor. Modern methods for business research. Mahwah, NJ: Lawrence Erlbaum Associates; 1998. pp. 295–358. [ Google Scholar ]
- Chiu HC, Lin NP. A service quality measurement derived from the theory of needs. The Service Industries Journal. 2004; 24 (1):187–204. doi: 10.1080/02642060412331301202. [ CrossRef ] [ Google Scholar ]
- Chon KS, Mayer KJ. Destination competitiveness models in tourism and their application to Las Vegas. Journal of Tourism Systems and Quality Management. 1995; 1 (2):227–246. [ Google Scholar ]
- Chun R. Corporate reputation: Meaning and measurement. International Journal of Management Review. 2005; 7 (2):91–109. doi: 10.1111/j.1468-2370.2005.00109.x. [ CrossRef ] [ Google Scholar ]
- Cillo V, Rialti R, Del Giudice M, Usai A. Niche tourism destinations’ online reputation management and competitiveness in big data era: Evidence from three Italian cases. Current Issues in Tourism. 2021; 24 (2):177–191. doi: 10.1080/13683500.2019.1608918. [ CrossRef ] [ Google Scholar ]
- Coaffee J, Rogers P. Reputational risk and resiliency: The branding of security in place-making. Place Branding and Public Diplomacy. 2008; 4 (3):205–217. doi: 10.1057/pb.2008.12. [ CrossRef ] [ Google Scholar ]
- Ciampi F, Demi S, Magrini A, Marzi G, Papa A. Exploring the impact of big data analytics capabilities on business model innovation: The mediating role of entrepreneurial orientation. Journal of Business Research. 2021; 123 :1–13. doi: 10.1016/j.jbusres.2020.09.023. [ CrossRef ] [ Google Scholar ]
- Crouch GI, Ritchie JB. Tourism, competitiveness, and societal prosperity. Journal of Business Research. 1999; 44 (3):137–152. doi: 10.1016/S0148-2963(97)00196-3. [ CrossRef ] [ Google Scholar ]
- Centro Studi Turistici (Cst). 2020. Turismo Estate 2020 Italia: mancano gli stranieri, calo della domanda del -30,4%, http://centrostudituristicifirenze.it/blog/turismo-estate-2020-italia-mancano-stranieri-calo-della-domanda/ . Accessed 5 Sept 2020.
- Cuomo, M. T., Tortora, D., Foroudi, P., Giordano, A., Festa, G., & Metallo, G. (2021). Digital transformation and tourist experience co-design: Big social data for planning cultural tourism. Technological Forecasting and Social Change, 162, 120345.
- da Costa Liberato PM, Alen-Gonzalez E, de Azevedo Liberato DFV. Digital technology in a smart tourist destination: The case of Porto. Journal of Urban Technology. 2018; 25 (1):75–97. doi: 10.1080/10630732.2017.1413228. [ CrossRef ] [ Google Scholar ]
- De Carlos P, Alén E, Pérez-González A, Figueroa B. Cultural differences, language attitudes and tourist satisfaction: A study in the Barcelona hotel sector. Journal of Multilingual and Multicultural Development. 2019; 40 (2):133–147. doi: 10.1080/01434632.2018.1493114. [ CrossRef ] [ Google Scholar ]
- Demoskopika. 2020. Turismo. Effetto Covid, Italia perde la metà delle presenze nel 2020. http://demoskopika.eu . Accessed 6 Oct 2020.
- Diaz-Soria I. Being a tourist as a chosen experience in a proximity destination. Tourism Geographies. 2017; 19 (1):96–117. doi: 10.1080/14616688.2016.1214976. [ CrossRef ] [ Google Scholar ]
- Draper J, Woosnam KM, Norman WC. Tourism use history: Exploring a new framework for understanding residents’ attitudes toward tourism. Journal of Travel Research. 2011; 50 (1):64–77. doi: 10.1177/0047287509355322. [ CrossRef ] [ Google Scholar ]
- Dube L, Renaghan LM. How hotel attributes deliver the promised benefits: Guests' perspectives on the lodging industry's functional best practices (part II) Cornell Hotel and Restaurant Administration Quarterly. 1999; 40 (5):89–95. doi: 10.1177/001088049904000513. [ CrossRef ] [ Google Scholar ]
- Dwyer L, Kim C. Destination competitiveness: Determinants and indicators. Current Issues in Tourism. 2003; 6 (5):369–414. doi: 10.1080/13683500308667962. [ CrossRef ] [ Google Scholar ]
- Enright MJ, Newton J. Determinants of tourism destination competitiveness in Asia Pacific: Comprehensiveness and universality. Journal of Travel Research. 2005; 43 (4):339–350. doi: 10.1177/0047287505274647. [ CrossRef ] [ Google Scholar ]
- Field A. Discovering statistics using IBM SPSS statistics. London: Sage; 2013. [ Google Scholar ]
- Fombrun CJ. Reputation. Boston: Harvard Business School Press; 1996. [ Google Scholar ]
- Fombrun C, Shanley M. What's in a name? Reputation building and corporate strategy. Academy of Management Journal. 1990; 33 (2):233–258. doi: 10.2307/256324. [ CrossRef ] [ Google Scholar ]
- Foroudi P, Gupta S, Kitchen P, Foroudi MM, Nguyen B. A framework of place branding, place image, and place reputation. Qualitative Market Research: An International Journal. 2016; 19 (2):241–264. doi: 10.1108/QMR-02-2016-0020. [ CrossRef ] [ Google Scholar ]
- Go FM, Govers R. Integrated quality management for tourist destinations: A European perspective on achieving competitiveness. Tourism Management. 2000; 21 (1):79–88. doi: 10.1016/S0261-5177(99)00098-9. [ CrossRef ] [ Google Scholar ]
- Goodwin, H. 2017. The challenge of overtourism. Responsible tourism partnership. Working Paper 1.
- Gooroochurn N, Sugiyarto G. Competitiveness indicators in the travel and tourism industry. Tourism Economics. 2005; 11 (1):25–43. doi: 10.5367/0000000053297130. [ CrossRef ] [ Google Scholar ]
- Gössling, S., Scott, D., and Hall, C. M. (2020). Pandemics, tourism and global change: a rapid assessment of COVID-19. Journal of Sustainable Tourism , 29(Apr), 1–20.
- Hair JF, Jr, Hult GTM, Ringle CM, Sarstedt M. A primer on partial least squares structural equation modeling (PLS-SEM) London: Sage; 2014. [ Google Scholar ]
- Hall CM, Scott D, Gössling S. Pandemics, transformations and tourism: Be careful what you wish for. Tourism Geographies. 2020; 22 (3):577–598. doi: 10.1080/14616688.2020.1759131. [ CrossRef ] [ Google Scholar ]
- Heath, E. 2003. Towards a model to enhance destination competitiveness: A Southern African perspective. In CAUTHE 2003: Riding the Wave of Tourism and Hospitality Research , 500–521. Lismore: Southern Cross University.
- Higgins-Desbiolles F, Carnicelli S, Krolikowski C, Wijesinghe G, Boluk K. Degrowing tourism: Rethinking tourism. Journal of Sustainable Tourism. 2019; 27 (12):1926–1944. doi: 10.1080/09669582.2019.1601732. [ CrossRef ] [ Google Scholar ]
- Hofstede G. National cultures in four dimensions: A research-based theory of cultural differences among nations. International Studies of Management and Organization. 1983; 13 (1–2):46–74. doi: 10.1080/00208825.1983.11656358. [ CrossRef ] [ Google Scholar ]
- Hofstede G. Culture's consequences: Comparing values, behaviours, institutions and organizations across nations. London: Sage; 2001. [ Google Scholar ]
- Hong Y, Cai G, Mo Z, Gao W, Xu L, Jiang Y, Jiang J. The Impact of COVID-19 on Tourist Satisfaction with BandB in Zhejiang, China: An Importance-Performance Analysis. International Journal of Environmental Research and Public Health. 2020; 17 (10):3747. doi: 10.3390/ijerph17103747. [ PMC free article ] [ PubMed ] [ CrossRef ] [ Google Scholar ]
- Hsu TK, Tsai YF, Wu HH. The preference analysis for tourist choice of destination: A case study of Taiwan. Tourism Management. 2009; 30 (2):288–297. doi: 10.1016/j.tourman.2008.07.011. [ CrossRef ] [ Google Scholar ]
- http://centrostudituristicifirenze.it/blog/previsioni-estate-2020-italia-e-toscana-contrazione-domanda-offerta/ .
- https://8bddbd10-e41a-4fdb-b8f8-1f01f54c0d15.filesusr.com/ugd/779c1f_397717b2e039408d9c1bf40ce547f5e7.pdf .
- Jamal T, Budke C. Tourism in a world with pandemics: Local-global responsibility and action. Journal of Tourism Futures. 2020; 6 :181–188. doi: 10.1108/JTF-02-2020-0014. [ CrossRef ] [ Google Scholar ]
- Jeuring JHG, Haartsen T. The challenge of proximity: The (un) attractiveness of near-home tourism destinations. Tourism Geographies. 2017; 19 (1):118–141. doi: 10.1080/14616688.2016.1175024. [ CrossRef ] [ Google Scholar ]
- Kim B, Kim S, King B, Heo CY. Luxurious or economical? An identification of tourists’ preferred hotel attributes using best–worst scaling (BWS) Journal of Vacation Marketing. 2019; 25 (2):162–175. doi: 10.1177/1356766718757789. [ CrossRef ] [ Google Scholar ]
- Kircova I, Esen E. The effect of corporate reputation on consumer behaviour and purchase intentions. Management Research and Practice. 2018; 10 (4):21–32. [ Google Scholar ]
- Koens K, Postma A, Papp B. Is overtourism overused? Understanding the impact of tourism in a city context. Sustainability. 2018; 10 (12):1–15. doi: 10.3390/su10124384. [ CrossRef ] [ Google Scholar ]
- Kozak M, Rimmington M. Measuring tourist destination competitiveness: Conceptual considerations and empirical findings. International Journal of Hospitality Management. 1999; 18 (3):273–283. doi: 10.1016/S0278-4319(99)00034-1. [ CrossRef ] [ Google Scholar ]
- Kwok, L. 2021. Will the hospitality and travel industry recover in 2021? Hospitalitynet.org. Assessed 19 June 2021.
- Larsen GR. Distant at your leisure: Consuming distance as a leisure experience. In: Gammon S, Elkington S, editors. Landscapes of leisure: Space, place and identities. New York: Palgrave Macmillan; 2015. pp. 192–201. [ Google Scholar ]
- Larsen GR, Guiver JW. Understanding tourists’ perceptions of distance: A key to reducing the environmental impacts of tourism mobility. Journal of Sustainable Tourism. 2013; 21 (7):968–981. doi: 10.1080/09669582.2013.819878. [ CrossRef ] [ Google Scholar ]
- Likoum SWB, Shamout MD, Harazneh I, Abubakar AM. Market-sensing capability, innovativeness, brand management systems, market dynamism, competitive intensity, and performance: An integrative review. Journal of the Knowledge Economy. 2018; 11 :593–613. doi: 10.1007/s13132-018-0561-x. [ CrossRef ] [ Google Scholar ]
- Lockyer T. Understanding the dynamics of the hotel accommodation purchase decision. International Journal of Contemporary Hospitality Management. 2005; 17 (6):481–492. doi: 10.1108/09596110510612121. [ CrossRef ] [ Google Scholar ]
- Mathieson A, Wall G. Tourism, economic, physical and social impacts. Harlow: Longman; 1982. [ Google Scholar ]
- Mazanec JA, Wöber K, Zins AH. Tourism destination competitiveness: From definition to explanation? Journal of Travel Research. 2007; 46 (1):86–95. doi: 10.1177/0047287507302389. [ CrossRef ] [ Google Scholar ]
- Mazursky D. Testing a cultural tourism typology. International Journal of Tourism Research. 1989; 5 (1):45–58. [ Google Scholar ]
- Milano, C., J.M. Cheer, and M. Novelli. 2018. Overtourism: A growing global problem. The Conversation , July 18.
- McKercher B, Du Cros H. Testing a cultural tourism typology. International Journal of Tourism Research. 2003; 5 (1):45–58. doi: 10.1002/jtr.417. [ CrossRef ] [ Google Scholar ]
- Moutinho L. Consumer behavior in tourism. European Journal of Marketing. 1987; 21 (10):3–44. doi: 10.1108/EUM0000000004718. [ CrossRef ] [ Google Scholar ]
- Nicolau JL. Characterizing tourist sensitivity to distance. Journal of Travel Research. 2008; 47 (1):43–52. doi: 10.1177/0047287507312414. [ CrossRef ] [ Google Scholar ]
- Nientied P, Shutina D. Tourism in transition, the post-Covid 19 aftermath in the Western Balkans. Co-PLAN Resil. Ser. 2020; 2 :1–20. [ Google Scholar ]
- Nunally, J.C. and Bernstein, I. (1994). SPSS and SAS procedures for estimating indirect effects in simple mediation models, Behavior Research Method, Instruments, and Computers , 36(Nov), 717–731. [ PubMed ]
- Parasuraman A, Berry LL, Zeithaml VA. Understanding customer expectations of service. Sloan Management Review. 1991; 32 (3):39–48. [ Google Scholar ]
- Parasuraman A, Zeithaml V, Berry L. A conceptual model of service quality and its implications for future research. Journal of Marketing. 1985; 49 (Fall):41–50. doi: 10.1177/002224298504900403. [ CrossRef ] [ Google Scholar ]
- Pleger Bebko C. Service intangibility and its impact on consumer expectations of service quality. Journal of Services Marketing. 2000; 14 (1):9–26. doi: 10.1108/08876040010309185. [ CrossRef ] [ Google Scholar ]
- Porter ME, Heppelmann JE. How smart, connected products are transforming competition. Harvard Business Review. 2014; 92 (11):64–88. [ Google Scholar ]
- Pritchard M, Wilson T. Building corporate reputation through consumer responses to green new products. Journal of Brand Management. 2018; 25 (1):38–52. doi: 10.1057/s41262-017-0071-3. [ CrossRef ] [ Google Scholar ]
- Radojevic, T., Stanisic, N., Stanic, N., and Davidson, R. (2018). The effects of traveling for business on customer satisfaction with hotel services. Tourism Management, 67(Aug), 326–341.
- Rodríguez-Pose A. Economists as geographers and geographers as something else: On the changing conception of distance in geography and economics. Journal of Economic Geography. 2011; 11 (2):347–356. doi: 10.1093/jeg/lbq034. [ CrossRef ] [ Google Scholar ]
- Romagosa, F. (2020). The COVID-19 crisis: Opportunities for sustainable and proximity tourism. Tourism Geographies , (May), 1–5.
- Rutten R, Boekema F. From learning region to learning in a socio-spatial context. Regional Studies. 2012; 46 (8):981–992. doi: 10.1080/00343404.2012.712679. [ CrossRef ] [ Google Scholar ]
- Seraphin, H., Sheeran, P., and Pilato, M. (2018). Over-tourism and the fall of Venice as a destination. Journal of Destination Marketing and Management, 9(Sep), 374–376.
- Sigala M. Tourism and COVID-19: Impacts and implications for advancing and resetting industry and research. Journal of Business Research. 2020; 117 :312–321. doi: 10.1016/j.jbusres.2020.06.015. [ PMC free article ] [ PubMed ] [ CrossRef ] [ Google Scholar ]
- Stamboulis Y, Skayannis P. Innovation strategies and technology for experience-based tourism. Tourism Management. 2003; 24 (1):35–43. doi: 10.1016/S0261-5177(02)00047-X. [ CrossRef ] [ Google Scholar ]
- statista.com. 2020. https://www.statista.com/page/covid-19-coronavirus . Assessed 19 June 2020.
- Stimson, N. 2021. Business travel: Full recovery expected by 2025. Hospitalitynet.org. Assessed 19 June 2021.
- Strielkowski, W. 2020. International tourism and COVID-19: Recovery strategies for tourism organisations. Preprint.
- Sukumar A, Jafari-Sadeghi V, Garcia-Perez A, Dutta DK. The potential link between corporate innovations and corporate competitiveness: Evidence from IT firms in the UK. Journal of Knowledge Management. 2020; 24 (5):965–983. doi: 10.1108/JKM-10-2019-0590. [ CrossRef ] [ Google Scholar ]
- telegraph.co.uk. 2020. https://www.telegraph.co.uk/travel/news/italy-travel-advice-coronavirus/ . Assessed 19 June 2020.
- Torre A. On the role played by temporary geographical proximity in knowledge transmission. Regional Studies. 2008; 42 (6):869–889. doi: 10.1080/00343400801922814. [ CrossRef ] [ Google Scholar ]
- Tripathi SN, Siddiqui MH. An empirical study of tourist preferences using conjoint analysis. International Journal of Business Science and Applied Management (IJBSAM) 2010; 5 (2):1–16. [ Google Scholar ]
- UNWTO. 2020. UNWTO World Tourism Barometer No. 18(2). Madrid: UNWTO.
- Urde M, Greyser SA. The Nobel Prize: The identity of a corporate heritage brand. Journal of Product and Brand Management. 2015; 24 (4):318–332. doi: 10.1108/JPBM-11-2014-0749. [ CrossRef ] [ Google Scholar ]
- Uriely N, Israeli AA, Reichel A. Heritage proximity and resident attitudes toward tourism development. Annals of Tourism Research. 2002; 29 (3):859–861. doi: 10.1016/S0160-7383(01)00092-5. [ CrossRef ] [ Google Scholar ]
- Wachyuni, S. S., and Kusumaningrum, D. A. (2020). The effect of COVID-19 pandemic: How are the future tourist behavior? Journal of Education, Society and Behavioural Science, (Jun), 67–76.
- Wagner O, Peters M. Can association methods reveal the effects of internal branding on tourism destination stakeholders? Journal of Place Management and Development. 2009; 2 (1):52–69. doi: 10.1108/17538330910942807. [ CrossRef ] [ Google Scholar ]
- Walsh G, Beatty SE. Customer-based corporate reputation of a service firm: Scale development and validation. Journal of the Academy of Marketing Science. 2007; 35 (1):127–143. doi: 10.1007/s11747-007-0015-7. [ CrossRef ] [ Google Scholar ]
- Wen J, Kozak M, Yang S, Liu F. COVID-19: Potential effects on Chinese citizens’ lifestyle and travel. Tourism Review. 2020 doi: 10.1108/TR-03-2020-0110. [ CrossRef ] [ Google Scholar ]
- www.fiavet.it . 2020.
- Yu M, Li Z, Yu Z, He J, Zhou J. Communication related health crisis on social media: A case of COVID-19 outbreak. Current Issues in Tourism. 2020 doi: 10.1080/13683500.2020.1752632. [ CrossRef ] [ Google Scholar ]
- Zeithaml, V., Berry, L. and Parasuraman, A. (1993). The nature and determinants of customer expectations of service, Journal of the Academy of Marketing Science , 21(Jan), 1‐12.
- Zeithaml V, Parasuraman A, Berry L. Delivering service quality: Balancing customer perceptions and expectations. New York, NY: The Free Press; 1990. [ Google Scholar ]
- Zwanka RJ, Buff C. COVID-19 generation: A conceptual framework of the consumer behavioral shifts to be caused by the COVID-19 Pandemic. Journal of International Consumer Marketing. 2020 doi: 10.1080/08961530.2020.1771646. [ CrossRef ] [ Google Scholar ]
China’s Golden Week Holiday: What’s Driving Outbound Travel
Peden Doma Bhutia , Skift
April 24th, 2024 at 3:30 AM EDT
Understanding what Chinese travelers want is crucial for stakeholders in the tourism industry to tailor offerings and experiences that match these changing preferences.
Peden Doma Bhutia
Destinations in the Middle East are emerging as favorites for China’s upcoming May Day holiday, commonly known as Golden Week.
Overall outbound travel from China during this year’s holiday is still lagging behind 2019 levels by 13%. But travel to the United Arab Emirates (UAE) has surged by 66%, and Turkey has experienced a significant growth of 56%, according to ticket sales data from ForwardKeys.
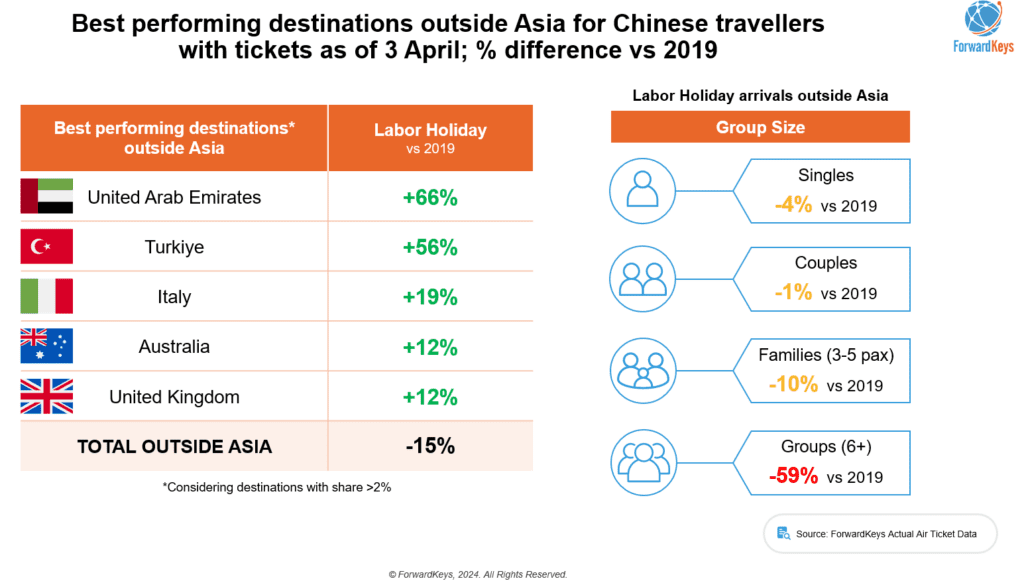
Increased seat capacity from Africa and the Middle East, which is set to expand by 75% in the second quarter, has led to this surge in travel.
Corresponding increases in seat capacity to China have backed the travel growth rates of 56% to Turkey, 19% to Italy, and 12% to the UK.
Last month, Trip.com, China’s biggest online travel agency, announced record bookings in Abu Dhabi, exceeding 57,000 room nights over the past 12 months. From 2022 to 2023, outbound travel orders across all products from Chinese travelers to the UAE surged by more than threefold.
Chinese outbound travel to Middle East had already reached pre-pandemic levels during the Chinese New Year period in February.
Pre-Pandemic Travel Patterns
ForwardKeys anticipates that the May holiday will witness notable travel peaks around April 27 and May 1, closely resembling pre-pandemic travel patterns.
In the Asian region, Malaysia has emerged as the top-performing destination for Chinese travelers, with flight bookings currently 42% ahead of 2019 levels. Because of more lenient visa policies, including visa-free travel to Malaysia and Singapore, and streamlined procedures for South Korea, travel to these destinations is expected to surpass 2019 levels in May.
These findings align with insights from Dragon Trail’s Chinese Traveler Sentiment Report , releasing later on Wednesday. According to the report, visa-free policies, direct flights, and simplified application procedures are also making outbound travel more appealing and accessible.
According to ForwardKeys, a notable shift in passenger profiles is the decrease in group travellers, which has dropped by 53% compared to 2019 levels. In contrast, solo travellers are showing a strong interest in exploring Asian destinations, with a 9% increase.
The Dragon Trail report also highlights growing preference for independent travel among Chinese tourists. Travelers also prefer, semi-self-guided travel and boutique groups of 6-10 people, which offer flexibility and convenience.
Value-Oriented Approach
Along with flexibility and convenience, Chinese travelers are also seeking relaxation and comfort in their trips.
Amidst the challenges posed by the Covid-19 pandemic and China’s economic downturn in 2023, Chinese travelers are prioritizing relaxation and comfort in their trips.
The economic pressures have led to a value-oriented approach to travel planning, with a majority carefully considering their spending to maximize value and opting for affordable travel options.
Around 20% of respondents who said they would not travel outbound in 2024 cite limited income as a barrier. Only a small percentage (11%) are willing to pay a premium for superior products and services.
Most travelers allocate less than 20% of their income for travel, with budgets typically ranging from RMB10,000 to RMB30,000 for upcoming trips.
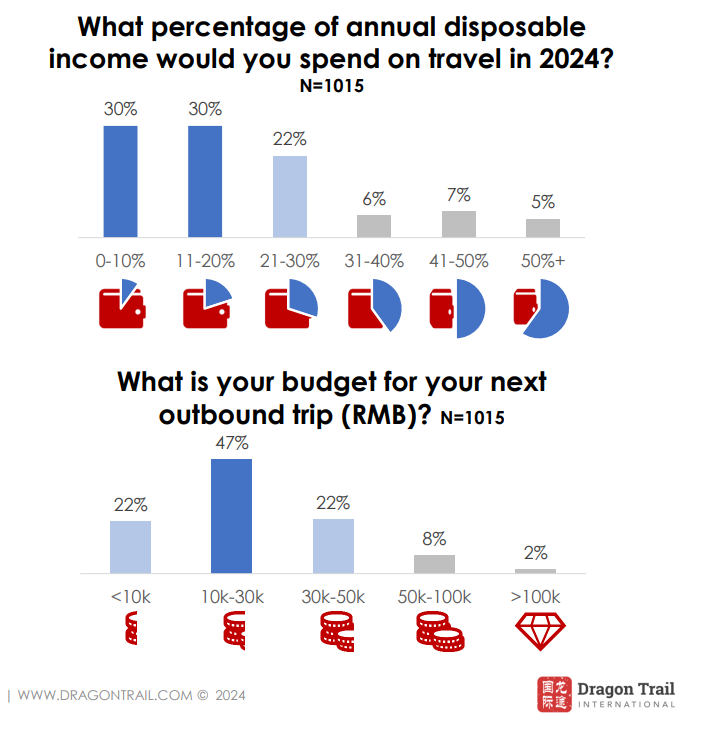
Despite budget-consciousness, shopping remains an integral part of outbound travel, with more than two-thirds of travelers spending a minimum of RMB2,000 (US$276) per trip. Local foods and souvenirs are the primary shopping categories, followed by cosmetics, clothing, shoes and bags.
The Daily Newsletter
Our daily coverage of the global travel industry. Written by editors and analysts from across Skift’s brands.
Have a confidential tip for Skift? Get in touch
Tags: asia monthly , budget travel , china , china outbound , golden week , middle east , shopping , turkey , uae
Photo credit: Overall outbound travel from China during this year's May holiday is 13% behind 2019. Florence Lo / Reuters
Help | Advanced Search
Economics > General Economics
Title: long-term forecasts of statewide travel demand patterns using large-scale mobile phone gps data: a case study of indiana.
Abstract: The growth in availability of large-scale GPS mobility data from mobile devices has the potential to aid traditional travel demand models (TDMs) such as the four-step planning model, but those processing methods are not commonly used in practice. In this study, we show the application of trip generation and trip distribution modeling using GPS data from smartphones in the state of Indiana. This involves extracting trip segments from the data and inferring the phone users' home locations, adjusting for data representativeness, and using a data-driven travel time-based cost function for the trip distribution model. The trip generation and interchange patterns in the state are modeled for 2025, 2035, and 2045. Employment sectors like industry and retail are observed to influence trip making behavior more than other sectors. The travel growth is predicted to be mostly concentrated in the suburban regions, with a small decline in the urban cores. Further, although the majority of the growth in trip flows over the years is expected to come from the corridors between the major urban centers of the state, relative interzonal trip flow growth will likely be uniformly spread throughout the state. We also validate our results with the forecasts of two travel demand models, finding a difference of 5-15% in overall trip counts. Our GPS data-based demand model will contribute towards augmenting the conventional statewide travel demand model developed by the state and regional planning agencies.
Submission history
Access paper:.
- Other Formats
References & Citations
- Google Scholar
- Semantic Scholar
BibTeX formatted citation
Bibliographic and Citation Tools
Code, data and media associated with this article, recommenders and search tools.
- Institution
arXivLabs: experimental projects with community collaborators
arXivLabs is a framework that allows collaborators to develop and share new arXiv features directly on our website.
Both individuals and organizations that work with arXivLabs have embraced and accepted our values of openness, community, excellence, and user data privacy. arXiv is committed to these values and only works with partners that adhere to them.
Have an idea for a project that will add value for arXiv's community? Learn more about arXivLabs .
The 10 Best Travel Umbrellas, Tested & Reviewed
By Claire Volkman

All products featured on Condé Nast Traveler are independently selected by our editors. However, when you buy something through our retail links, we may earn an affiliate commission.
The one thing that I absolutely never forget to pack: a travel umbrella. No matter where I’m going, except for the Wadi Rum or the Sahara Desert maybe, there’s bound to be some inclement weather. Rain, sleet, thunderstorms; no destination is without them. Having an umbrella on hand allows you to keep your travel plans intact, and even see the sights in some places without all the crowds.
However, the task of picking an umbrella is about as daunting as picking a suitcase . With about a million options to choose from and all of them claiming to be “the best travel umbrella,” it’s no wonder so many just pick the cheapest option and go. However, not all umbrellas are created equally—as anyone who has found themselves with one completely inverted during a torrential downpour will tell you. Below, we’ve rounded up the best of the best travel umbrellas, keeping features like durability, wind-resistance, and size in mind.
This article has been updated with new information since its original publish date.
Discover the best travel umbrellas:
- Best overall: Weatherman travel umbrella
- Most compact: Davek The Davek mini
- Best for cities: Amy's Automatic umbrella
- Most affordable: Repel windproof travel umbrella
- Most durable: Blunt Metro umbrella
- Best splurge: Pasotti Tropical umbrella
- Most lightweight: Totes mini manual umbrella
- Best patterns: Rifle Paper Company umbrella
- Most wind-resistant: Davek Elite umbrella
- Most sustainable: Totes recycled canopy umbrella
Best overall travel umbrella

Why we love it : Sturdy, wind-resistant, lightweight, and incredibly compact, the Weatherman travel umbrella is undeniably the best on the market. This umbrella has a serious fanbase, with hundreds of nearly perfect reviews on Amazon. It is surprisingly lightweight, and can easily fit in a carry-on or tote bag . It has an automatic open and close feature, a reinforced fiberglass base, and a water-resistant, Teflon-coated fabric. Plus, it shields winds up to 45 MPH and is tough enough to withstand even the heaviest of rainfall.
Worth noting : There aren’t many things to complain about this umbrella, however, it is a bit pricey coming in at $69. However, with a lifetime warranty, it’s well worth the splurge.
Dimensions: Open diameter: 38"; Closed length: 12" Weight: 0.85 oz. Carrying sleeve included: Yes
Most compact

Why we love it: When they say mini, they mean mini. The Davek Mini is so small and compact that it fits in the palm of your hand. Measuring less than 7 inches when closed, you can easily stash this umbrella in your carry-on, backpack , or even a jacket pocket. Plus, it weighs less than a pound, making it almost unnoticeable when not in use. Made from reinforced fiberglass, it also comes in 10 bright colors so you can coordinate your umbrella with the rest of your outfit.
Worth noting: Because of its size, the canopy doesn’t provide overwhelming coverage. Additionally, it’s not built for extreme storms and functions best in light showers.
Dimensions : Open diameter: 38"; Closed length: 7"
Weight : 0.8 oz.
Carrying sleeve included : Yes
Best for cities

Why we love it : With a sleek and stylish small wooden or plastic handle, this lightweight umbrella features a wind-defying 8-rib canopy that’s also UPF 50+ certified, meaning it provides adequate sun protection, too. Small enough to walk down the busy streets of Chicago during a rainstorm without the awkward “bump and sideswipe,” it fits easily in a work tote, briefcase, or backpack. Plus, it features an automatic open and close, and comes in over a dozen bright and bold patterns and colorways, making it easy to stand out in a sea of black and blue canopies. It also comes with a five-year global warranty and is pretty affordable at only $40.
Worth noting: It’s small enough to fit in your hand, which means the canopy doesn’t offer premium protection in heavy rainstorms.
Dimensions : Open diameter: 38.1"; Closed length: 21.6"
Weight : 0.76 oz.
Most affordable

Why we love it : You can’t go wrong with this incredibly durable, lightweight, and affordable Repel travel umbrella. With over 36,000 4.5-star Amazon reviews, this is an overwhelming crowd favorite among travelers, worker bees, families, and everyone in between. I tested the durability during a heavy summer rainstorm in Chicago, and it stood up surprisingly well thanks to its 9-rib canopy, heavy-duty Teflon-coated fabric, and non-slip rubber grip. Plus, the automatic open and close feature makes it super easy to go in and out of buildings and restaurants without getting soaked or stuck. Another thing to note was how well it stood up to Chicago’s infamous winds—not bending, flipping, or even flapping during big gusts. The best part? It’s only $27 on Amazon and comes in 10 colors.
Worth noting: We didn’t find any problems with the umbrella, but some reviewers found that it didn’t stand up to heavier winds and isn't as lightweight as other comparable brands.
Dimensions : Open diameter: 42"; Closed length: 11.5"
Weight : 0.93 oz.
Carrying sleeve included : No
Most durable

Why we love it : This heavy-duty umbrella stands up to even the strongest rainstorms, and offers supreme coverage thanks to its patented wind-tip rounded edges, which work like mini umbrellas. It’s also built with a 360-degree spinning canopy which prevents it from breaking when dropped or knocked over. It’s extremely wind-resistant and has been tested to withstand the winds and rains of a category one hurricane. It’s also made from rip-resistant pongee fabric that is also super quick to dry, so you can easily go back indoors without needing a plastic cover.
Worth noting: This umbrella only features six ribs, which means it's smaller than Blunt’s other umbrellas.
Dimensions : Open diameter: 39"; Closed length: 15"
Weight : 0.85 oz.
Best splurge
.jpg "tourist patterns")
Why we love it : If looking chic is just as important as staying dry, this is the umbrella for you. Handcrafted by Italian umbrella maker Pasotti, the canopy will stop people in their tracks—with a beautiful tropical pattern in sage, gold, and dark green. When I was walking in downtown Chicago, I had four people stop to ask me about this umbrella (and then a few ask to buy it from me). Although I originally gravitated to this umbrella for its looks, the functionality is why it’s my absolute go-to. The canopy extends 102 centimeters and has a 93 centimeter shaft, meaning I’m not going to get pelted by rain when it’s windy (which is everyday in Chicago).
Worth noting: At $275, this is by far the most expensive on the list.
Dimensions : Open diameter: 40"
Most lightweight
.jpg "tourist patterns")
Why we love it : They weren’t kidding when they said this is one of the most lightweight umbrellas on the market, weighing only 8 ounces. Small enough to fit into most purses , carry-ons, totes, and computer bags, this umbrella doesn’t take up any more space than it needs too. One drawback with the size is that you need to activate the canopy manually (no quick release button). However, the handle is sturdy and the canopy provides ample coverage for most light-to-moderate rain storms. I love the fact that it comes in multiple colors and patterns, and the price makes it easy to stock up on a few (only $25 at Amazon).
Worth noting: Due to the size, it’s not super wind-resistant and wouldn’t be a great pick if you’re facing a heavy downpour or storm.
Dimensions : Open diameter: 43"; Closed length: 11.2"
Weight : 7.8 ounces
Best patterns

Why we love it : If you’re someone who buys a bottle of wine based on the label, these umbrellas are for you. Known for its bold, whimsical, and delicate patterns and floral designs, Rifle Paper Company’s umbrellas are true works of art. Each umbrella also features a sleek wooden handle and an automatic open/close feature.
Worth noting: This is not the umbrella to buy if you’re looking for durability, extreme wind resistance, or more bells and whistles. This basic umbrella provides decent coverage in light rain, but isn’t meant for heavy winds or downpours.
Dimensions : Open diameter: 43"; Closed length: 11"
Most wind-resistant

Why we love it : There’s a reason 81 people have given this umbrella a nearly perfect rating on Amazon—it actually holds up. Sure, it may be a splurge at $159, but it is well worth the price tag when you see how it holds up. Surprisingly compact, the canopy extends 50 inches, giving you extreme protection against even heavy rains. Plus, it’s small enough to fit in a carry-on, backpack, or large tote bag. The fabric is 201-thread count, making it luxurious to touch but also extremely powerful against rain. The best feature is the wind-tension frame system, which can withstand heavy winds and prevent inversion. We tested this against a very blustery 55 MPH wind day in Chicago, and there was barely any flapping or movement at all from the tough canopy.
Worth noting: It’s expensive, but comes with a lifetime warranty and replacement guarantee.
Dimensions : Open diameter: 50"; Closed length: 35"
Weight : 1 lb.
Most sustainable

Why we love it : Shopping sustainably is more important now than ever, and that extends to umbrellas, too. Tote’s recycled umbrella is made from 100 percent Recycled PET plastics, equating to about 7.5 recycled water bottles per umbrella. The handle and strap are also made from all renewable resources, like bamboo and hemp, and the production process uses less water overall. In terms of coverage, the Pet umbrella features Tote’s patented NeverWet invisible coating allowing the rain to drip off the umbrella 4 percent faster, leaving you with a drier umbrella once indoors.
Worth noting: Its compact design makes it easy to travel with, however, doesn’t provide a ton of additional coverage beyond your person.
Dimensions : Open diameter: 43"; Closed length: 11.5"
Weight : 1.15 lbs.
- Latest News
- North & East
- Environment
- International
- Social Love
- Horse Racing
- World Champs
- Commonwealth Games
- FIFA World Cup 2022
- Art & Culture
- Tuesday Style
- Food Awards
- JOL Takes Style Out
- Design Week JA
- Black Friday
- Relationships
- Motor Vehicles
- Place an Ad
- Jobs & Careers
- Study Centre
- Jnr Study Centre
- Supplements
- Entertainment
- Career & Education
- Classifieds
- Design Week
Mastercard exec pitches potential tourism markets for Jamaica
Uses data to map consumer income and spending patterns.
J amaican-born director at the Mastercard Economics Institute Roiana Reid said that she would readily recommend potential tourism markets that the Jamaica Tourist Board should target based on data gathered about the spending habits and the income levels of credit and debit card users across several jurisdictions across the world.
Reid made this bold statement during her recent presentation, “Unlocking Growth: Understanding the Global Consumer and Navigating Travel Trends”, at Mastercard Day Jamaica, during which Mastercard highlighted its capacity to track tourism spend across the world and go deeper into identifying the spending power of people in specific regions.
Speaking at the event, Reid pointed out that unemployment is at its lowest in the US, Canada, the United Kingdom, and Germany — some of Jamaica’s largest tourism markets. Comparing the growth of wages in these jurisdictions to inflation, she then highlighted the spending power of those who travel.
“Broadly speaking, across these economies wage growth is outpacing inflation. That means that consumers have more real purchasing power, giving them opportunities to spend more on discretionary goods and services which, of course, includes travel and entertainment,” she shared.
Drilling down on Jamaica’s leading tourism market, the United States, Reid noted that states such as Montana, Nevada, Arizona, Texas, Florida, Georgia, and the Carolinas have experienced strong growth in salaries and consumer spending over the last five years. This she attributed to migration patterns that favour people moving to the warmer southern states.
“So, if I were on the Jamaica Tourist Board, I’d recommend that we market more in these states because there are real opportunities for growth to capture these consumers which are doing really, really well,” she asserted.
Texas, Reid indicated, was one of the states to watch since most sectors experienced employment and income growth higher than the US average.
Last year in the US, spending on air travel, cruises and accommodations rose by 19.8 per cent when compared to pre-COVID levels. In terms of discretionary spending, travel-related expenses ranked as third-highest in payments, just behind ticket purchases for movies and/or live events and paid sporting events.
Moreover, in a survey of consumers, 22 per cent of respondents indicated plans to take a foreign trip in the next six months.
“Before the pandemic, we never had this much share and we’re literally at 45-year highs in terms of the share of responders who plan to travel abroad within the next six months,” Reid highlighted.
What’s more, as Jamaica continues to rank among the top-five destination for American and Canadian tourists, inbound cross-border spend last year rose by 20 per cent on account of an increase in spend on experiences. The top-three payment categories among travellers from the US and UK were: accommodation, food and vehicle rentals.
Payments for hotel services alone rose 48 per cent in 2023.
While dissecting purchases using corporate cards as against consumer cards, Reid shared that she believes there is space for tourism stakeholders to boost corporate card spend through business conferences, retreats and hosting remote employees.
In Jamaica, parishes seeing the largest share of card spending were: St James, Kingston and St Andrew, St Ann, Westmoreland, Trelawny, and Hanover.
Prior to COVID, tourists spent on average six days at destinations compared to 10 days during the pandemic due to quarantines. Since 2022, travellers from Jamaica’s main tourism markets spend on average eight days.
HOUSE RULES
- We welcome reader comments on the top stories of the day. Some comments may be republished on the website or in the newspaper; email addresses will not be published.
- Please understand that comments are moderated and it is not always possible to publish all that have been submitted. We will, however, try to publish comments that are representative of all received.
- We ask that comments are civil and free of libellous or hateful material. Also please stick to the topic under discussion.
- Please do not write in block capitals since this makes your comment hard to read.
- Please don't use the comments to advertise. However, our advertising department can be more than accommodating if emailed: [email protected] .
- If readers wish to report offensive comments, suggest a correction or share a story then please email: [email protected] .
- Lastly, read our Terms and Conditions and Privacy Policy
- Privacy Policy
- Editorial Code of Conduct
IMAGES
VIDEO
COMMENTS
This first entails dismantling existing tourism destination borders, and, second, redefining tourism destinations in a way that takes tourists' visitation patterns into account. The study thus focuses on aggregate travel patterns within a destination to find systems of tourism attractions usually visited together.
Tourism has been recognized in Goals 8, 12 and 14, for its capacity to contribute to achieving the SDGs, namely by fostering economic growth, creating jobs, promoting local culture and accelerating the change to more sustainable consumption and production patterns.) 4 among others underscoring the integral role of tourism in our societies. 1
Researchers from the MIT Senseable City Lab have uncovered a new travel pattern in human mobility that remains consistent across four continents, reports Beck Ferreira for Motherboard.. "The notion that distance and frequency of visitation are related is in accordance with intuition," the researchers explain.
Studies on lifelong travel patterns have concluded that a greater use of cohort analysis is needed to examine changes in travel behaviour (Oppermann, 1995). Gardiner et al. indicate that future travel behaviour will differ between the generations. Therefore, there is an implied necessity for continuous studies and research on each generation in ...
Five basic spatial patterns, including single destination pattern, en-route pattern, base camp pattern, regional tour pattern and trip-chaining pattern were identified by Lue, Crompton, and Fesenmaier (LCF) model for understanding the movement of tourists within a destination (Lue et al. 1993 ). Lew and McKercher ( 2006) also identified three ...
In order to fill this gap, the main aim of the present study is to identify tourism destination boundaries based on tourists' travel patterns during their stay at the destination. This first entails dismantling existing tourism destination borders, and, second, redefining tourism destinations in a way that takes tourists' visitation patterns ...
The study results showed that tourism demand increased significantly from 2011 to 2018, the spatial clustering pattern of tourism demand was not randomly distributed (Fig. 5); there were two types ...
Her research topic is about tourist movement patterns by using Geographic Information System. Bob McKercher is Professor in the School of Hotel and Tourism Management, The Hong Kong Polytechnic University. He has published widely on tourist behavior and spatial movement patterns. Cite article
Four patterns were identi the World Tourism Organisation (WTO), is the fied: 'direct route'> Part:lal °rbit', 'fell orbit' and 'focal point in the delivery of tourism products fly-drive pattern. Lue et al. (1993) conceptualised and the implementation of tourism policy' five different patterns for pleasure vacation trips (WTO, 2002).
This paper aims to investigate the changes in travel patterns and tourist behavior due to the COVID-19 outbreak. This study realizes these changes and reports them to help restore tourism.,This applied study used library sources and a survey conducted through an online questionnaire. The questionnaire incorporated data from previous studies and ...
Analytic work on travel behavior can be dated from Liepmann (1945). Liepmann obtained and analyzed 1930s data on worker travel in England. Many of the insights current today were found by Liepmann: time spent, ride sharing, etc. Most academics date modern work from advances in mode choice analysis made in the 1970s.
Instead, they addressed sustainable development or sustainable tourism from various behavioral areas (e.g., general tourist behavioral patterns, the influence of tourism on animals' behavior, resident behavior, business behavior). Following the elimination of irrelevant studies, 331 articles were downloaded for further analysis.
Understanding travel patterns and geospatial analysis. Travel patterns denote people's movement or travel flow from one place (or tourism attraction) to another. One well-known approach to analyzing travel patterns is to show flows on the basis of an origin-destination matrix (Hwang & Fesenmaier, 2003).
This study aims to offer insights into a sounder understanding of tourist behavior and travel patterns by systematically identifying psychological manifestations reflected in the basic human value system in the pandemic-induced environment.,A large random sample (49,519 respondents from 29 European countries), generated from the core module ...
Patterns - TouristBuy the 'Patterns' EP on iTunes (UK): http://po.st/Patterns Buy the 'Patterns' EP on iTunes (US/Canada): digital - http://smarturl.it/Tour...
Various patterns from the multidestination model (Lue et al., 1993) are exercised and the en-route and base-camp are the best-fit pattern based on travel time, travel distance, and tourist dispersion.
The study of travel patterns is combining the purpose of visit, the order to visited destination, and the reason for the trip decision (Vu et al., 2020) than modeling multi-destination travel is a ...
The new patterns really emerge when comparing international travel trends to 2019. For example, Central America received 50% more U.S. visitors in March 2024 compared with March 2019.
The paper examines, by way of general discussion and the use of specific examples, the role of the different forms of media in shaping international travel patterns. The paper discusses the links between literature and the establishment of 19th and early 20th Century tourist destinations in determining a pattern still prevalent today.
If accurately planned and incentivized, with both public and private support, this contingent variance on the tourism pattern may represent a durable response to the over-tourism phenomenon (Goodwin 2017; Koens et al. 2018; Milano et al. 2018), affecting many Italian cities (the case of Venice, Seraphin et al. 2018), while in the meantime less ...
Tourist Behaviour and Trends 125. behaviours, and tourists differ according to nationality, culture, social. class, travel experience, etc. It is also important for profes sionals to review ...
Understanding tourist movement patterns is important for the development of sustainable tourism practices in cultural heritage destinations, as it can help to identify attractions of high tourist impact and inform the development of strategies to mitigate the negative impacts on site preservation and management. Madaba is one of the largest ...
Pre-Pandemic Travel Patterns. ForwardKeys anticipates that the May holiday will witness notable travel peaks around April 27 and May 1, closely resembling pre-pandemic travel patterns.
There is a lack of research on quantifying tourist mobility patterns at scale, and therefore, a limited understanding of tourist space-time behaviors in cities. The past decade has witnessed an increasing adoption of mobile phone data for studying human activities and social dynamics ( Blondel, Decuyper, & Krings, 2015 ).
The trip generation and interchange patterns in the state are modeled for 2025, 2035, and 2045. Employment sectors like industry and retail are observed to influence trip making behavior more than other sectors. The travel growth is predicted to be mostly concentrated in the suburban regions, with a small decline in the urban cores.
The Hong Kong Monetary Authority's SME information platform is part of its ongoing efforts to help SMEs affected by the shift in consumer and tourist spending patterns.
Worth noting: Its compact design makes it easy to travel with, however, doesn't provide a ton of additional coverage beyond your person. Dimensions : Open diameter: 43"; Closed length: 11.5 ...
Jamaican-born director at the Mastercard Economics Institute Roiana Reid said that she would readily recommend potential tourism markets that the Jamaica Tourist Board should target based on data ...
Understanding travel patterns is helpful for decision-makers to draw insights from consumers' perspectives. This work took advantage of social media and analysed tourists' travel patterns from the length of itineraries and duration of stay. Using Chinese tourists in Australia as a case study, results showed that most visitors prefer to stay in ...
A year's worth of rain unleashed immense flash flooding in Dubai Tuesday as roads turned into rivers and rushing water inundated homes and businesses. Shocking video showed the tarmac of Dubai ...