

Data point: the rise of the sustainable tourist
Travellers want greener holidays in a post-pandemic world

Family reunions, holiday hikes with friends, trips to enjoy beach-side sunsets—for two years covid-19 made these types of excursions almost impossible. But as travel restrictions have lifted, holiday bookings have returned, with some numbers surpassing 2019 levels.
This post-pandemic holidaying boom is welcome. Tourism is one of the world’s largest industries, employing around one in 10 people globally , with some countries’ GDP—notably island nations such as the Maldives, the Bahamas and Aruba—almost entirely dependent on tourism. But in the context of the climate emergency whose impacts are being felt across the world, many are trying to travel in ways that are not just enjoyable but also environmentally and socially ethical.

Seeking sun, sand and sustainability
According to a recent report from Booking.com, 61% of survey respondents say the pandemic has made them want to travel more sustainably in the future, based on a desire to make positive changes in their lives more generally, such as reducing food waste and single-use plastics . There have been significant changes in people’s views on how they want to travel now, with 79% wanting to move around in a more environmentally friendly way while they’re on holiday, such as walking and cycling more, or using public transport rather than taxis and rental cars.
In recent years we’ve seen a shift in what tourism companies are offering in terms of their climate commitments, from holidays prioritising conservation and investing in local communities, to plastic waste reduction initiatives . But the push is also coming from travellers themselves; 76% want to reduce their personal water usage when they are on holiday and staying in hotels or B&Bs, for instance by reusing towels or opting out of daily room cleaning. As many as 84% wish to reduce general waste, with 46% feeling most concerned about the excess waste they are creating, such as plastics, while they travel.
The biggest elephant in the room when it comes to sustainable travel is flying, as around 2% of global carbon emissions come from the aviation industry.
To fly or not to fly?
The biggest elephant in the room when it comes to sustainable travel is flying, as around 2% of global carbon emissions come from the aviation industry. This is a growing concern for holiday-makers, as 69% say they are committed to reducing the carbon footprint of their trip or paying to offset their travel whenever possible. Offsetting can only ever be part of the solution, however. Many believe the onus of sustainability should be on the producer, not the consumer—such as implementing greater fuel taxes, investing in greener fuels, and supporting the development of energy-efficient aviation technology.
Holiday travel should also be considered in the context of the bigger picture of aeroplane travel in general. The carbon footprint of a person on a packed commercial airline who takes one round-trip holiday flight a year is significantly less than those who use private jets like a regular car service. As with almost everything to do with the climate crisis, it’s a tiny minority that is causing challenges for the majority: just 1% of flyers are responsible for more than 50% of global aviation emissions.
Sign up to our newsletter
Our partnership with Infosys
Resilience & Adaption
Circular Economies
Ecosystems & Resources
Social Sustainability
Coming soon
Perspectives
Terms of use
Privacy policy
Accessibility
Cookies policy
Manage Cookies
Modern Slavery Statement
Do Not Sell My Personal Information
Copyright © The Economist Newspaper Limited 2023. All rights reserved.
- Regular article
- Open access
- Published: 18 July 2022
Measuring sustainable tourism with online platform data
- Felix J. Hoffmann 1 ,
- Fabian Braesemann ORCID: orcid.org/0000-0002-7671-1920 2 , 3 &
- Timm Teubner ORCID: orcid.org/0000-0002-5927-3770 1
EPJ Data Science volume 11 , Article number: 41 ( 2022 ) Cite this article
6070 Accesses
9 Citations
9 Altmetric
Metrics details
Sustainability in tourism is a topic of global relevance, finding multiple mentions in the United Nations Sustainable Development Goals. The complex task of balancing tourism’s economic, environmental, and social effects requires detailed and up-to-date data. This paper investigates whether online platform data can be employed as an alternative data source in sustainable tourism statistics. Using a web-scraped dataset from a large online tourism platform, a sustainability label for accommodations can be predicted reasonably well with machine learning techniques. The algorithmic prediction of accommodations’ sustainability using online data can provide a cost-effective and accurate measure that allows to track developments of tourism sustainability across the globe with high spatial and temporal granularity.
1 Introduction
The tourism industry is of tremendous economic relevance, accounting for an estimated 10% of global GDP in the years before the Covid-19 pandemic [ 1 ]. Though strongly affected by restrictions and other uncertainties in international travel, the sector is expected to resume growth and fully recover throughout the coming years [ 2 ]. Tourism is also of high importance for economic development, which is underlined by its inclusion in the United Nations’ Sustainable Development Goals (SDGs), where it is directly mentioned in three of the 17 goals [ 3 ]. Between 2008 and 2018, the relative importance of tourism for the respective country’s GDP increased in 43 out of 70 countries that report to the UN [ 4 ]. At the same time, it has been criticized to have adverse environmental and social effects [ 5 ], causing 8% of the global carbon emissions in 2013 [ 6 ]. To balance the economic, environmental, and social impacts of tourism, the relevance of sustainable tourism becomes evident [ 7 ]. In order to monitor and manage tourism in view of sustainability, granular and accurate spatio-temporal data is needed. There is a growing number of indicator frameworks for the tourism sector that aim to measure sustainability, with the majority of successfully implemented projects focusing on the European market. Current data collection methods, however, are often costly and yield piecemeal results. Ideally, improvements would allow for a cost-efficient implementation in both high income and developing countries, where tourism is growing faster than in more mature markets [ 8 ]. In the past, data collection could often be improved by means of tapping into alternative data sources. Examples include the assessment of the digital gender gap based on social network data or the assessment of poverty using mobile phone records [ 9 , 10 ]. Besides lowering the cost of data collection, such approaches allow for the calculation of indicators in near real-time, rather than relying on year-long cycles.
The present paper expands on such approaches by exploring the feasibility of using online platform data to assess the sustainability of tourism throughout Europe. Specifically, we pose the following research question:
Research Question : Can statistical learning techniques using data from an online tourism platform predict tourist accommodations as sustainable, as indicated by a sustainability label?
We use a machine learning approach on online platform data alone to answer the research question. Thus, our study is different from others that discuss rule-based classification systems used by traditional sustainability labels. These labels require detailed information about waste, water use, and other factors to determine an accommodations’ level of sustainability. While highly accurate and true to the causal relationships of sustainability, the corresponding data collection procedures are expensive and not feasible quickly at scale. The classifiers introduced below rely on correlated but not necessarily causal factors. They can hence not fully replace the physical measurement of factors determining sustainability. Instead, the models’ wide applicability and low cost of calculation can serve to complement existing labels, allow for nowcasting of sustainability indicators, and increase the geographical coverage of such indicators.
The analysis is based on a unique dataset of TripAdvisor.com accommodations and the platform’s GreenLeader award. We contribute to the literature in two ways. First, we identify and outline systematic differences between award-holding and non-holding accommodations using public platform data. Secondly, making use of supervised machine learning techniques, we identify sustainable accommodations with reasonable accuracy also in regions that have not implemented the platform’s GreenLeader award. In doing so, we show that large-scale monitoring of sustainable tourism using online platform data in near real-time is feasible. The approach presented here provides a cost-effective and accurate measure with high spatial and temporal granularity, which could be rolled out to track sustainable tourism across the globe.
The remainder of the paper is structured as follows. Section 2 provides an overview of related work and past projects making use of alternative data sources for development statistics in general, and for the assessment of sustainable tourism in particular. Following this, Sect. 3 introduces our methodology, the data set, as well as criteria for model evaluation. Next, Sect. 4 presents our results. In Sect. 5 , we then discuss our findings in view of practical and theoretical implications and conclude the paper with limitations and suggestions for further research.
2 Background and related work
2.1 measuring sustainability in tourism.
The majority of current sustainability practices in tourism result from regulation and economic incentives rather than intrinsic motivation [ 11 ]. Accordingly, policy makers need to define and monitor sustainability in tourism to achieve change. A number of frameworks aim to supply this information by means of indicators (which represent a core element of development research and a central pillar of the SDGs). Next to the UN’s SDGs, tourism-specific indicators were devised by, among others, the World Tourism Organization (UNWTO), Footnote 1 the Global Sustainable Tourism Council (GSTC), Footnote 2 the European Commission, Footnote 3 and the European Environmental Agency (EEA). Footnote 4 Tourism finds direct mention in Goal 8 (‘Decent work and economic growth’), Goal 12 (‘Responsible consumption and production’), and Goal 14 (‘Life below water’) [ 3 ]. Note that the use of indicators for the measurement of sustainability in tourism dates back almost three decades, when the World Tourism Organization began to promote their use for policy-making and destination management [ 12 ]. Today, the Global Sustainable Tourism Council sets a widely used and accepted standard for sustainability of private companies in tourism based on performance indicators [ 13 ]. Moreover, the European Commission first published its ‘European Tourism Indicator System’ (ETIS) in 2013 (with several revisions in the subsequent years). Building on 27 core and 40 optional indicators, ETIS provides the most detailed approach to measure sustainable tourism [ 14 ]. At the same time, the EEA has developed a ‘Tourism and Environment Reporting Mechanism’ (TOUERM), monitoring the environmental impact of tourism similar to other industries. Note that the nine TOUERM indicators are similar/overlapping with those of the ETIS framework.
2.2 Sustainability labels
While the aforementioned indicators are mostly geared towards policy making, sustainability labels also serve as a source of information for consumers. Naturally, these labels can also be used to gather information about the state of sustainability in a region or country. Sustainability labels are deemed a suitable means to facilitate ecological progress, especially with regard to clean water and energy, sustainable consumption, and climate protection [ 11 ]. Consequently, such labels are considered both by the ETIS and TOUERM frameworks. ETIS indicator A.2.1 can thus be used to gather information relevant for policymakers while relying on third parties’ assessments. It is important to note that there is great variety of sustainability labels, oftentimes leaving consumers left to wonder about their exact meaning, the applied standards, as well as their credibility in view of control mechanisms and enforcement [ 15 ].
Beyond institutional labels such as the EU Ecolabel (introduced by the European Commission to highlight low waste, energy efficiency and other sustainability factors [ 16 ], online platforms have introduced indicative labels as well. TripAdvisor’s GreenLeader award, for instance, was introduced in the US in 2013 and has been consistently expanded to other countries. Touristic accommodations interested in the award can apply through a questionnaire and must fulfil several standards to become a ‘GreenLeader’. These standards include, among others, towel re-use, recycling, and green roofing [ 17 ]. While institutional labels inherit credibility from the sponsoring institution, it is worth taking a closer look at the GreenLeader scheme: The award was devised in cooperation with the UN Environment Programme and has been critically acclaimed. The German Consumer Association highlights its high standards, independence, and transparency. The potential for widespread application stemming from TripAdvisor’s global presence makes the label a useful point of reference. Award-holding listings are decorated with a visual label on TripAdvisor, incentivising accommodations to apply [ 18 ].
2.3 Problems of sustainable tourism indicators
The compilation of indicators for sustainable tourism comes with several difficulties, as outlined in the European Tourism Indicator System (ETIS). While some of the data used in the ETIS is readily available from national statistics offices, it is complemented by additional data from surveys and other sources. Rasoolimanesh et al. (2020), for example, reviewed and assessed 97 academic studies on sustainable tourism in terms of relevance for the SDGs, related governance, stakeholders, and the subjectivity of the indicators [ 7 ]. Governance-related indicators were found in less than a quarter of all studies, stressing the importance of strong institutions to push evidence-based decision making. Another identified problem is access to and accuracy of data, which play an important role for implementing robust and evidence-based indicators. The European Commission is aware of the time and cost intensity of this approach and suggests not to collect annual data for all indicators, but rather to rely on three-year cycles [ 14 ].
Moreover, data reliability is an issue. Modica et al. (2018) asses the initial implementation of the ETIS in the Sardinian region of Cagliari and found that up to 52% of indicator data was missing [ 19 ]. Such issues and questions regarding definitions and measurability have, for example, led to the abandonment of indicator 8.9.2 (‘Proportion of jobs in sustainable tourism out of total tourism jobs’) from the Sustainable Development Goals framework [ 20 ]. These issues in data collection exist despite high-quality census data and experienced institutions and researchers in the OECD countries. Moreover, there are only few studies on sustainable tourism indicators outside Europe and North America [ 7 ]. This means that the data gap on sustainable tourism is increasing, as tourism industries in the Middle East, North Africa, South Asia, and South-East Asia are growing faster than those in Europe and North America [ 2 ]. Scholars in development studies suggest yearly or even quarterly reporting of data instead of relying on multiple-year resolution [ 21 ]. With traditional methods of data collection, however, this goal seems unattainable.
2.4 Sustainable tourism indicators and online data
To overcome such limitations, online data, which is often created as a byproduct of digital business operations, may complement existing data sources. For example, search engines’ primary function is not the accumulation of popular search terms and their development over time, but this byproduct offers valuable insights for areas such as disease control [ 22 , 23 ], unemployment statistics [ 24 , 25 ], or sales forecasting [ 26 ].
Through utilizing the above-mentioned strengths and under careful consideration of the associated risks, the use of big data from online sources can increase the quality of existing development evaluations and allow for assessing previously unmeasured outcomes [ 27 ]. To better understand how different research approaches aim to achieve this goal, an overview of research facilitating methods of online data collection and analysis in tourism research and related phenomena is presented in Table 1 .
For example, GPS trackers and mobile phone applications can be employed to identify patterns of tourist movements in great detail. In combination with app data, Buning and Lulla (2020) were able to differentiate rental bike use between local users and tourists [ 28 ]. Furthermore, segments of tourists that are likely to use specific trails and visit at peak times could be identified via matching app-generated location and demographic survey data [ 29 ]. Big data can also help for improved touristic capacity management. For instance, tourist flights, overnight stays, and sightseeing crowds can be analyzed and forecasted using big data. This also holds for air passenger demand based on flight price search/comparison websites [ 30 ], as well as for the nights spent at certain destinations by tourists with high spatial resolution [ 31 ]. Using booking and travel platform data, the density of touristic stays could be estimated for the area of the European Union and Great Britain [ 32 ]. Similarly, the number of Airbnb offers per tract in the United States could be calculated [ 33 ]. At the level of single touristic sights, visitor flows to World Heritage sites were successfully estimated using Instagram posts [ 34 ]. Focusing on the quality of businesses, geographic clusters of similarly rated restaurants and bars were determined using Yelp review data [ 35 ].
Furthermore, text sources such as online customer reviews offer the possibility to analyze tourists’ concerns and preferences in real-time. For example, attributes that are important to environmentally aware tourists have been identified using text mining techniques on Airbnb comments [ 36 ]. The presence and depth of environmental discourses can be assessed based on booking and travel platform data [ 37 ]. TripAdvisor comments, in particular, have been used to understand sustainable practices introduced by accommodations [ 38 ]. Twitter data has been used to assess the attractiveness of popular touristic sites [ 39 ]. Advanced analytics can also be applied to traditional data sources, for instance, to assess a destination’s potential for ecotourism using artificial neural networks [ 40 ].
In addition, online data has found application in the measurement and nowcasting of several other phenomena. For example, Twitter data has been used to assess damages after earthquakes [ 41 ]. The estimated size of Facebook ad audiences was used to calculate a wealth index at high spatial granularity [ 42 ]. Professional social network data was used to estimate gender gaps within industries and seniority levels [ 43 ]. Lastly, the effect of the Covid-19 pandemic on the property sector was estimated using property listing website data [ 44 ].
3 Methodology
Having reviewed the literature on approaches to measure sustainable tourism, we now introduce the methodology used for the algorithmic identification of GreenLeader accommodations based on publicly displayed data from TripAdvisor.
After establishing the methodological steps of the analysis in the following paragraphs, we investigate the research question whether statistical learning algorithms are able to reveal systematic differences between online profiles of sustainable and non-sustainable accommodations that allow for predicting the existence of a sustainability label.
3.1 Data collection
Data collection took place in November and December of 2020 via web-scraping. For each of the countries included in the analysis, links to all cities with TripAdvisor listings were extracted from the starting page. To obtain direct links to all listings, the algorithm looped through the city URLs and searched for hotel listings in each city. Using this approach, we collected a total of 260,348 individual accommodation listings from 37 European countries. These include all 27 EU member states as well as England, Northern Ireland, Scotland, Wales, Iceland, Liechtenstein, Monaco, Norway, San Marino, and Switzerland.
TripAdvisor provides a broad range of information about accommodations. There are three main sources of data: Page owners (i. e., the accommodation’s operators), consumers, and other/external websites. Next to basic information such as an accommodation’s name and location, page owners can detail their hotel’s size and class, provide contact information, and publish room features and property amenities. Consumers can rate the accommodation on several quality metrics and give an overall rating. They can further provide written reviews, comments, questions, tips, or upload photos. TripAdvisor supplements this information in two ways. First, the website incorporates information from other webpages (e. g., average prices from other websites such as Booking.com and Opodo ). The platform further calculates a score for the accommodation’s location in the city and counts the number of close-by restaurants and attractions using geographic data from Google. Secondly, TripAdvisor accumulates and publishes background data of commentators such as their chosen language as well as trip times and durations. In addition, the website uses customer feedback to create an accommodation ranking within each city.
From the individual listings’ web pages, we collected a total of 102 features, covering five categories of data: the hotel description, its class and ratings (a), prices and information about the size (b), scores calculated by TripAdvisor about the hotel and its location (c), measures of customer interaction (d), and hotel amenities (e).
These features comprise all readily available numeric variables of a listing as well as its binary and ordinal labels. Of the collected information, 15 features relate to hotel description and ratings (a), six variables inform about price segment and hotel size (b), three features relate to location (c). In addition, customer interaction (d) is included through 16 variables for text and image interactions (reviews, uploaded photos). Please note that these variables refer to the amount of user interaction (i. e. number of photos uploaded, number of reviews). The content of photos or reviews is not analyzed. Finally, 62 features inform about the availability of specific amenities and hotel features (e). A detailed summary and description of all variables is provided in Additional file 1 sections I and II.
After splitting the dataset into observations stemming from countries using the TripAdvisor GreenLeader award and those without, 215,806 labelled listings remain available for classifier training. Of these observations, almost 30% have complete information about all variables of interest; 70% have at least one missing value. The variables with most missing values are hotel class (49% missing), TripAdvisor-generated location scores (34% missing) and the number of available rooms (26% missing). The amount of missing data for these variables is critically large – imputation of missing data is not possible here. To make sure not to introduce any bias due to imputation, we therefore exclude all observations with missing values. This leaves 65,515 complete and labelled observations for model training. Comparisons between the full data set (including missing values) and the final data set are provided in Additional file 1 section III. Furthermore, we excluded four observations that contained erroneous records on the number of rooms available (for details, see Additional file 1 section IV).
3.2 Data processing
We undertook several steps of data pre-processing before further analysis. Some variables had to be transformed to deal with skewness. This allowed for the selection and final application of transformations offering the greatest improvement in classifier performance. As dependent variable, we focus on the TripAdvisor GreenLeader Award as a (binary) proxy for an accommodation’s sustainability. A detailed account of all variables’ distributions is provided in Additional file 1 section V.
3.3 Classification
As the next step, we set out to distinguish sustainable and non-sustainable accommodations. To do so, we employ a grid search of preparatory methods and algorithms to find the models with best predictive performance. In total, we ran 360 models based on 3 dimensionality reduction techniques × 5 resampling approaches × 6 data transformations × 4 classifiers. The models are evaluated using three metrics suitable for imbalanced classification tasks. In the following, the components of the analyzed modelling processes and the applied classification metrics are listed. This allows for an understanding of the grid of methods used. A more detailed overview of the pre-processing techniques used in the grid search is provided in Additional file 1 section VI.
Dimensionality reduction (i. e. principal component analysis) of the input data enables the chosen classifiers to work more efficiently and avoids issues of excess dimensionality. Three options are compared in the grid search: Use of the full dataset, use of the first four, and use of the first eight principal components created from all variables.
Moreover, resampling alleviates issues related to imbalanced data by altering the training dataset to have a more equal distribution of labels. The grid search compares modelling processes without resampling with processes using one of four resampling strategies. These are random oversampling, random undersampling, and S ynthetic M inority O versampling TE chnique ( SMOTE ), as well as the combination of SMOTE and undersampling.
Additionally, the grid search considered six types of data transformation to adjust the distribution of the input data. The use of the original data is compared to three straightforward (normalization, standardization and robust scaling) and two distribution-dependent transformations (Yeo-Johnson and Box-Cox).
Finally, four classifiers are compared across the grid: Logistic Regression, Linear Discriminant Analysis, Quadratic Discriminant Analysis, and the Random Forest. More details on the classifiers are provided in Additional file 1 section VII.
The metrics used to compare the modelling processes pay special attention to the imbalanced distribution of class labels. In particular, standard accuracy is not a viable metric in this case since a useless model predicting the majority class label for all observations would score highly (with accuracy equalling the proportion of majority class observations in the data, in our case 96%). Thus, the final metrics chosen for comparison are recall, the F2-measure, and the R eceiver O perating C haracteristic A rea U nder C urve ( ROC AUC ). This choice of metrics reflects the importance of recognizing sustainable accommodations despite the comparatively few available cases in the dataset. All metrics are calculated using tenfold cross-validation.
The TripAdvisor GreenLeader label is awarded to accommodations that fulfil requirements regarding specific sustainability practices. These accommodations make up 4% of all listings in the sample. Clear standards and thorough checks of the accommodations’ claims make the award a reliable source of information. As a first step of our analysis, we compare the relevant variables conditional on the accommodations’ award status (Additional file 1 section VIII). In the following, we highlight several key findings of this analysis.
4.1 Descriptive statistics
There are large differences between GreenLeader accommodations and others in terms of size and type of accommodation as well as user interaction variables (Fig. 1 ). For example, the median number of reviews received by GreenLeader accommodations (normalized by the number of rooms offered by the accommodation) is 10, while the median is only 6 for other accommodations (Fig. 1 (A)). GreenLeader accommodations also tend to be larger, with a median of 96 rooms vs. 28 rooms for other accommodations (Fig. 1 (B)). GreenLeaders also differ with regard to the number of uploaded photos (Fig. 1 (C)), the number of languages spoken by their staff (Fig. 1 (D)), the distribution of accommodation types (Fig. 1 (E)), hotel class (Fig. 1 (F)), and amenities (Fig. 1 (G)). In general, GreenLeader accommodations tend to be larger hotels with more stars, more and diverse amenities, and a higher level of user interaction as measured by reviews and uploaded photos. The variables displayed in Fig. 1 show only a subset of the more than 100 variables that could be derived from the platform data, but they illustrate the differences in publicly available features that appear to be correlated with an accommodation’s sustainability (see Additional file 1 section V for correlation matrices between the GreeanLeader badge and (a) numeric variables, (b) binary variables in the data set). In the following, we illustrate how unsupervised and supervised statistical learning techniques reveal structure in the data to distinguish groups of hotels and other accommodations that show higher or lower shares of sustainability.

Differences between GreenLeader and other accommodations in TripAdvisor data. ( A )–( D ) Distributions of continuous variables: reviews per room, Number of rooms, total number of photos per room and languages spoken by staff in GreenLeader (blue) and other (red) accommodations. ( E )–( F ) Proportion of accommodation types and hotel class (stars) in the groups of GreenLeader (left) and other (right) accommodations. ( G ) Proportion of amenities in the groups of GreenLeader (top) and other (bottom) accommodations. GreenLeader accommodations tend to be larger, have more user interactions, are of higher quality, and offer more amenities than other accommodations
4.2 Unsupervised statistical learning
Figure 2 displays the results of dimensionality reduction (principal component analysis) and cluster analysis (k-means) applied to the 33 continuous variables in the data set. The exploratory dimensionality reduction reveals that four components capture a large share of the variation in the data (see Additional file 1 section IX). Figure 2 (A) illustrates the loadings of the first four components. We have used hierarchical clustering to identify groups of variables with similar loadings (see dendrogram in Fig. 2 (A)). This analysis reveals that the variables tend to group into four clusters, which represent distinct types of information available about each accommodation. The variables Walker score, Restaurant score, and Attractions score all describe the location around the accommodation. A second group of variables describes quality indicators, such as the number of languages spoken by staff, hotel class (stars), and price. Variables related to the user rating (e. g., value, service, and average rating) form a third distinct group, while the fourth cluster describes aspects related to the size of the accommodation (number of rooms, number of reviews). As shown in Fig. 2 (A), the data has a structure that can be detected by unsupervised learning algorithms, which reflects interpretable concepts and trust cues known from other domains of the platform economy [ 45 ].

Unsupervised Learning techniques applied to TripAdvisor data. ( A ) Heatmap of principal component loadings of the four main principal components based on dimensionality reduction of the 33 continuous variables in the data set. The algorithm identifies four main dimensions in the data: accommodation size and user interaction (PC1), user rating (PC2), location (PC3), and quality (PC4). ( B ) Summary statistics of four clusters identified by k-means clustering. The accommodations can be grouped according to quality and user interaction variables. The clusters show different proportions of the GreenLeader outcome variable, varying from 2% to 19%. ( C ) Two-dimensional representation (PC1, PC2) of TripAdvisor data (10% sample) grouped in four clusters (panels) and GreenLeader/other accommodations (color). The unsupervised learning algorithms are able to split the data into distinct groups with varying proportions of GreenLeader accommodations
In addition to dimensionality reduction, we also use k-means clustering to identify groups of similar accommodations. At this point we want to underline that the cluster analysis is used as an exploratory statistical analysis in this study only. It serves as a way to illustrate that accommodations, which share certain features (among them the sustainability label), tend to co-occur in the data.
Note that many choices on the number of clusters are possible and justifiable (Additional file 1 section X). Here, we used four clusters for separating the data into prototypical groups. Figure 2 (B) provides summary statistics of the four groups. Cluster 1 represents a small subset of the data containing only 2% of all accommodations, 19% of which are GreenLeader accommodations. The group is characterized by high quality hotels with many rooms, a lot of user interactions (reviews and photos), many international guests (high share of English language reviews), and high prices. Cluster 2 also contains a disproportionately large share of GreenLeaders, high-quality, and expensive hotels. In contrast to Cluster 1, however, this Cluster’s accommodations are significantly smaller. The largest share of the data is captured by Clusters 3 and 4, which account for 83% of all accommodations but with an average share of only 2% GreenLeader accommodations. Compared to the other two clusters, the accommodations in these groups are substantially less expensive and smaller, they have significantly fewer user interactions, a lower share of English language reviews, and lower quality. The main differences between Cluster 3 and 4 are, again, size and quality: Cluster 3 accommodations have, on average, 50% more rooms than those in Cluster 4, but they score lower on price and quality characteristics (stars), internationality, and user interactions.
In summary, the total dataset can be split into (at least) four groups of hotels: large, high-class hotels in cluster 1, small, high-class hotels in cluster 2, low-price hotels in cluster 3, and other accommodations in cluster 4. Clusters 1 and 2 show the highest share of GreenLeader accommodations.
The cluster differences and the differences between GreenLeader and other accommodations are shown in Fig. 2 (C) in the dimensionality-reduced space of the first two principal components. Each panel represents a cluster from the table in Fig. 2 (B); circles indicate the position of the majority of the data points of the two accommodation types (GreenLeader vs. non-GreenLeader) in each panel. The plot shows that the different clusters take distinct positions within the two-dimensional space. Accommodations in Cluster 1 – the high-quality hotels with many rooms – score high on the first principal component (which loads heavily on variables related to a hotel’s size) but stretch along the second axis. Similarly, Cluster 2 shows a relatively high loading on the first principal component, but in contrast to Cluster 1, the data tend to show higher values on the second component (reflecting, for instance, better user ratings). Clusters 3 and 4 – the relatively low-price accommodations – both score low on the first component, that is, they represent smaller accommodations. Their main difference is the second principal component: Cluster 3 accommodations seem to be characterized by low user ratings, while Cluster 4 comprises more accommodations with a positive rating. Note, however, that while there are some differences in the positioning within each panel, there is also a large overlap between both groups. The differences are most pronounced in Clusters 3 and 4, which indicates that the GreenLeader accommodations differ more strongly from other accommodations in the realm of lower quality, low-price accommodations.
Overall, the application of the unsupervised learning techniques in this section reveals structures in the data on hotel descriptions, amenities, user ratings, and customer interactions that seem to be correlated with the presence of the GreenLeader sustainability label. We do not make any claims as to whether there exists any causal relationship between these features and the sustainability label; we only observe that they tend to co-occur in the data.
4.3 Classification performance and extrapolation
The aim of the study is to investigate whether algorithmic machine learning algorithms trained on publicly available data can identify and predict the extent of sustainable tourism with high temporal and spatial accuracy. To do so, we tested large sets of models and preprocessing techniques and their combinations. To compare the prediction performance of the models, we report cross-validated average effects on three established metrics: F2 score, Recall, and ROC AUC. In Fig. 3 , we provide the main results. Detailed results are provided in Additional file 1 section XI.

Classification performance and extrapolation. ( A ) Comparison of 360 classification models (90 models per classifier and panel) regarding three performance metrics: F2 score, Recall, and ROC AUC (each dot represents a model). QDA model (1) shows the highest F2 score, QDA model (2) achieves the highest Recall, and Random Forest model (3) the best ROC AUC score. ( B ) Confusion matrices of the three best performing models (1) to (3) according to the performance metrics (top panels) and a random draw model (4) (lowest panel). Inset: performance comparison between machine learning models (red) and 20,000 random draws (blue) according to F2 score, Recall, and ROC AUC. The machine learning models show a significantly better prediction performance than the random draw models. ( C ) Predicted share of GreenLeader accommodations in Europe (NUTS-2) according to the QDA model (1). The model predicts urban centres and several regions in West and North Europe to have the high shares of sustainable tourist accommodations
The grid search comprised a total of 360 models (i. e., 4 classifiers × 3 dimensionality reduction techniques × 5 resampling methods × 6 data transformations) and resulted in widely varying performances (Fig. 3 (A)). Depending on the assessment metric, several model specifications show similar performance. However, many models are not competitive. For example, a large number of Random Forest models score low on the Recall metric.
Fig. 3 (A) shows the best performing models according to three assessment matrices: QDA model (1) according to the F2 score (F2 score = 0.404), QDA model (2) according to Recall (Recall = 0.867), and Random Forest model (3) according to the ROC AUC score (ROC AUC = 0.887). To give an intuition into the quality of the prediction, Fig. 3 (B) shows the confusion matrices of the cross-validated average prediction accuracy of these models in comparison to a random draw model (4). Please note that each of the listed models uses the same set of variables. They differ with respect to the specification of the full machine learning pipeline, i. e. model choice and preprocessing steps.
High performance on the F2 score as seen for QDA model (1) indicates both, high degrees of precision in correctly identifying non-sustainable hotels and recall of sustainable accommodations. As the latter is at the core of this project, we also look at recall individually. Here, QDA model (2) is able to identify the largest percentage of true GreenLeader listings. Finally, Random Forest model (3) has the highest ability of discriminating between the two classes and hence scores highest in the ROC AUC metric.
From comparing the confusion matrices, but also the overall prediction performance of the different models displayed in Fig. 3 (A), it is obvious that there is not one single best choice. This is due to statistical uncertainty, but also because of the fuzziness of the sustainability concept and data used here. Furthermore, as Figs. 1 and 2 show, the data vary in terms of quality, user ratings, location, and interaction metrics. GreenLeader and other accommodations overlap in this regard. Hence, it is not surprising that machine learning models will not be able to perfectly differentiate between the groups.
Nonetheless, it becomes clear that the data allows for the training of statistical learning models that assess the sustainability of touristic accommodations with a level of accuracy far beyond random draw (Fig. 3 (B): confusion matrix of model (4) in the lowest panel). The overall predictive capability of the machine learning models trained on the TripAdivsor data is highlighted in the inset of Fig. 3 (B). It compares the distributions of the prediction performance of 20,000 random draws using the unconditional probability of 4% GreenLeader accommodations (blue) in the data with the performance of all machine learning models from Fig. 3 (A) (red). Since the employed metrics of F2 score, Recall and ROC AUC are less intuitive than simple accuracy, we use random draw as a comparative baseline. The median performance of the machine learning models outperforms random draw substantially: by a factor of 8 with regard to the F2 score, by a factor of 17 with regard to recall, and by a factor of 1.67 with regard to the ROC AUC. In other words, the publicly available TripAdvisor data is informative with respect to the sustainability of touristic accommodations. Footnote 5
To illustrate the granularity of the derived touristic sustainability measure, Fig. 3 (C) shows the predicted share of GreenLeader accommodations in the European NUTS-2 regions for countries with and without TripAdvisor’s GreenLeader program. Touristic sustainability follows a particular spatial distribution that seems to be related to the socio-economic structure in Europe. While it is beyond the scope of this study to explain the geography of touristic sustainability in detail, several observations can readily be made. First, the predicted share of GreenLeader accommodations is higher in metropolitan than in rural areas. For example, Berlin, Hamburg, Birmingham, London, Stockholm, Helsinki, Copenhagen, Vienna, Warsaw, Prague, Bratislava, Budapest, Zagreb, Madrid, and Sofia all seem to host much higher share of sustainable accommodations than the surrounding countryside. Moreover, sustainable tourism seems to be more widespread in North and West Europe than in East and South Europe. Footnote 6
In summary, our findings illustrate that the automatized and algorithmic prediction of sustainable tourism indicators is feasible. This can contribute to providing a cost-effective, accurate, and spatially granular assessment and tracking of sustainable tourism over time. The method showcased here can also have positive effects on transparency and thus support informed customer decisions. Moreover, it can help platforms and other organizations to identify sustainable accommodations.
5 Discussion
Tourism plays an important role in economic development across the globe and indicators are crucial to understand its development in different regions over time. Though heavily affected by the Covid-19 pandemic, the sector is expected to resume its growth path soon. With it, the environmental and social impacts of tourism will also continue to grow. Measuring and fostering sustainable tourism through effective indicators is thus a topic of global interest. Today, the global use of sustainable tourism indicators is limited by implementation costs and difficulties in data collection. In other areas, the inclusion of alternative data sources has been proven to be beneficial. This paper sets out to test the applicability of an alternative data source for the measurement of sustainable tourism.
5.1 Summary of the results
In collecting and analyzing data from TripAdvisor – one of the globally leading online tourism platforms – we show that it is possible to create a cost-effective, granular, and accurate measure of sustainable tourism based on publicly available online data. We compare differences between touristic accommodations holding TripAdvisor’s GreenLeader award and other accommodations regarding hotel quality metrics, user interaction, user rating, and location features. We conduct a grid search on a total of 360 machine learning pipelines to differentiate sustainable from non-sustainable hotels based on the high-dimensional platform data. The performance of the machine learning models is substantially better in identifying sustainable hotels than the baseline model of unconditional expectation. Footnote 7 In other words, machine learning models trained on online platform data can make a contribution in assessing the state of sustainable tourism in countries and regions as the presence of the sustainability award shows correlation with various other characteristics. Note that some caution is due since these correlates are – in most cases – not formative for the accommodation’s sustainability.
For example, we find that more expansive and larger hotels with more rooms and customer reviews (see Fig. 2 (B)) tend to have a higher share of GreenLeader badges. We want to state explicitly that we do not assume such features to be causal for an accommodation’s sustainability. However, both could, nonetheless be related. It might be the case that larger hotels have more resources available to deal with the requirements of sustainability labels. It could also be that larger hotels are more dependent on web traffic from online platforms and therefore invest more resources in obtaining badges from the platform. Furthermore, hotels in the premium segment with a focus on quality and user satisfaction might want to utilise the sustainability label as an additional quality criterion. While such factors are not displayed in the large-scale online platform data, the observable correlations between prices or hotel size and the sustainability label seem to capture such patterns.
The approach presented here reveals factors that correlate with the sustainability label, but it should not be employed to assess individual accommodations’ degree of sustainability based on the correlations alone. However, the approach may well serve to statistically assess countries’ and regions’ degree of sustainable tourism with high temporal and spatial granularity, for example for the purpose of nowcasting sustainability indicators or for extending the geographical coverage of such indicators to places without ‘ground-truth’ data on sustainable tourism.
It is important to highlight that the purpose of the analysis is not in predicting and identifying individual hotels as sustainable, but on providing a probabilistic assessment about the distribution of sustainable hotels in a region (as shown in Fig. 3 (C)) derived from the prediction model, which uses individual-level data. In that sense, our analysis is similar to medical studies that aim to quantify population-wide health risks. Such assessment consider individual-level risk factors such as age, obesity or nutrition to calculate an estimate of the share of the population being at risk of cardiovascular diseases, but they do not aim to make predictions on the level of individuals patients.
5.2 Theoretical implications for the applicability of big data in tourism research
Past studies have employed text analysis to understand user preferences and discussions [ 36 , 37 ]. Accommodation-specific data has been used for the estimation of visitor capacities in neighborhoods [ 32 ]. In contrast, this paper focuses on the classification of accommodations by sustainability. We add to the literature by utilizing accommodations’ own presentation and associated user interactions to gain information about their sustainability practices. The creation of a large numeric dataset allows for the training of common machine learning algorithms. Using available ground truth data for classifier training, the quality of the analyzed classifiers could be assessed in detail. This approach was followed in prior work where it allowed for comprehensive model assessment using true values and labels [ 9 , 31 ]. In doing so, we were able to confirm the applicability of travel platform data for use in tourism statistics. In particular, the low cost of data collection and high spatial resolution of the data could be shown. It should be noted that the estimated models do not attempt to create an alternate definition of sustainability through using new causal factors. Instead, the true label is determined trough physical measurements of energy, waste and water. Here, it is estimated using correlated factors available in the online platform data. The legitimacy of using of private company sources for the collection of data for policy making will remain an important open question. Our study helps to underline the potential of the large-scale analysis of online data as a valuable method for research in sustainable tourism, and sustainability studies in general.
5.3 Implications for tourism practitioners and policy makers
Tourism platforms can make use of our findings in multiple ways. Listings, which are predicted to employ sustainability practices but do not (yet) carry the award, can be actively approached, and be made aware of the GreenLeaders program. These accommodations can, in turn, benefit from increased visibility and increase their attractiveness for environmentally conscious consumers. More visibly communicating sustainability efforts could hence become a competitive advantage. This could in turn increase pressure on competing businesses to also invest in sustainable practices.
For platforms, cooperation with researchers and statistics departments is an effective way of underlining environmental and social efforts. Policy makers can benefit from the availability of inexpensive, granular, and up-to-date data. For policy makers in countries with established frameworks for sustainable tourism statistics, the higher frequency and granularity of reporting can offer important supplementary information. Through the comparison with traditional data sources, model accuracy can be monitored, and models can be adjusted where needed. In countries without established frameworks, the proposed methodology can offer estimates when traditional methods of data collection are prohibitively costly to implement, or where important infrastructure is not available.
These estimates can guide policy makers towards initial interventions and allow for detailed monitoring of the associated effects. In relation to existing frameworks of sustainable tourism indicators, the implications are twofold: For the ETIS framework, which collects data on the percentage of accommodations using a voluntary sustainability label under its indicator A.2.1., the described models can offer a remedy for difficulties in data collection for this indicator. For other frameworks, inclusion of the presented indicator can be discussed to create a more complete picture without significantly increasing data collection efforts.
5.4 Practical implications and limitations
It is important to note that the proposed methodology cannot replace accommodation surveys and other statistically robust modes of data collection. It should instead be considered as a complementary source of information or a first estimate when no other data is available. The presented methodology is heavily reliant on the quality of the big data sample. Systematic differences between accommodations listed on TripAdvisor and those that are not should hence be a focal point of further research. Another limitation might be potential confounding factors on the regional level that we could not control for. Our analysis solely uses variables on the level of individual accommendations. For example, it might be that legal requirements or cultural values in some regions affect the share of hotels with a sustainability label.
In addition, omitting incomplete observations may further limit the validity of the training sample and alternatives should be explored in greater detail. Future research should furthermore explore the feasibility of other, freely available data sources. Both, accommodation characteristics and the sustainability label, are taken from TripAdvisor. Characteristics could be collected from a range of other travel platforms. An alternative label for classifier training could be created from other well-established sustainability programs. Although a broad range of classifiers and preparatory steps was compared, other approaches may yet outperform the methods included in the analysis. Lastly, this paper treats sustainability as a binary variable, separating accommodations into those following any sustainability practices and those following none. Additional research could explore whether the degree of sustainability practices, expressed for example by the differentiated TripAdvisor GreenLeader labels from ‘partner’ to ‘platinum’ level, can also be modelled.
On a more general note, the methodology suffers from shortcomings common to all big data approaches. Although new forms of data collection and analysis have filled data gaps and increased our understanding of social, economic, and touristic activity, there are justifiable concerns about the use of such (alternative) data sources. Machine learning methods have the outstanding ability of combining many weak signals into predictions for labels or variables. These signals do not need to be in line with theoretical groundwork and in practice will often not be. For this reason, some algorithmically derived signals would not have been included as relevant explanatory variables in traditional modelling [ 21 ]. Algorithmic prediction models also reproduce existing biases in the data. In our case, not all hotels that would fulfil the criteria to obtain a GreenLeader badge might have actually applied for the label – a bias that our model cannot control for. Additionally, the use of big data and machine learning did cause concerns regarding privacy issues and the possibility that algorithms might pick up unethical or discriminatory practices present in historical data sets [ 46 ]. However, with the advantage of improved detection of patterns in the data comes the risk of disregarding underlying theory altogether [ 47 ].
6 Concluding note
This paper set out to analyze whether online platform data can be used to inform about sustainable tourism. Sustainability in tourism describes the goal of balancing economic, social, and environmental factors. The complexity of this goal requires diverse sources of information to monitor progress and inform decision-makers. The corresponding data collection processes offer room for improvement with regards to both cost and frequency of reporting. Research is often focused on Europe, the world’s largest tourism market, but despite freely available national census data and experienced practitioners there are difficulties in the implementation of existing indicator frameworks and the collection of relevant data.
In this paper, we offer an alternative to existing methodologies through the use of travel platform data. In this extended pilot, the platform TripAdvisor was used as the sole source of data. Tourist accommodation data was collected through automated scraping of TripAdvisor listings from 37 European countries. Following several data exploration steps, we developed a supervised learning model for the assessment of accommodations’ sustainability. Ground truth data was sourced from TripAdvisor (where the GreenLeader award is available in 27 of the 37 countries). The final model was chosen from a set of four supervised learning techniques, each building upon combinations of dimensionality reduction, resampling, and data transformation methods. The imbalanced nature of the classification task added difficulty. With less than 4% of training data belonging to the sustainable class, use of the accuracy metric would have been misleading. Model comparison was hence performed using the F2-metric. Recall and the Receiver Operating Characteristic Area Under Curve metric. A classifier using quadratic discriminant analysis was chosen as the final model. Overall, prediction quality was high but not excellent, with all methods struggling to successfully recognize observations from the positive class without significantly increasing the proportion of false positive predictions.
All findings are subject to limitations, the most important being the yet unconfirmed validity of the collected sample for the population of accommodations in each country. This representativeness of the sample and the use of other readily available platform data sources should be the focus of further research.
Availability of data and materials
The datasets analysed during the current study and code produced for the analysis are available in the author’s GitHub repository: https://github.com/felixjhoffmann/SustainableTourism/ .
https://www.unwto.org
https://www.gstcouncil.org
https://ec.europa.eu
https://www.eea.europa.eu
In this study, we make the comparison of the performance of our models with a simple random draw model only to illustrate that there is an informative signal contained in the online platform data, which has predictive capacity that can be identified via statistical learning algorithms. We do not want to claim that a random draw model would be the only alternative modelling strategy. In fact, many different types of models can lead to good predictions, as we show by using a set of 360 different models in total.
For average sampled and predicted values by country, please refer to Additional file 1 setion XII.
The performance of the models is compared to a random draw only for the purpose of illustrating the predictive capacity in the data, see footnote 5 .
World-Tourism-Organization, International-Transport-Forum (eds) (2019) Transport-related CO2 emissions of the tourism sector – modelling results. World Tourism Organization (UNWTO), Madrid https://doi.org/10.18111/9789284416660 . Accessed 13 Jul 2021
Book Google Scholar
World-Travel-&-Tourism-Council (2021) Economic Impact Reports. https://wttc.org/Research/Economic-Impact . Accessed 13 Jul 2021
United-Nations (2015) Transforming our world: the 2030 Agenda for Sustainable Development. https://sdgs.un.org/2030agenda . Accessed 13 Jul 2021
United-Nations (UN) (2020) The sustainable development goals report 2020. Oxford University Press, New York
Google Scholar
Gössling S (2002) Global environmental consequences of tourism. Glob Environ Change 12(4):283–302
Article Google Scholar
Lenzen M, Sun Y-Y, Faturay F, Ting Y-P, Geschke A, Malik A (2018) The carbon footprint of global tourism. Nat Clim Change 8(6):522–528
Rasoolimanesh SM, Ramakrishna S, Hall CM, Esfandiar K, Seyfi S (2020) A systematic scoping review of sustainable tourism indicators in relation to the sustainable development goals. J Sustain Tour, 1–21
World-Tourism-Organization (2021) International tourism highlights 2020 edition. Report
Fatehkia M, Kashyap R, Weber I (2018) Using Facebook ad data to track the global digital gender gap. World Dev 107:189–209
Steele JE, Sundsøy PR, Pezzulo C, Alegana VA, Bird TJ, Blumenstock J, Bjelland J, Engø-Monsen K, De Montjoye Y-A, Iqbal AM et al. (2017) Mapping poverty using mobile phone and satellite data. J R Soc Interface 14(127):20160690
World-Tourism-Organization, United-Nations-Development-Programme (2017) Tourism and the sustainable development goals: journey to 2030 OCLC: 1257450410
World-Tourism-Organization (ed) (2004) Indicators of sustainable development for tourism destinations: a guidebook WTO, Madrid
GSTC (2021) The GSTC Criteria and the UN SDGs. https://www.gstcouncil.org/gstc-criteria/gstc-and-sdgs/ . Accessed 13 Jul 2021
European Commission, Directorate-General for Internal Market, I. Entrepreneurship and SMEs (2016) The European Tourism Indicator System ETIS Toolkit for Sustainable Destination Management. Publications Office, Luxembourg. OCLC: 954067498. https://ec.europa.eu/docsroom/documents/21749
Plüss C, Zotz A, Monshausen A, Kühhas C (2012) Sustainability in tourism: a guide through the label jungle. Technical report, Naturefriends International, Vienna. https://www.tourism-watch.de/system/files/migrated/labelguide_en_web.pdf
Council of the European Union (1992) Council regulation (EU) no 880/1992. https://eur-lex.europa.eu/legal-content/EN/TXT/?uri=CELEX:31992R0880
TripAdvisor (2021) Go green – tripadvisor greenleaders launches in europe to showcase ecofriendly hotels. Report
Verbraucher-Initiative (2021) Tripadvisor Green Leaders: Öko-Spitzenreiter. https://label-online.de/label/tripadvisor-green-leaders-oeko-spitzenreiter/ . Accessed 13 Jul 2021
Modica P, Capocchi A, Foroni I, Zenga M (2018) An assessment of the implementation of the European tourism indicator system for sustainable destinations in Italy. Sustain 10(9):3160
United-Nations (2020) The sustainable development goals report 2020. United-Nations, New York. Google-Books-ID: M6D9DwAAQBAJ
Letouzé E, Stock M, Chiara F, Lizzi A, Mazariegos C (2019) Harnessing innovative data and technology to measure development effectiveness. Southern Voice. http://southernvoice.org/wp-content/uploads/2019/08/190814-Ocassional-Paper-Series-No.-54_final.pdf
Lazer D, Kennedy R, King G, Vespignani A (2014) The parable of Google flu: traps in big data analysis. Science 343(6176):1203–1205
Nelson N, Brownstein J, Hartley D (2010) Event-based biosurveillance of respiratory disease in Mexico, 2007–2009: connection to the 2009 influenza a (h1n1) pandemic? Euro Surveill 15(30):19626
Askitas N, Zimmermann KF (2009) Google econometrics and unemployment forecasting
Choi CS, Yun H, Kim KK (2009) The impact of avatar appearance and offline identity disclosure on trust in virtual worlds. In: AMCIS 2009 proceedings, p 270
Carrière-Swallow Y, Labbé F (2013) Nowcasting with Google trends in an emerging market. J Forecast 32(4):289–298
Article MathSciNet Google Scholar
UNDP (2016) A Guide to Data Innovation for Development – From idea to proof-of-concept. Report
Buning RJ, Lulla V (2020) Visitor bikeshare usage: tracking visitor spatiotemporal behavior using big data. J Sustain Tour 29(4):711–731
Hardy A, Aryal J (2020) Using innovations to understand tourist mobility in national parks. J Sustain Tour 28(2):263–283
Gallego I, Font X (2021) Changes in air passenger demand as a result of the Covid-19 crisis: using big data to inform tourism policy. J Sustain Tour 29(9):1470–1489
Nurmi O, Luomaranta H, Fornaro P (2020) TOURCAST – a Finnish tourism nowcasting and forecasting model. https://doi.org/10.13140/RG.2.2.12389.83688 . Accessed 27 Jul 2021
Batista e Silva F, Herrera MAM, Rosina K, Barranco RR, Freire S, Schiavina M (2018) Analysing spatiotemporal patterns of tourism in Europe at high-resolution with conventional and big data sources. Tour Manag 68:101–115
Quattrone G, Greatorex A, Quercia D, Capra L, Musolesi M (2018) Analyzing and predicting the spatial penetration of airbnb in us cities. EPJ Data Sci 7(1):31
Falk MT, Hagsten E (2021) Visitor flows to world heritage sites in the era of Instagram. J Sustain Tour 29(10):1547–1564
Sun Y, Paule JDG (2017) Spatial analysis of users-generated ratings of yelp venues. Open Geosp Data Softw Stand 2(1):1–9
Serrano L, Ariza-Montes A, Nader M, Sianes A, Law R (2021) Exploring preferences and sustainable attitudes of airbnb green users in the review comments and ratings: a text mining approach. J Sustain Tour 29(7):1134–1152
Mariani M, Borghi M (2020) Environmental discourse in hotel online reviews: a big data analysis. J Sustain Tour 29(5):829–848
Londoño ML, Hernandez-Maskivker G (2016) Green practices in hotels: the case of the greenleaders program from tripadvisor. WIT Trans Ecol Environ 201:1–13
Bassolas A, Lenormand M, Tugores A, Gonçalves B, Ramasco JJ (2016) Touristic site attractiveness seen through Twitter. EPJ Data Sci 5:1
Talebi M, Majnounian B, Makhdoum M, Abdi E, Omid M (2021) Predicting areas with ecotourism capability using artificial neural networks and linear discriminant analysis (case study: Arasbaran protected area, Iran). Environ Dev Sustain 23(6):8272–8287
Mendoza M, Poblete B, Valderrama I (2019) Nowcasting earthquake damages with Twitter. EPJ Data Sci 8(1):3
Fatehkia M, Tingzon I, Orden A, Sy S, Sekara V, Garcia-Herranz M, Weber I (2020) Mapping socioeconomic indicators using social media advertising data. EPJ Data Sci 9(1):22
Kashyap R, Verkroost FC (2021) Analysing global professional gender gaps using linkedin advertising data. EPJ Data Sci 10(1):39
Grybauskas A, Pilinkienė V, Stundžienė A (2021) Predictive analytics using big data for the real estate market during the Covid-19 pandemic. J Big Data 8(1):1–20
Hesse M, Dann D, Braesemann F, Teubner T (2020) Understanding the platform economy: signals, trust, and social interaction. In: Proceedings of the 53rd Hawaii international conference on system sciences
Winter J (2015) Algorithmic discrimination: big data analytics and the future of the Internet. In: The future Internet. Springer, Berlin, pp 125–140
Chapter Google Scholar
Hilbert M (2016) Big data for development: a review of promises and challenges. Dev Policy Rev 34(1):135–174
Download references
Acknowledgements
Not applicable.
Authors’ information
Felix Hoffmann holds a MSc Industrial Economics from Technische Universität Berlin and a BSc Economics from the University of Amsterdam. His research revolves around the use of alternative data sources in public economics. He works in industry as an analytics and data consultant. Fabian Braesemann is a Departmental Research Lecturer in AI & Work at the Oxford Internet Institute, University of Oxford. In his research, he applies social data science methodologies on large-scale online data to understand market and information dynamics in a digitally connected world. Furthermore, he is Founder of the Datenwissenschaftliche Gesellschaft Berlin , a company focused on applying data science to economic, policy, and development problems. Timm Teubner is Professor at the Einstein Center Digital Future at Technische Universität Berlin. He holds a Diploma degree in Industrial Engineering & Management and a doctoral degree in Information Systems from Karlsruhe Institute of Technology (KIT). His research interests include online platforms and multi-sided markets, reputation systems, trust in digital services, online auctions, as well as Internet user behavior. His research has been published in journals such as the Journal of the Association for Information Systems, Information & Management, Electronic Markets, International Journal of Electronic Commerce, Business & Information Systems Engineering, and Economics Letters.
The authors received no financial support for the research, authorship, and publication of this article. Open Access funding enabled and organized by Projekt DEAL.
Author information
Authors and affiliations.
Trust in Digital Services, Technische Universität Berlin, 10623, Berlin, Germany
Felix J. Hoffmann & Timm Teubner
Oxford Internet Institute, University of Oxford, OX1 3JS, Oxford, UK
Fabian Braesemann
Datenwissenschaftliche Gesellschaft Berlin, 10117, Berlin, Germany
You can also search for this author in PubMed Google Scholar
Contributions
FH and FB contributed equally to this study. FH produced the code for web-scraping, unsupervised learning and model comparison. He created the initial draft of the article. FB conceptualised the research, supported the statistical analysis and produced the enclosed visualizations, and. TT guided the writing process and structured the final presentation of results. All authors wrote and approved the final manuscript.
Corresponding author
Correspondence to Timm Teubner .
Ethics declarations
Competing interests.
The authors declare that they have no competing interests.
Additional information
Felix J. Hoffmann and Fabian Braesemann contributed equally to this work.
Supplementary Information
Below is the link to the electronic supplementary material.
Supplementary information (PDF 6.6 MB)
Rights and permissions.
Open Access This article is licensed under a Creative Commons Attribution 4.0 International License, which permits use, sharing, adaptation, distribution and reproduction in any medium or format, as long as you give appropriate credit to the original author(s) and the source, provide a link to the Creative Commons licence, and indicate if changes were made. The images or other third party material in this article are included in the article’s Creative Commons licence, unless indicated otherwise in a credit line to the material. If material is not included in the article’s Creative Commons licence and your intended use is not permitted by statutory regulation or exceeds the permitted use, you will need to obtain permission directly from the copyright holder. To view a copy of this licence, visit http://creativecommons.org/licenses/by/4.0/ .
Reprints and permissions
About this article
Cite this article.
Hoffmann, F.J., Braesemann, F. & Teubner, T. Measuring sustainable tourism with online platform data. EPJ Data Sci. 11 , 41 (2022). https://doi.org/10.1140/epjds/s13688-022-00354-6
Download citation
Received : 07 November 2021
Accepted : 11 June 2022
Published : 18 July 2022
DOI : https://doi.org/10.1140/epjds/s13688-022-00354-6
Share this article
Anyone you share the following link with will be able to read this content:
Sorry, a shareable link is not currently available for this article.
Provided by the Springer Nature SharedIt content-sharing initiative
- Sustainable tourism
- Platform data
- TripAdvisor
- Imbalanced classification
- Supervised learning
- Hospitality Industry
Sustainable travel statistics: 6 facts to open your mind

March 01, 2021 •
7 min reading
What do industry professionals need to know about the 'new norm' in tourism? In this article we take a deeper look at 6 sustainable travel statistics. While COVID has upended the $8 trillion global travel industry, the pandemic has also paved the way for tourism and hospitality professionals to reflect, rethink and reshape the sector, making it better - and ultimately more sustainable - for people and places around the world.
As UNWTO Secretary-General Zurab Pololikashvili said:
Sustainability must no longer be a niche part of tourism but the new norm for every part of our sector. That means an opportunity to build back better and create and industry that is more resilient and aligned with the UN’s Sustainable Development Goals.
Which key findings and statistics will help inform hospitality and tourism professionals as they recover from the impact of the pandemic and prepare for a more resilient and sustainable future?
1. sustainability is in growing demand:, over 53% of people want to travel more sustainably in the future..
While the term "sustainable tourism" is tossed around with increasing frequency, many professionals have only a vague understanding of what sustainability really means. Essentially, sustainable travel refers to tourism that supports the natural and cultural heritage - as well as the economic viability - of destinations. Not only is sustainability essential for our collective future, but tourists are demanding it. According to the digital travel platform Booking.com, over half (53%) of global travelers want to travel more sustainably in the future , and the company expects to see a more eco-conscious mindset in 2021 and beyond, as coronavirus has amped people’s awareness of their impact on the environment and local communities. In fact, over two-thirds (69%) of respondents anticipate that the travel industry will offer more sustainable travel options .
2. Beyond sustainable:
Regenerative travel is trending with dozens of companies committing to supporting the future of tourism’s 13 principles of a more ethical and planet-friendly industry..
While sustainability refers to harm reduction, a new concept has recently cropped up among tourism professionals: "regenerative travel". Built on the sustainability concept, regenerative tourism, which is even more ambitious, refers to leaving a place even better than you found it. Six nonprofit organizations - including the Center for Responsible Travel and Sustainable Travel International - have established the Future of Tourism coalition , which aims to “build a better tomorrow". Dozens of hotel groups, destination marketers and travel organizations have signed on to the coalition’s 13 guiding principles, including “demand fair income distribution” and “choose quality over quantity. ”
3. Generating economic opportunity:
Following tremendous losses, according to the wttc, the industry could regain 111 million travel and tourism jobs in 2021..
In 2020, the world economy shrank by 4.3 per cent, over two and half times more than during the 2009 global crisis. The economies of tourism-dependent regions have been hit particularly hard. Women, young people and workers with low education, who make up the bulk of hospitality employees, have been most severely affected. In fact, job and income losses have pushed millions of people in tourism-dependent places like Latin America and the Caribbean into poverty, wiping out all economic progress made over the past 15 years. At the peak of the pandemic, nearly nine in ten hotels had to lay off or furlough workers, and the hospitality and leisure industry lost 7.5M jobs. On a somewhat encouraging note, however, the World Travel and Tourism Council’s latest economic forecast predicts that as many as 111 million global travel and tourism jobs could be regained in 2021. That will depend, of course on restoring traveler confidence through vaccine distribution, mandatory mask-wearing and comprehensive COVID testing. And key to all economic recovery is investment. As UN Secretary-General Antonio Guterres urged, "Let's invest in an inclusive and sustainable future driven by smart policies, impactful investments, and a strong and effective multilateral system that places people at the heart of all socio-economic efforts."
4. Travelers want to help:
Not only has the pandemic increased traveler commitment to sustainability and the environment, two-thirds of travelers want their choices to support the destination’s recovery efforts, and more than half want to see how their money is going back into the local community..
Travel companies are facilitating that desire to help. New businesses – such as the booking agency Regenerative Travel - features sustainable destinations and resorts and committed to a sustainable future. The interest in giving back to destination communities is even evident among armchair travelers. Global Child "Travel with Purpose" , a popular series available on Amazon Prime, is now in its third season. According to the series’ creator, "We wanted to inspire travelers to remember that everyone is part of one global family, it's time to leave the divisive behind and embrace the future together. Doing good in each place we visit, not only is a great blessing for each place we visit, but it actually does wonders for our own soul.”
5. Climate change:
The hotel sector accounts for around 1% of global carbon emissions, and this is set to increase..
Along with a global focus on the pandemic, concern over climate change has reached new levels this past year, with an increasing determination by businesses and individuals everywhere to do their part to mitigate carbon emissions. In fact, one of the silver linings of the pandemic has been the decrease in travel-related carbon emissions. Hotels can do their part to help further reduce emissions through sustainable building design, the efficient use of energy, by addressing issues in their supply chains and reducing single-use plastics. They can also reduce purchase carbon offsets with companies such as Cool Effect to offset their emissions. One important way that hotels and restaurants can contribute to reducing emissions - and address consumer concerns - is by serving sustainable foods. A recent survey from EU consumer organization BEUC, which focused on consumers’ attitudes toward sustainable food , found that more than half of consumers say that sustainability has some or a lot of influence on their eating habits. That means, for example, reducing red meat, which has a huge carbon footprint, and serving more plant-based and foods from local farms.
6. Sustainable design & stewardship sells:
53% of global travelers are willing to pay more for products that demonstrate environmental responsibility - 13% more than a year ago..
Even during the pandemic, concerns about the future of our planet are top of mind and driving decisions. As revealed by the Deloitte Global Millennial Survey 2020 - which explores the views of more than 27.5K millennials and Gen Zs, both before and after the start of the COVID-19 pandemic - “despite the individual challenges and personal sources of anxiety that millennials and Gen Zs are facing, they have remained focused on larger societal issues, both before and after the onset of the pandemic. If anything, the pandemic has reinforced their desire to help drive positive change in their communities and around the world.”
The world’s top hoteliers and industry professionals are heeding the call. Just as 9/11 increased their focus on security, the pandemic has raised hoteliers’ awareness of health and wellness - concerns that are closely linked to sustainability. Along with contactless and touchless check-in and room controls, new hotels are being designed with a focus on nature and wellness.
One of the leading sustainability trends in hotel design is modular construction, which is efficient, reduces waste, energy-use and carbon emissions. CitizenM, opened its first modular hotel in Amsterdam in 2008, and currently eight of the company’s hotels are made with modular units, with more underway in Los Angeles and Seattle. Marriott International currently has 50 projects in the works. Sustainability is a focus of the high-end market as well, not only because it leads to greater efficiency but because it appeals to consumer concerns.

Consultant at EHL Advisory Services
Keep reading

Hospitality management careers list for hotel enthusiasts
May 07, 2024

How Airbnb and short-term rentals reshape rural and urban communities
May 02, 2024

What does a Hotel Manager do?
This is a title
This is a text
- Bachelor Degree in Hospitality
- Pre-University Courses
- Master’s Degrees & MBA Programs
- Executive Education
- Online Courses
- Swiss Professional Diplomas
- Culinary Certificates & Courses
- Fees & Scholarships
- Bachelor in Hospitality Admissions
- EHL Campus Lausanne
- EHL Campus (Singapore)
- EHL Campus Passugg
- Host an Event at EHL
- Contact our program advisors
- Join our Open Days
- Meet EHL Representatives Worldwide
- Chat with our students
- Why Study Hospitality?
- Careers in Hospitality
- Awards & Rankings
- EHL Network of Excellence
- Career Development Resources
- EHL Hospitality Business School
- Route de Berne 301 1000 Lausanne 25 Switzerland
- Accreditations & Memberships
- Privacy Policy
- Legal Terms
© 2024 EHL Holding SA, Switzerland. All rights reserved.
- radicalstorage.com
- Français ( French )
- Deutsch ( German )
- Italiano ( Italian )

Ecotourism and Sustainable Tourism Statistics 2024
- Post author By Giacomo Piva
- Post date April 17, 2024
Ecotourism is a type of travel that is gaining in popularity with travelers being more conscious of their carbon footprint. In this analysis, we look into some of the latest ecotourism statistics, and see how sustainable tourism is changing the travel industry.
Key ecotourism statistics
- The global ecotourism market size is expected to have increased by 13.5% to $249.16 billion in 2024 , from $219.53 billion in 2023, and is predicted to reach $428.97 billion in 2028 .
- Choosing sustainable accommodation costs an average of $151 less per night , and was an average of 39% cheaper than non-sustainable options.
- A sizeable 80% of travelers said that traveling more sustainably is important to them.
- Over half (53%) of global travelers say they are looking for accommodation that combines comfort with innovative sustainability features in 2024 .
- Online searches for ‘sustainable travel’ increased by 26% between March 2019 and March 2024.
- Three in five (62%) travelers said that they planned to stay in some form of sustainable accommodation at least once in the next year.
- The majority of global travelers (66%) said they wanted to have authentic travel experiences that represent the local culture and communities .
- One-third (33%) of travelers said they would go on trips closer to home in order to reduce their carbon emissions .
What is ecotourism?
Ecotourism is a type of tourism that involves traveling responsibly to natural areas, conservation of the environment, and maintaining the well-being of local people.
Also known as sustainable tourism, this type of travel is on the rise as travelers look to explore trips that reduce their impact on the environment and support local communities. The phrases ‘ecotourism’ and ‘sustainable tourism’ were first used in books in the 1980s and have grown in popularity since then.
Popular ecotourism activities
Some common ecotourism activities that travelers may take part in on this type of trip include:
- Small group eco tours
- Hiking or trekking through nature
- An eco-friendly cruise
- Tree planting trips
Ecotourism market size
By the end of 2024, the ecotourism market size globally is predicted to grow to $249.16 billion, an increase of 13.5% from $219.53 billion in 2023. By 2028, the global ecotourism market size is expected to increase to $428.97 billion, with a compound annual growth rate (CAGR) of 14.5%. [ 1 ]
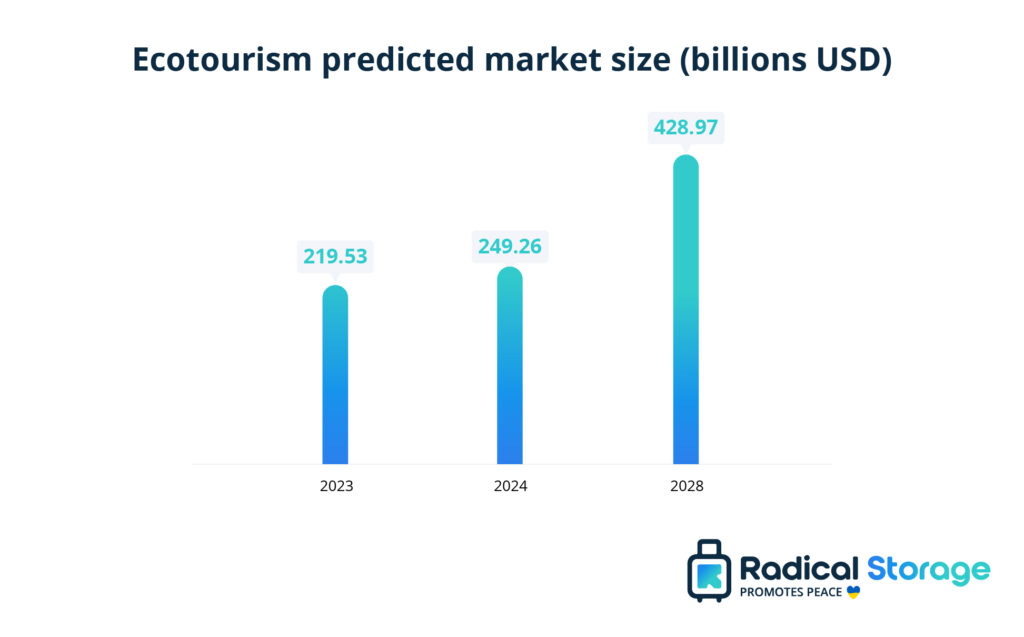
How many people travel sustainably?
A third (33%) of travelers surveyed said that they had stayed in sustainable accommodation in the past year. Based on the over 65.3 million American citizens who traveled abroad in 2023 (Oct 22 – Oct 23), this means approximately 21.55 million people chose sustainable accommodation in 2023.
Public interest in sustainable tourism
We collected data on online Google searches for sustainable tourism-related phrases to determine the change in public interest in this topic over time.
Online searches for the phrase ‘sustainable travel’ have been on the rise in the U.S., with 841 monthly searches in March 2019 growing to 1,061 in March 2024, an increase of 26%. However, searches for ‘sustainable travel’ peaked in April 2023 at 1,856.
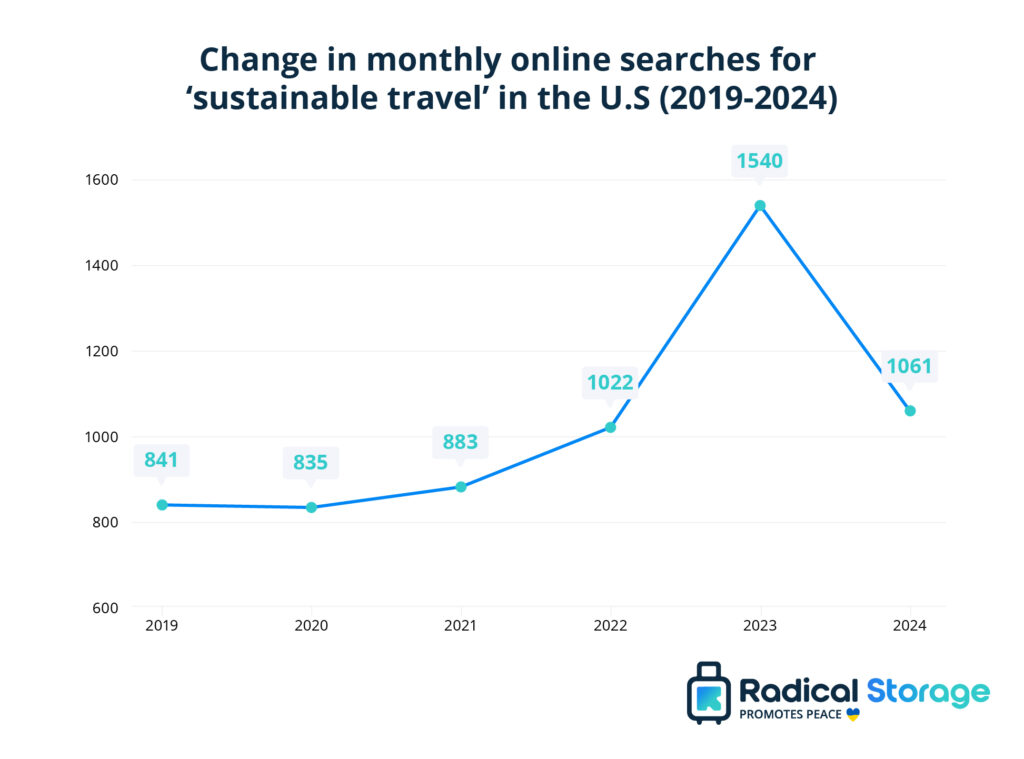
A quarter of travelers have said that they have seen sustainable accommodation options while looking at online travel sites in the past, and 29% said they would actively look for information on sustainability before making a booking.
Of those asked, 80% said that traveling more sustainably is important to them; this figure has increased from 71% in 2022. A further 43% would consider themselves knowledgeable about sustainability, with the news and social media providing the most information on the topic. [6]
Why do people choose sustainable travel?
There are a number of reasons why someone would specifically look for sustainable accommodation or eco-friendly travel providers. Almost half (46%) of travelers surveyed said that they had used sustainable accommodation during the past 12 months. Some of the reasons travelers highlighted for staying in these places include:
- To help reduce their impact on the environment (31%)
- They believe that sustainable properties are better for the local community (24%)
- They wanted to have a travel experience that was more relevant to the local area (21%)
Of those who said they hadn’t stayed in sustainable accommodation during the past year, 31% said they didn’t know they were an option, and 29% said they didn’t know how to find them. These figures suggest that more can be done to make these locations more accessible to those who might be interested in pursuing ecotourism. [2]
Attitudes towards sustainable travel
Some global travelers have a perception of ecotourism and sustainable destinations which makes them less inclined to book this kind of trip. Some of the reasons travelers said they wouldn’t choose sustainable accommodations were that other types of travel appealed to them more (32%) and that sustainable travel doesn’t provide the luxury they want (27%).
Barriers to sustainable tourism
Travelers cited a number of barriers that they felt made it more difficult to choose eco-friendly travel options. Over half (51%) of people think that there are not enough sustainable travel options available, while 44% don’t know where to find sustainable options.
Three-quarters (75%) of travelers say they are looking for authentic experiences that represent the local culture, but 40% don’t know how or where to find tours and activities that give back to the local community. [6]
Why people wouldn’t choose sustainable travel options
Almost a third (32%) of people said they wouldn’t choose sustainable travel because other travel options appeal to them more, while 29% believed there weren’t any sustainable options in their chosen destination.
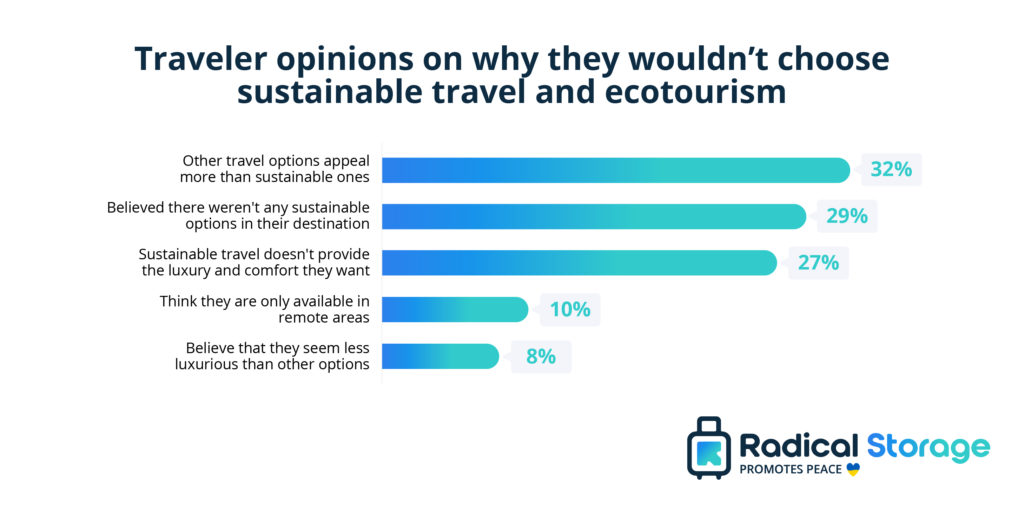
Other reasons people said they hadn’t considered booking a sustainable trip were that they thought there weren’t any available in their chosen destination, or they thought they were only in remote areas. This again shows that ecotourism companies can do more to expand their reach and bust some of the common myths about these types of accommodation.
The costs of ecotourism
When looking for more eco-friendly travel options, it can seem that this type of travel is more costly than more traditional options. This may be because sustainable tourism spots are often managed by smaller local businesses rather than large global travel companies.
Almost half (49%) of people surveyed believe that more sustainable travel options are too expensive; this figure has increased by 11% since 2022. In addition to this, 47% of people would like more tips on how to travel sustainably on a budget. [6]
But there are many ways that eco-friendly travel can be cheaper compared to other options. For example, those looking to travel within the US could make considerable savings by using trains instead of taking a flight, especially when according to the IATA, air travel produces 2.5% of the world’s greenhouse gas emissions.
Cost savings from taking a train over a flight
The data below shows the average cost saving someone could make by taking the train between popular destinations in the US instead of a flight. Taking the train to Portland from Seattle would cost an average of $400 less than taking a flight.
While it may seem like taking the train is less time efficient, with a Seattle to Portland train taking around three and a half hours, compared to a 55-minute flight, when factoring in airport wait times and security queues, this can easily add a couple of hours onto the total plane journey.
Ecotourism and accommodation cost
We wanted to know what the average cost difference is for tourists who want to opt for more sustainable hotels and accommodation compared to ‘regular’ non-eco touristic options. We reviewed the ten most popular city break destinations and compared ecotourist accommodation to regular options to see what the difference may be.
On average, opting for sustainable accommodation costs $151 less per night, and is an average of 39% cheaper than non-sustainable options. This amount will likely be quite different when solely reviewing cheap hostels, or dorms, but it may be cheaper than people think to get a more sustainable hotel option.
Our analysis reviewed the price of apartments, hotels, and aparthotels that were ‘Top reviewed’ on Booking.com, with and without the ‘Travel sustainably’ filter they offer. Data reflects the cost of hotels for a November 2023 booking in the top ten visited cities as stated by Euromonitor [5] Paris , Dubai , Amsterdam , Madrid , Rome , Berlin , New York , London , Munich , and Barcelona .
Ecotourism and local communities
Engaging with the local community is a key part of ecotourism as it supports smaller businesses and directs spending to local people rather than large travel companies who may engage in less sustainable practices.
Data shows that global travelers are interested in having cultural experiences and giving back to the local communities in places that they visit. Two-thirds (66%) of global travelers said they want an authentic experience representing the local culture, and 27% said they actively research a destination’s local culture before visiting.
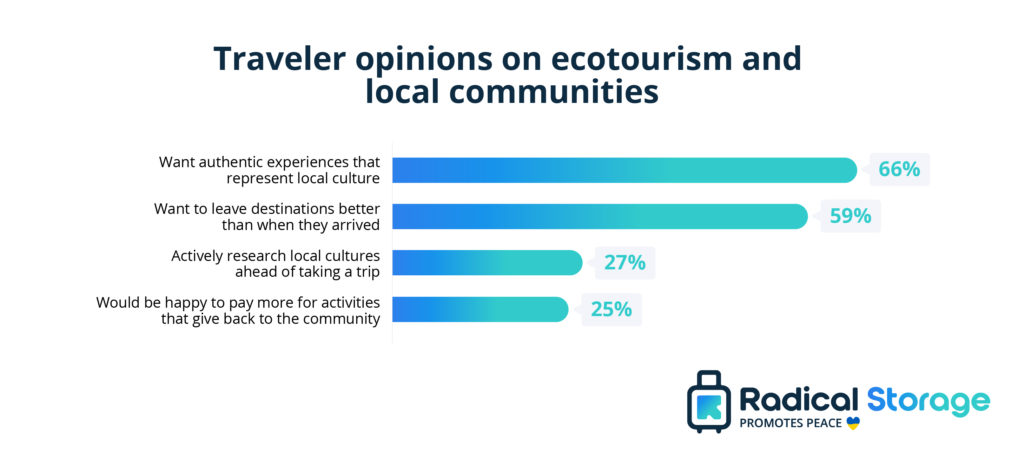
Another survey on travel predictions for 2022 found that 58% of travelers think it’s important that their trip benefits the local community, and 29% said that they would do more research into the effect their visit will have on local communities. [4]
Sustainable transport
When it comes to traveling, transport is one of the most important aspects to consider, especially if you’re making an effort to travel in a sustainable way. It is important to choose the train for long-distance travel: set down the car and depart from stations in London , Paris , Milan , Rome , Venice , Prague , Budapest , Edinburgh , Barcelona , Madrid , Amsterdam , Dublin or Valencia , so you can enjoy a more environmentally sustainable trip.
Below are some statistics surrounding sustainable transport and how people are planning to change modes of transport to reduce their carbon footprint.
Choosing modes of transport
Statistics show that 30% of global travelers feel bad or ashamed about flying when they travel because of the impact on the environment. Almost a quarter (22%) say they research public transport links or bike rental options when they travel, while 20% choose trains over cars for long journeys, and only 11% have rented a low-emissions car when traveling.
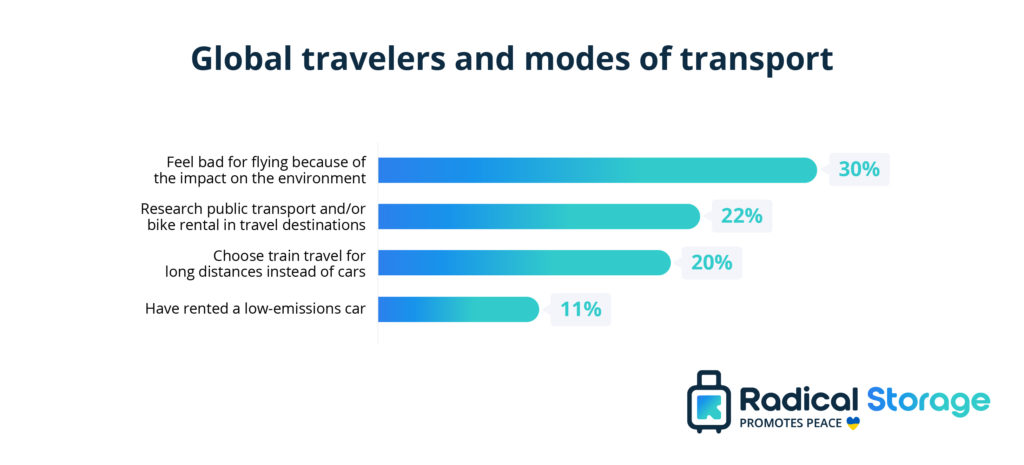
Planning transport for future trips
Of those asked, three-quarters (75%) of global travelers said they planned to use more eco-friendly transport like bikes or public transport on their next trip, instead of taxis and rental cars.
As well as this, 28% said they would take a longer journey to their destination by using trains instead of cars or planes, in order to reduce their carbon emissions.
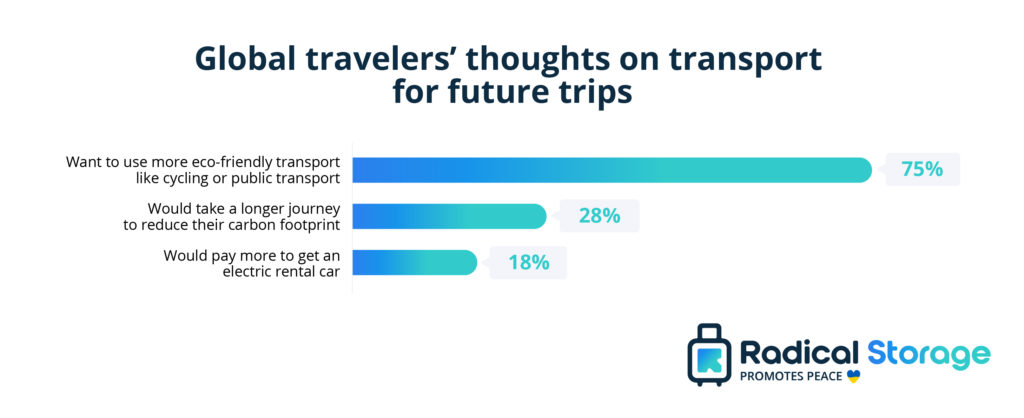
When it came to car rentals, 18% of respondents said they would pay more to rent an electric car instead of a gas car on their travels. There was no data on how much extra individuals would be willing to pay for this more eco-friendly tourism option though.
Ecotourism and staycations
Taking trips that are closer to home and require less travel via planes is one way of traveling more sustainably and with the environment in mind.
More than half (57%) of people said they would consider going on trips that weren’t as far afield in the future, and one-third (33%) would be willing to do so to reduce their carbon emissions. Almost a quarter (23%) said they have already chosen to travel to a destination closer to home in order to limit their effect on the environment.
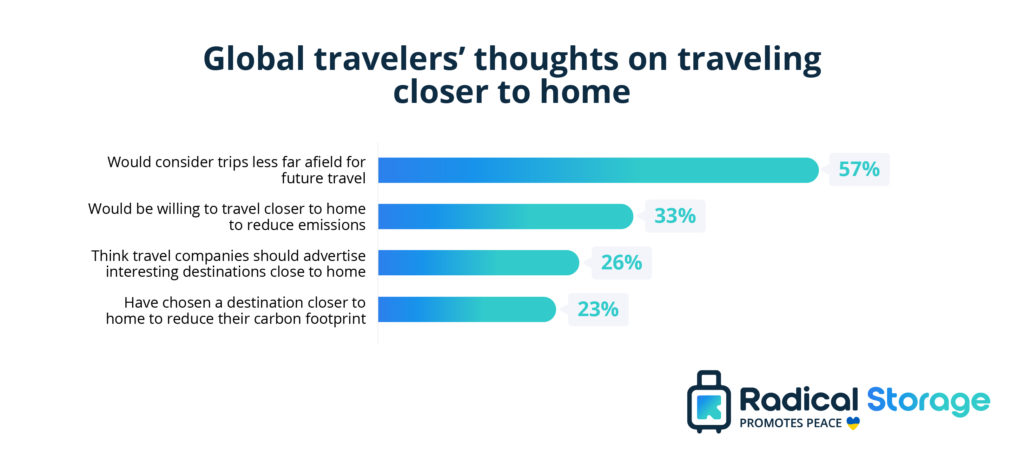
How travelers are being more sustainable on vacation
Travelers are taking a number of steps to make themselves more eco-friendly when taking a trip. Three-quarters (77%) regularly turn off lights and appliances at their accommodation when they weren’t there, and 67% turn off air conditioning. [6]
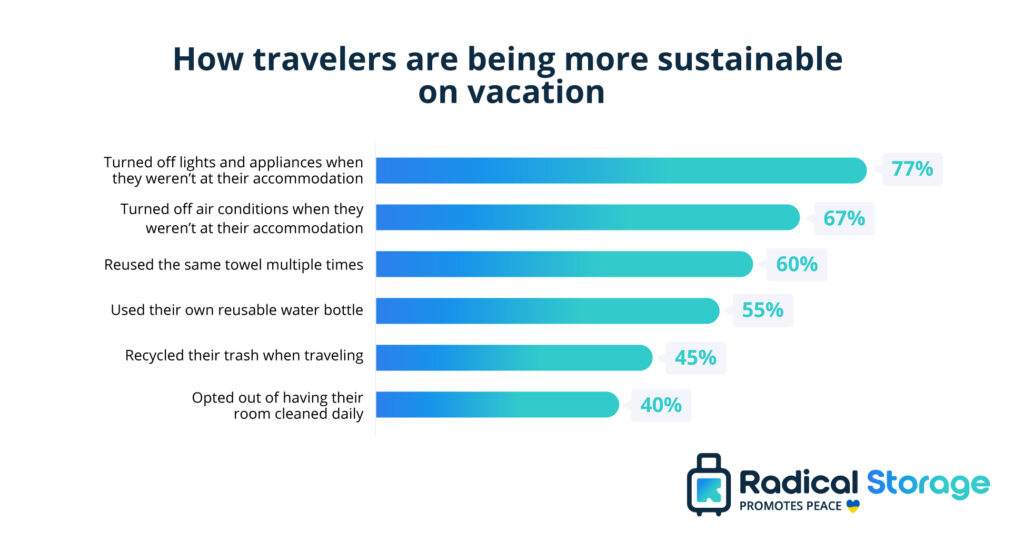
What accommodation providers can do to be more eco-friendly
Many travelers believe that hotels and other accommodation providers could do more to improve their sustainability.
- Over one-third (35%) of people said they think heating and air conditioning and hotels should be controlled by in-room keycards or sensors in order to save energy.
- Accommodation providers should give visitors more information about local culture, heritage, ecosystems and etiquette when visiting a location (32%).
- More than a quarter (27%) would choose to opt out of having their room cleaned daily so that water usage could be reduced.
- Some would prefer to only use reusable cutlery and plates for meals and room service rather than disposable items (27%).
While things like reducing water usage or cutting down on single-use items are relatively quick things to implement, other measures require more time and investment to achieve. In the short term, hotels can focus on simpler changes, but a longer-term sustainability plan would be needed for more complex changes.
2024 predictions for ecotourism
A study by Booking.com found that travelers are continuing to seek out sustainable ways to travel in 2024. More than half (53%) say they are looking for accommodation that combines comfort with innovative sustainability.
Additionally, 60% of travelers say they would like to use sustainable travel apps that unlock rewards for sustainable decisions. 44% say they’d like to visit less touristy spots and 47% say they’re planning experiences to connect with local people in less traveled areas. [7]
Benefits of sustainable travel
Ecotourism has a number of benefits for the environment and local communities as well as travelers. Below are some of the key benefits of sustainable travel.
- Less impact on the environment – Staying in locally run accommodation and eating local food helps reduce your ecological impact as you’re not relying on imported goods. By eating local produce and visiting independent restaurants, you can enjoy fresher food that has less of a carbon footprint.
- Supports local communities – Using sustainable accommodation and local companies, you support the community by directly paying into their economy. Many locations where tourism is operated by large companies can miss out on this financial benefit. Using providers who work with local people can help give this benefit directly back to the community.
- Helps conserve wildlife ethically – Some tourist attractions involving animals can be popular for visitors, but are not necessarily good for the animals themselves. A lot of attractions like elephant riding and tiger meet-and-greets are not run ethically, so sustainable tourism involves educating yourself about these practices. Instead, look for organisations focused on conservation and consider volunteering if you’d like to experience some amazing wildlife.
[1] The Business Research Company, ‘Ecotourism Global Market Report 2024’ ( https://www.thebusinessresearchcompany.com/report/ecotourism-global-market-report )
[2] Booking.com, ‘2022 Sustainable Travel Report’ ( https://globalnews.booking.com/download/1161485/booking.comsustainabletravelreport2022final.pdf )
[3] Travel Incorporated, ‘Sustainable Travel Doesn’t Have To Cost More’ ( https://www.travelinc.com/sustainable-travel-doesnt-have-to-cost-more/ )
[4] Booking.com, ‘2022 Travel Predictions’ ( https://www.booking.com/c/trends/travelpredictions2022.en-gb.html )
[5] Euromonitor International, ‘Top 100 City Destinations Index 2021’ ( https://go.euromonitor.com/rs/805-KOK-719/images/wpTop100CitiesIndex2021-v0.4.pdf )
[6] Booking.com, ‘Sustainable Travel Report 2023’ ( https://globalnews.booking.com/download/31767dc7-3d6a-4108-9900-ab5d11e0a808/booking.com-sustainable-travel-report2023.pdf )
[7] Booking.com, ‘Travel Predictions 2024’ ( https://www.booking.com/c/trends/travelpredictions2024.en-gb.html )

By Giacomo Piva
Giacomo Piva, CMO and Co-founder at Radical Storage Giacomo Piva has worked in the travel industry since 2008 across multiple niches including tourist transportation, luxury travel, and ecotourism. He now focuses on growing the global luggage network, Radical Storage , which is currently available in over 500 cities, in the likes of London, Paris, New York, and Rio de Janeiro. Giacomo has a bachelor's degree in Communication Science and an in-depth experience across travel marketing, especially in improving a brand’s digital presence within the industry.
Sustainable Tourism Statistics: 2023 Ultimate List Statistics and Trends
Three years on from the start of the global pandemic, the tourism sector is going from strength to strength. With the push to make up for lost time, a new profile of sustainable traveler has emerged, with environmental and ethical considerations now key factors in travel decision-making. In fact, 69% of tourists plan to travel sustainably in 2023.
This evolution in mindset comes at a time when responsible travel is urgently needed. Whether that means reducing your energy consumption or preserving the culture of a local community, sustainability is no longer a choice, but an imperative that will impact our society and the vacation rental industry in the years to come.
This needn’t be a struggle for vacation rental professionals, but instead is an opportunity to future-proof your business. With the global sustainable tourism industry valued at 181.1bn USD, it’s time to take steps towards an environmentally sustainable vacation rental business.
In this article, we’ve put together some of the most important sustainable tourism statistics and trends to help professional property managers to be at the forefront of the hospitality industry.

What is ecotourism?
The World Tourism Organization (UNWTO) describes sustainable tourism as “tourism that takes full account of its current and future economic, social and environmental impacts, addressing the needs of visitors, the industry, the environment, and host communities” .
This type of responsible travel, also known as ecotourism , has become increasingly popular in recent years, with reports showing that 81% of travelers worldwide believe that sustainable travel is important .
For property managers seeking to align with traveler values and appeal directly to this sector – undertaking sustainable habits is a crucial step.
Which countries are most sustainable?
According to the 2022 Sustainable Development Report , the countries with the highest overall performance on the 17 Sustainable Development Goals (SDGs) were:
While these results are mainly due to proactive governments that develop protective policies and regulations against climate change, they can still be used as inspiration by countries whose decision-making representatives have failed to take action.
In Finland, for example, people have a deep appreciation for nature and connect with it at a very early age. This mindset is intensified in their adult life and results in a population that fights to protect their environment and preserve natural resources.
As stakeholders of global tourism, property managers can take small steps towards promoting this mentality to guests by starting a garden or recommending a variety of nature escapes that focus on the biodiversity of the area.

Sustainable Tourism Statistics Shaping the Travel Industry
We’ve gathered relevant sustainable tourism statistics and trends that are quickly shaping the vacation rental industry and tourism sector.
Professional property managers around the world can use this knowledge to boost their vacation rental business. That’s because, aside from taking care of your surrounding environment, economy, and society, sustainable actions also increase your vacation rental profitability by targeting an emerging group of conscious global travelers.
1. Guests need clarity on sustainable travel
Recent stats suggest that 61% of travelers are interested in learning more about ecotourism, whereas only 46% feel clear on how to actually arrange sustainable trips . This is where property managers can help out. By making it clear which steps have been taken to make your vacation rentals more eco-friendly, you’re helping guests to make informed decisions about their travel.
If in doubt about where to begin, consider seeking guidance from vacation rental sustainability experts , who can offer free resources to help you go green.
2. Guests are actively seeking eco-friendly accommodation
A survey of travelers’ plans for 2023 saw that 78% planned to stay in eco-friendly accommodation this year.
Further, recent studies suggest that pro-sustainable tourists are prepared to pay more for green stays. This not only suggests the potential for increased revenue at sustainable vacation rentals, but also the opportunity to offset any costs associated with switching to more green practices.
Communicating what steps have been made to make a property eco-friendly will help your vacation rental business stand out from competitors and increase bookings. Whether that be on your website or in listing descriptions, be sure to clearly highlight what efforts have gone into this sustainable experience.
To kick-start your inspiration, here are just a few simple things you can try to reduce the carbon footprint of your rental properties.
- Make eco-friendly changes such as using energy-efficient appliances
- Invest in smart home technology to reduce energy waste
- Make recycling options clear
- Provide bicycles and other sustainable transportation options (a big plus for any luxury vacation rental )
For more tips on how to go green, check out our article on how to guarantee a sustainable vacation rental .
3. Here’s what they expect from you:
According to Booking.com’s latest Sustainable Travel Report , travelers expect more from accommodation providers and property managers than ever before:
- 35% believe that air conditioners and heaters should be controlled by keycards or energy-saving sensors.
- 32% think that accommodation providers should offer information on local ecosystems, heritage, culture, and visitor etiquette.
- 27% want to be able to opt out of daily room cleaning to reduce water usage.
- 27% would only like to use reusable plates and cutlery for meals and room service.
While some of these adaptations can be applied immediately, such as cutting out single-use products, others may require more time, effort, and money. For the best results, work on changes that are feasible at the moment and create a long-term sustainability plan for improvements that you’d like to achieve in the future.
4. Guests are prepared to go off-peak and off-path
40% of travelers are now prepared to travel exclusively outside of peak season , and 64% are willing to consider less-popular destinations to reduce overcrowding and adverse environmental impact. This indicates a step away from busy resort vacations, and a preference for quieter, more authentic experiences, in harmony with sustainable practices.
However, 42% of prospective travelers state that it can be difficult to find uncrowded destinations, and 34% have struggled to find sustainable options, suggesting an opportunity for travel providers to highlight and promote sustainable properties which are worth visiting outside of standard seasons.

5. Prioritizing immersion in nature and local culture
As travelers seek to avoid mass tourism and the environmental consequences that come with it, 80% are now expressing a desire to learn about the local culture when on vacation and 76% would like to feel that they’re reconnecting with nature.
Property managers could appeal to this emerging profile of guests by offering the option of:
- A local area guide with insider tips and recommendations for authentic restaurants, hidden gems, cultural tours, and events.
- Partnerships with local companies and responsible tour operators that offer a variety of activities such as bike tours, cooking classes, and language exchanges
- Easy-to-follow routes and maps for approved nature trails that guests can use to explore the area on their own.
6. Guests’ environmental concerns vary
When we think of the environmental impact of travel, CO2 emissions are usually the main concern. However, only 29% of travelers have cited this as a source of worry, compared with 30% who are concerned about overtourism, 38% who are conscious of threats to wildlife and natural habitats, and 46% worried about creating excess waste.
Vacation rental professionals can offset this biggest concern by taking steps to reduce the waste associated with a guest’s stay. Consider installing a water filter to avoid plastic bottles, provide eco-friendly and reusable shopping bags, and create a list of local produce markets in the area that guests can visit for a plastic-free experience.
7. Partnering with local businesses is the way forward
During their travels, 42% of people make a point of shopping at small businesses to support the local economy.
To further encourage this trend, you can buy toiletries, kitchen essentials, bedding, and furniture from independent, local businesses instead of ordering online or opting for mass-producing chains.
Drive extra revenue by upselling services and experiences like group yoga sessions or snorkeling tours. All it takes is a partnership with a local company to positively impact the economy and earn more money.
8. Travel companies are expected to step up
When asked about who is accountable for making positive environmental changes regarding travel, 26% responded with the government, 23% said tourism authorities , and 20% mentioned themselves, 8% said accommodation providers, and 6% said online travel agents.
Travel companies have already started taking action, which can be seen through the Future of Tourism Coalition . This coalition was formed by six non-profit organizations to create a set of principles that will enforce sustainable growth within the international tourism industry.
Sustainable tourism statistics for a greener future
Staying on top of the latest trends and keeping up to date with vacation rental statistics, is a crucial part of any successful property manager’s job, especially when it comes to sustainable tourism. With the right information based on sustainable tourism statistics, you can implement conscious changes that help your business grow and also leave a positive impact on the environment, economy, and society.

Interested?
Explore our vacation rental software, optimize your business with our all-in-one solution.
Check out our Property Management Software
Reach more guests with over 50 connected portals
Discover the Vacation Rental Channel Manager
Discover the options to increase your direct bookings
Customize your Vacation Rental Website
- Sustainable Tourism Statistics: 2023 Ultimate List Statistics and Trends 14/03/2023
- How Avantio’s vacation rental management software became the Preferred Partner of top global OTAs 27/04/2022
- What to include in a vacation rental welcome book 30/03/2022
RECENT POSTS

Tips and tricks for Airbnb: a 2024 hosting guide

- Channel Manager
- Unified Inbox
- Payment Management
- Operations Management Tool
- Google Vacation Rentals
- Revenue Calendar
- Check-in Online
- Marketplace
- Work with us
- Referral Program
- Brand Guidelines
- Pillars of Sustainability
Get in Touch
- Book a demo
In support of
ALEP AIGAB APAR APARTURE APTUR ASCAV ATA AVVA CLF FEVITUR ISCF STAA STAMA VDFA VRMA SPLM AVAT FAVR NWVRP
© 2023 Avantio Privacy Policy Terms and Conditions Cookies Policy
- Increase your direct bookings
- Build guest loyalty
- Increase your revenue
- Planet Payment Gateway

- Sustainability course

19 of the most surprising statistics about tourism
I t’s World Tourism Day, a time – these days – for much pontificating about sustainability and the impact of travel upon the planet. Instead, we’re going to take a look at some of the more surprisingly facts about the tourism industry. It’s all perfect fodder for your next pub quiz.
Aviation accounts for just 2 per cent of global carbon emissions
But first, a word on sustainability. Alongside giving up meat, taking fewer flights is usually billed as the best way for individuals to cut their carbon footprint, and with the recent “flight shaming” trend, it can feel like we’re being collectively bullied to stay on the ground. All of which might lead one to assume that aviation accounts for a considerable chunk of global emissions. The actual figure, therefore, may be smaller than you’d imagine. In 2022 aviation, when the industry reached 80 per cent of pre-pandemic levels, it accounted for just 2 per cent of global carbon emissions.
By 2030, one in four tourists will be Chinese
A few years ago, the China Outbound Tourism Research Institute (COTRI) predicted that overseas trips by the country’s residents would increase from 145m a year to more than 400m by 2030. In other words, it would account for around a quarter of international tourism. The pandemic put the brakes on such staggering growth, but expect things to start picking up again – fast.
Saudi Arabia wants to surpass France as a holiday destination
Speaking of 2030, that is the year when Saudi Arabia wants to start welcoming 100m annual visitors – more than the record 91.1m France, the world’s most visited country, welcomed in 2019. It’s all part of Vision 2030, the state’s grand plan to jettison its overreliance on oil. Central to that plan will be the launch of Riyadh Air, to take on the likes of Emirates, the construction of a vast new airport designed to accommodate up to 120m annual passengers, and the creation of two new coastal “cities” – Amaala and Neom – to lure sunseekers .
France’s number two tourist town?
Paris is number one – naturellement. But number two isn’t Bordeaux, Nice or Marseille. It’s Lourdes, a town of 13,000 residents that manages to attract 6m visitors every year thanks to the apparitions of a peasant girl called Bernadette. It has 279 hotels to choose from, according to Booking.com – only the French capital has more.
Only 0.07 per cent of the world’s population have been to Antarctica
You get that rough figure if you divide the number of people who visit Antarctica each year (100,000) by the number of people born each year (140m). But even fewer have been to the least visited country on Earth, Tuvalu – just 0.0026% of us (or 3,700 people a year).
More Britons visit the Canary Islands each year than Italy
Lying on a hot volcanic rock? It’s better than Rome, Florence, Venice, Tuscany, the Dolomites, the Cinque Terre and the Amalfi Coast rolled into one. That’s according to official figures which show that around 5m of us go to the Canaries each year, compared with the 4.1m who visit Italy.
The biggest hotel on Earth is not in Las Vegas
Twelve of the world’s 20 largest hotels, in terms of total rooms, are found in Sin City. But number one, the First World Hotel (which has a staggering 7,351 rooms), is somewhere rather more obscure. The Genting Highlands of Malaysia. It will soon lose the record, however. The US$3.5 billion Abraj Kudai in Mecca, under construction since 2015, will have 10,000 rooms.
And Macau makes more money from gambling tourists than Las Vegas
Another win for Asia. Macau has earned a reputation as the “Monte Carlo of the Orient”. Chinese games – like Fan Tan , a version of roulette – traditionally dominated its casinos, but the last 20 years have seen a move to embrace the many western-style ways of parting the punter from their money – to the extent that, in 2007, Macao overtook the Las Vegas Strip on gambling revenues.
Which is the most luxurious place on Earth?
What – or where – is the most luxurious place on earth? New York? Dubai? Abu Dhabi? Obviously, the answer depends on how you are defining “luxurious”. But if the key metric is “city with the greatest number of five-star hotels”, then the identity of the most gleaming metropolis may surprise you. It used to be London, but as of earlier this month, and the release of the 2023 edition of jet-set bible the Forbes Travel Guide , the place in focus is – again – Macau. Said chic dot on the map of the Far East now boasts 22 hotels in the uppermost bracket.
Inverness is more popular than Stratford-upon-Avon
With its Shakespeare connections, surely Stratford-upon-Avon welcomes more tourists than plucky little Inverness? Not so, according to VisitBritain. London is number one, by a mile (21.7m overnight visitors in 2019, the last “normal” year), followed by Edinburgh (2.2m), Manchester (1.6m) and Birmingham (1.1m). Stratford lags way down in 17th, with 271,000 arrivals, just below Inverness (which, we assume, is used by many as a launch pad for jaunts around the Highlands).
And Reading trumps Windsor
Both are in Berkshire, but only one can boast the largest inhabited castle on the planet, Britain’s branch of Legoland, and a picturesque riverside racecourse. Yet it is Reading that makes VisitBritain’s top 20 (237,000 visitors in 2019) at the expense of Windsor.
The Maldives really needs your money
The value of tourism to the Maldivian economy is more than US$2bn – or 32.5 per cent of its GDP. Only one destination (hello again Macau) is more reliant on your money . Needless to say, the last few years have been a struggle.
Tourists outnumber locals by 7,853 to 1 in the Vatican City
The Vatican City has just 764 permanent inhabitants, measures a titchy 0.2 square miles, and receives – according to some sources – 6m visitors a year. That’s 7,853 tourists per resident or 31.58m per square mile.
Bangladesh is the world’s least touristy country
At the other end of the scale is Bangladesh. With a population of 169.8m but only 323,000 annual visitors, it welcomes just 0.002 tourists per resident per year, making it perhaps the least touristy country on Earth.
Iran has 25 World Heritage Sites
This won’t surprise anyone who has been there – it’s a fascinating place packed with history (though currently off-limits, according to the Foreign Office). But those who don’t know it well might raise an eyebrow to learn that it trumps the likes of Japan, the US and Greece when it comes to World Heritage Sites .
Bicester Village is almost as popular as Buckingham Palace
Among Chinese visitors that is. Travellers from the world’s most populous country have some other curious destinations on their wishlist . Around 150,000 visit Trier every year, for example, making it the most sought-after German destination among Chinese globetrotters. Why? It is the birthplace of Karl Marx, of course. And Montargis, a small town south of Paris, is also inexplicably popular. That’s because hundreds of young Chinese scholars studied there in the early part of the 20th century, including many future stars of China’s Communist Party.
English really is the global language
Thanks to a combination of empire, mass tourism and invasive Western culture, English really is the global language. According to David Crystal’s book English as a Global Language, at least half the population of 45 countries speak it. There are also just 13 countries where fewer than 10 per cent of the population speak English, including China, Colombia, Brazil and Russia.
16 of the world’s 30 busiest airports are American
A combination of international travel slowdown and America’s ravenous appetite for flying meant that in 2022, 16 of the world’s 30 busiest airports (in terms of total passenger numbers) were on US soil. Number one, as it has been each year since 1998 (except for 2020, when it was temporarily unseated by Guangzhou Baiyun International Airport), was Hartsfield–Jackson Atlanta International Airport (93.7m passengers for 2022).
Albania is already welcoming more tourists than in 2019
The pandemic saw tourism slump across the planet, but some countries have recovered far quicker than others. They include Turkey, the fourth most visited country in 2022 (50.5m overseas arrivals, a shade under its 2019 figure of 51.2m), the UAE (22.7m arrivals in 2022 vs 21.6m in 2019) and, perfect for budget sunshine, Albania (6.7m arrivals in 2022 vs 6.1m in 2019).
Sign up to the Front Page newsletter for free: Your essential guide to the day's agenda from The Telegraph - direct to your inbox seven days a week.

UN Tourism | Bringing the world closer
- SUSTAINABLE DEVELOPMENT
- Competitiveness
- Innovation and Investments
- ETHICS, CULTURE AND SOCIAL RESPONSIBILITY
- TECHNICAL COOPERATION
- UN Tourism ACADEMY
share this content
- Share this article on facebook
- Share this article on twitter
- Share this article on linkedin
Sustainable development
"Tourism that takes full account of its current and future economic, social and environmental impacts, addressing the needs of visitors, the industry, the environment and host communities"
Sustainable tourism development guidelines and management practices are applicable to all forms of tourism in all types of destinations, including mass tourism and the various niche tourism segments. Sustainability principles refer to the environmental, economic, and socio-cultural aspects of tourism development, and a suitable balance must be established between these three dimensions to guarantee its long-term sustainability.
Thus, sustainable tourism should:
- Make optimal use of environmental resources that constitute a key element in tourism development, maintaining essential ecological processes and helping to conserve natural heritage and biodiversity.
- Respect the socio-cultural authenticity of host communities, conserve their built and living cultural heritage and traditional values, and contribute to inter-cultural understanding and tolerance.
- Ensure viable, long-term economic operations, providing socio-economic benefits to all stakeholders that are fairly distributed, including stable employment and income-earning opportunities and social services to host communities, and contributing to poverty alleviation.
Sustainable tourism development requires the informed participation of all relevant stakeholders, as well as strong political leadership to ensure wide participation and consensus building. Achieving sustainable tourism is a continuous process and it requires constant monitoring of impacts, introducing the necessary preventive and/or corrective measures whenever necessary.
Sustainable tourism should also maintain a high level of tourist satisfaction and ensure a meaningful experience to the tourists, raising their awareness about sustainability issues and promoting sustainable tourism practices amongst them.
COMMITTEE ON TOURISM AND SUSTAINABILITY (CTS)
Biodiversity
UN Tourism strives to promote tourism development that supports, in equal measure, the conservation of biodiversity, the social welfare and the economic security of the host countries and communities.
Climate Action
Tourism is both highly vulnerable to climate change while at the same time contributing to it. Threats for the sector are diverse, including direct and indirect impacts such as more extreme weather events, increasing insurance costs and safety concerns, water shortages, biodiversity loss and damage to assets and attractions at destinations, among others.
Global Tourism Plastics Initiative
The problem of plastic pollution in tourism is too big for any single organisation to fix on its own. To match the scale of the problem, changes need to take place across the whole tourism value chain.
Hotel Energy Solutions (HES)
Hotel Energy Solutions (HES) is a UN Tourism -initiated project in collaboration with a team of United Nations and EU leading agencies in Tourism and Energy .
Observatories (INSTO)
The UN Tourism International Network of Sustainable Tourism Observatories (INSTO) is a network of tourism observatories monitoring the economic, environmental and social impact of tourism at the destination level.
When responsibly planned and managed, tourism has demonstrated its capacity to support job creation, promote inclusive social integration, protect natural and cultural heritage, conserve biodiversity, generate sustainable livelihoods and improve human wellbeing. As the sector is experiencing tremendous growth, collective efforts to ensure its long-term sustainability are essential.
Resource Efficiency in Tourism
The report aims to inspire stakeholders and encourage them to advance the implementation of the SDGs through sustainable tourism.
Small Islands Developing States (SIDS)
Small Island Developing States face numerous challenges. For a significant number, their remoteness affects their ability to be part of the global supply chain, increases import costs - especially for energy - and limits their competitiveness in the tourist industry. Many are increasingly vulnerable to the impacts of climate change - from devastating storms to the threat of sea level rise.
Travel facilitation
Travel facilitation of tourist travel is closely interlinked with tourism development and can be a tool to foster increased demand and generate economic development, job creation and international understanding.
UNGA Sustainable Tourism Resolutions
The UN Tourism is regularly preparing reports for the General Assembly of the United Nations providing updates on sustainable tourism policies both from UN Tourism member States and States Members of the United Nations, as well as relevant agencies and programmes of the United Nations system.
Travel, Tourism & Hospitality
Sustainable tourism in Italy - statistics & facts
How do italians feel about sustainable tourism, what is “agritourism”, key insights.
Detailed statistics
Familiarity with sustainable tourism among Italians 2011-2023
Perceived environmental issues of tourism according to Italians 2023
Italian tourists considering eco-friendly aspects when planning trips 2011-2023
Editor’s Picks Current statistics on this topic
Current statistics on this topic.
Opinions on the environmental impact of tourism in Italy 2011-2023
Related topics
Recommended.
- Sustainable tourism worldwide
- Sustainable food industry
- Travel and tourism in Europe
- COVID-19: impact on the tourism industry worldwide
Recommended statistics
- Premium Statistic Familiarity with sustainable tourism among Italians 2011-2023
- Premium Statistic Opinions on the environmental impact of tourism in Italy 2011-2023
- Premium Statistic Perceived environmental issues of tourism according to Italians 2023
- Premium Statistic Italian tourists considering eco-friendly aspects when planning trips 2011-2023
- Premium Statistic Favorite transports seen as alternative to cars among Italians vacationers 2023
Share of individuals who reported being familiar with sustainable tourism in Italy from 2011 to 2023
Opinions on the environmental impact of tourism in Italy from 2011 to 2023
Perceived environmental issues caused by tourism according to Italians in 2023
Share of Italian tourists who consider environmentally friendly aspects when planning trips from 2011 to 2023
Favorite transports seen as alternative to cars among Italians vacationers 2023
Preferred transports seen as alternative to cars for short-haul holidays among Italians in 2023
Eco-friendly tourist facilities
- Premium Statistic Share of Italians interested in eco-friendly accommodation 2011-2023
- Premium Statistic Most appreciated services by eco-tourism hotels according to Italians 2023
- Premium Statistic Main features of eco-friendly hotels according to Italians 2023
- Premium Statistic Main features of sustainable restaurants according to Italians 2019
Share of Italians interested in eco-friendly accommodation 2011-2023
Share of Italian individuals who were interested in eco-friendly tourist accommodation establishments from 2011 to 2023
Most appreciated services by eco-tourism hotels according to Italians 2023
Most appreciated services offered by eco-tourism hotels according to Italians in 2023
Main features of eco-friendly hotels according to Italians 2023
Main features of eco-friendly hotels according to Italians in 2023
Main features of sustainable restaurants according to Italians 2019
Main features of sustainable restaurants according to Italian individuals in 2019
Agritourism
- Premium Statistic Number of agritourism establishments in Italy 2012-2022
- Premium Statistic Number of agritourism facilities in Italy 2016-2020, by type
- Premium Statistic Number of beds in agritourism establishments in Italy 2010-2022
- Premium Statistic Tourist arrivals in agritourism establishments in Italy 2015-2022, by tourist type
- Premium Statistic Arrivals in agritourism establishments in Italy 2022, by region
- Premium Statistic Overnight stays in agritourism establishments in Italy 2015-2022, by tourist type
- Premium Statistic Tourist overnight stays in agritourism establishments in Italy 2019-2022, by region
Number of agritourism establishments in Italy 2012-2022
Number of agritourism establishments in Italy from 2012 to 2022
Number of agritourism facilities in Italy 2016-2020, by type
Number of agritourism facilities in Italy from 2016 to 2020, by type
Number of beds in agritourism establishments in Italy 2010-2022
Number of beds available in agritourism establishments in Italy from 2010 to 2022 (in 1,000s)
Tourist arrivals in agritourism establishments in Italy 2015-2022, by tourist type
Number of tourist arrivals in agritourism establishments in Italy from 2015 to 2022, by type of tourist (in 1,000s)
Arrivals in agritourism establishments in Italy 2022, by region
Number of arrivals in agritourism establishments in Italy in 2022, by region
Overnight stays in agritourism establishments in Italy 2015-2022, by tourist type
Number of tourist overnight stays in agritourism establishments in Italy from 2015 to 2022, by type of tourist (in 1,000s)
Tourist overnight stays in agritourism establishments in Italy 2019-2022, by region
Number of tourist overnight stays in agritourism facilities in Italy from 2019 to 2022, by region (in 1,000s)
Educational farms
- Premium Statistic Number of educational farms in Italy 2017-2020
- Premium Statistic Number of educational farms in Italy 2020, by region
- Premium Statistic Agritourism facilities offering educational farm activities in Italy 2010-2019
Number of educational farms in Italy 2017-2020
Number of educational farms in Italy from 2017 to 2020
Number of educational farms in Italy 2020, by region
Number of educational farms in Italy in 2020, by region
Agritourism facilities offering educational farm activities in Italy 2010-2019
Number of agritourism facilities offering educational farm activities in Italy from 2010 to 2019
Cycling tourism
- Premium Statistic Overnight stays of tourist cycling in Italy 2019, by nationality
- Premium Statistic Spending of tourist cycling on holiday in Italy 2019, by nationality
- Premium Statistic Distribution of domestic tourists cycling on summer vacations in Italy 2020, by type
- Premium Statistic Share of domestic tourists cycling on summer vacations in Italy 2020, by bike type
Overnight stays of tourist cycling in Italy 2019, by nationality
Number of overnight stays by tourists cycling on holiday in Italy in 2019, by nationality (in millions)
Spending of tourist cycling on holiday in Italy 2019, by nationality
Spending of tourists cycling on holiday in Italy in 2019, by nationality (in billion euros)
Distribution of domestic tourists cycling on summer vacations in Italy 2020, by type
Distribution of domestic tourists cycling on summer holidays in Italy in 2020, by type of traveler
Share of domestic tourists cycling on summer vacations in Italy 2020, by bike type
Distribution of domestic tourists cycling on summer holidays in Italy in 2020, by type of bicycle
- Premium Statistic Main reasons for hiking in Italy 2020
- Premium Statistic Favorite accommodations among hikers in Italy 2020
- Premium Statistic Distribution of hikers in Italy 2020, by average daily spending
- Premium Statistic Main items purchased before a trip by hiking tourists in Italy 2020
Main reasons for hiking in Italy 2020
Main reasons for hiking according to individuals hiking in Italy in 2020
Favorite accommodations among hikers in Italy 2020
Preferred accommodations among individuals hiking in Italy in 2020
Distribution of hikers in Italy 2020, by average daily spending
Distribution of individuals hiking in Italy in 2020, by average daily spending
Main items purchased before a trip by hiking tourists in Italy 2020
Main items purchased before a trip by hiking tourists in Italy in 2020
Further reports Get the best reports to understand your industry
Get the best reports to understand your industry.
Mon - Fri, 9am - 6pm (EST)
Mon - Fri, 9am - 5pm (SGT)
Mon - Fri, 10:00am - 6:00pm (JST)
Mon - Fri, 9:30am - 5pm (GMT)
IMAGES
COMMENTS
Statistics; Sustainable tourism, also known as ecotourism, or green tourism, is a form of tourism that attempts to take responsibility for its current and future economic, social, and ...
The Statistical Framework for Measuring the Sustainability of Tourism (MST) is an internationally agreed reference framework for measuring the economic, social and environmental aspects of tourism. As a living example of going beyond GDP, MST supports the production in countries of reliable, internationally comparable data on the performance of ...
The Statistical Framework for MST is an internationally-agreed framework describing the main concepts, definitions and data organization structures to support the production and organization of data on the impacts and dependencies of tourism on the economy, society and the environment. The Framework has been endorsed by the United Nations ...
UN Tourism systematically collects tourism statistics from countries and territories around the world in an extensive database that provides the most comprehensive repository of statistical information available on the tourism sector. This database consists mainly of more than 145 tourism indicators that are updated regularly. You can explore the data available through the UNWTO database below:
Statistics; Sustainable tourism is defined by the UN World Tourism Organization and UN Environment Program as "tourism that takes full account of its current and future economic, social and ...
Tourism Statistics. Get the latest and most up-to-date tourism statistics for all the countries and regions around the world. Data on inbound, domestic and outbound tourism is available, as well as on tourism industries, employment and complementary indicators. All statistical tables available are displayed and can be accessed individually ...
Conference on Tourism Statistics - Measuring Sustainable Tourism, was a landmark moment. More than 80 countries committed, through the Manila Call for Action, to join us on this journey. This is a clear signal that the desire to move successfully towards measuring sustainable tourism can be
Reliable and comparable metrics are increasingly needed to better understand the complex economic, social and environmental aspects of tourism for sustainable development. "Measuring the Sustainability of Tourism - Lessons from Pilots" draws on 12 case studies from around the world. In each case, they show how tourism's impacts are ...
Measuring the Sustainability of Tourism was the overall theme of the 6th International Conference on Tourism Statistics held in Manila, Philippines, in June 2017. The Conference is considered a historical milestone for tourism statistics. It gathered over 1,500 leaders and
Travellers want greener holidays in a post-pandemic world. The biggest elephant in the room when it comes to sustainable travel is flying, as around 2% of global carbon emissions come from the aviation industry. This is a growing concern for holiday-makers, as 69% say they are committed to reducing the carbon footprint of their trip or paying to offset their travel whenever possible.
Sustainability in tourism is a topic of global relevance, finding multiple mentions in the United Nations Sustainable Development Goals. The complex task of balancing tourism's economic, environmental, and social effects requires detailed and up-to-date data. This paper investigates whether online platform data can be employed as an alternative data source in sustainable tourism statistics ...
The Statistical Framework for Measuring the Sustainability of Tourism (MST) thus becomes the internationally agreed reference framework for measuring the economic, social and environmental aspects of tourism. The adoption by the UN Statistical Commission at its 55th session (27 February - 1 March 2024) marks a historical milestone towards ...
Conscious travelers' challenges when traveling in a sustainable manner worldwide 2022. Environmental impact. Basic Statistic Global carbon dioxide emissions from energy 1965-2022, by region ...
Sustainable travel statistics: what industry professionals need to know about the 'new norm' in travel and tourism. ... While the term "sustainable tourism" is tossed around with increasing frequency, many professionals have only a vague understanding of what sustainability really means. Essentially, sustainable travel refers to tourism that ...
sustainability and track changes occurring in destinations over time •Collective of 45 criteria with 122 corresponding indicators organized around four key pillars of sustainability: -Sustainable destination management issues -Social and economic issues -Community and cultural heritage issues -Environmental Issues One global standard.
Key ecotourism statistics. The global ecotourism market size is expected to have increased by 13.5% to $249.16 billion in 2024, from $219.53 billion in 2023, and is predicted to reach $428.97 billion in 2028. Choosing sustainable accommodation costs an average of $151 less per night, and was an average of 39% cheaper than non-sustainable options.
The perspectives of big data in tourism that have been explored in this literature review were sustainable hotel management, urban, regional, cultural and sustainable tourism, sustainable holiday trips and cycling habits, sustainable tourism transportation, sustainable travel behaviour, tourism through social network and smart cities (Line et ...
The UNWTO Statistics Department is committed to developing tourism measurement for furthering knowledge of the sector, monitoring progress, evaluating impact, promoting results-focused management, and highlighting strategic issues for policy objectives.. The department works towards advancing the methodological frameworks for measuring tourism and expanding its analytical potential, designs ...
Sustainable tourism statistics for a greener future. Staying on top of the latest trends and keeping up to date with vacation rental statistics, is a crucial part of any successful property manager's job, especially when it comes to sustainable tourism. With the right information based on sustainable tourism statistics, you can implement ...
Globally, travel and tourism's direct contribution to gross domectic product (GDP) was approximately 7.7 trillion U.S. dollars in 2022. This was a, not insignificant, 7.6 percent share of the ...
Launched at the High-Level Political Forum on Sustainable Development, which this year is held around the theme of 'building back better' from the pandemic, the UN reports draw on UNWTO's statistical work to track tourism's role in delivering meaningful progress for people and the planet. Specifically, the UN SG Progress report on SDGs ...
Aviation accounts for just 2 per cent of global carbon emissions. But first, a word on sustainability. Alongside giving up meat, taking fewer flights is usually billed as the best way for ...
Sustainable tourism development requires the informed participation of all relevant stakeholders, as well as strong political leadership to ensure wide participation and consensus building. Achieving sustainable tourism is a continuous process and it requires constant monitoring of impacts, introducing the necessary preventive and/or corrective ...
Statistics; Sustainable tourism refers to the idea of having a positive impact on the environment, economy, and society while traveling. By encouraging the use of sustainable transport, as well as ...