Reimagining the $9 trillion tourism economy—what will it take?
Tourism made up 10 percent of global GDP in 2019 and was worth almost $9 trillion, 1 See “Economic impact reports,” World Travel & Tourism Council (WTTC), wttc.org. making the sector nearly three times larger than agriculture. However, the tourism value chain of suppliers and intermediaries has always been fragmented, with limited coordination among the small and medium-size enterprises (SMEs) that make up a large portion of the sector. Governments have generally played a limited role in the industry, with partial oversight and light-touch management.
COVID-19 has caused an unprecedented crisis for the tourism industry. International tourist arrivals are projected to plunge by 60 to 80 percent in 2020, and tourism spending is not likely to return to precrisis levels until 2024. This puts as many as 120 million jobs at risk. 2 “International tourist numbers could fall 60-80% in 2020, UNWTO reports,” World Tourism Organization, May 7, 2020, unwto.org.
Reopening tourism-related businesses and managing their recovery in a way that is safe, attractive for tourists, and economically viable will require coordination at a level not seen before. The public sector may be best placed to oversee this process in the context of the fragmented SME ecosystem, large state-owned enterprises controlling entry points, and the increasing impact of health-related agencies. As borders start reopening and interest in leisure rebounds in some regions , governments could take the opportunity to rethink their role within tourism, thereby potentially both assisting in the sector’s recovery and strengthening it in the long term.
In this article, we suggest four ways in which governments can reimagine their role in the tourism sector in the context of COVID-19.

1. Streamlining public–private interfaces through a tourism nerve center
Before COVID-19, most tourism ministries and authorities focused on destination marketing, industry promotions, and research. Many are now dealing with a raft of new regulations, stimulus programs, and protocols. They are also dealing with uncertainty around demand forecasting, and the decisions they make around which assets—such as airports—to reopen will have a major impact on the safety of tourists and sector employees.
Coordination between the public and private sectors in tourism was already complex prior to COVID-19. In the United Kingdom, for example, tourism falls within the remit of two departments—the Department for Business, Energy, and Industrial Strategy (BEIS) and the Department for Digital, Culture, Media & Sport (DCMS)—which interact with other government agencies and the private sector at several points. Complex coordination structures often make clarity and consistency difficult. These issues are exacerbated by the degree of coordination that will be required by the tourism sector in the aftermath of the crisis, both across government agencies (for example, between the ministries responsible for transport, tourism, and health), and between the government and private-sector players (such as for implementing protocols, syncing financial aid, and reopening assets).
Concentrating crucial leadership into a central nerve center is a crisis management response many organizations have deployed in similar situations. Tourism nerve centers, which bring together public, private, and semi-private players into project teams to address five themes, could provide an active collaboration framework that is particularly suited to the diverse stakeholders within the tourism sector (Exhibit 1).
We analyzed stimulus packages across 24 economies, 3 Australia, Bahrain, Belgium, Canada, Egypt, Finland, France, Germany, Hong Kong, Indonesia, Israel, Italy, Kenya, Malaysia, New Zealand, Peru, Philippines, Singapore, South Africa, South Korea, Spain, Switzerland, Thailand, and the United Kingdom. which totaled nearly $100 billion in funds dedicated directly to the tourism sector, and close to $300 billion including cross-sector packages with a heavy tourism footprint. This stimulus was generally provided by multiple entities and government departments, and few countries had a single integrated view on beneficiaries and losers. We conducted surveys on how effective the public-sector response has been and found that two-thirds of tourism players were either unaware of the measures taken by government or felt they did not have sufficient impact. Given uncertainty about the timing and speed of the tourism recovery, obtaining quick feedback and redeploying funds will be critical to ensuring that stimulus packages have maximum impact.
2. Experimenting with new financing mechanisms
Most of the $100 billion stimulus that we analyzed was structured as grants, debt relief, and aid to SMEs and airlines. New Zealand has offered an NZ $15,000 (US $10,000) grant per SME to cover wages, for example, while Singapore has instituted an 8 percent cash grant on the gross monthly wages of local employees. Japan has waived the debt of small companies where income dropped more than 20 percent. In Germany, companies can use state-sponsored work-sharing schemes for up to six months, and the government provides an income replacement rate of 60 percent.
Our forecasts indicate that it will take four to seven years for tourism demand to return to 2019 levels, which means that overcapacity will be the new normal in the medium term. This prolonged period of low demand means that the way tourism is financed needs to change. The aforementioned types of policies are expensive and will be difficult for governments to sustain over multiple years. They also might not go far enough. A recent Organisation for Economic Co-operation and Development (OECD) survey of SMEs in the tourism sector suggested more than half would not survive the next few months, and the failure of businesses on anything like this scale would put the recovery far behind even the most conservative forecasts. 4 See Tourism policy responses to the coronavirus (COVID-19), OECD, June 2020, oecd.org. Governments and the private sector should be investigating new, innovative financing measures.
Revenue-pooling structures for hotels
One option would be the creation of revenue-pooling structures, which could help asset owners and operators, especially SMEs, to manage variable costs and losses moving forward. Hotels competing for the same segment in the same district, such as a beach strip, could have an incentive to pool revenues and losses while operating at reduced capacity. Instead of having all hotels operating at 20 to 40 percent occupancy, a subset of hotels could operate at a higher occupancy rate and share the revenue with the remainder. This would allow hotels to optimize variable costs and reduce the need for government stimulus. Non-operating hotels could channel stimulus funds into refurbishments or other investment, which would boost the destination’s attractiveness. Governments will need to be the intermediary between businesses through auditing or escrow accounts in this model.
Joint equity funds for small and medium-size enterprises
Government-backed equity funds could also be used to deploy private capital to help ensure that tourism-related SMEs survive the crisis (Exhibit 2). This principle underpins the European Commission’s temporary framework for recapitalization of state-aided enterprises, which provided an estimated €1.9 trillion in aid to the EU economy between March and May 2020. 5 See “State aid: Commission expands temporary framework to recapitalisation and subordinated debt measures to further support the economy in the context of the coronavirus outbreak,” European Commission, May 8, 2020, ec.europa.eu. Applying such a mechanism to SMEs would require creating an appropriate equity-holding structure, or securitizing equity stakes in multiple SMEs at once, reducing the overall risk profile for the investor. In addition, developing a standardized valuation methodology would avoid lengthy due diligence processes on each asset. Governments that do not have the resources to co-invest could limit their role to setting up those structures and opening them to potential private investors.
3. Ensuring transparent, consistent communication on protocols
The return of tourism demand requires that travelers and tourism-sector employees feel—and are—safe. Although international organizations such as the International Air Transport Association (IATA), and the World Travel & Tourism Council (WTTC) have developed a set of guidelines to serve as a baseline, local regulators are layering additional measures on top. This leads to low levels of harmonization regarding regulations imposed by local governments.
Our surveys of traveler confidence in the United States suggests anxiety remains high, and authorities and destination managers must work to ensure travelers know about, and feel reassured by, protocols put in place for their protection. Our latest survey of traveler sentiment in China suggests a significant gap between how confident travelers would like to feel and how confident they actually feel; actual confidence in safety is much lower than the expected level asked a month before.
One reason for this low level of confidence is confusion over the safety measures that are currently in place. Communication is therefore key to bolstering demand. Experience in Europe indicates that prompt, transparent, consistent communications from public agencies have had a similar impact on traveler demand as CEO announcements have on stock prices. Clear, credible announcements regarding the removal of travel restrictions have already led to increased air-travel searches and bookings. In the week that governments announced the removal of travel bans to a number of European summer destinations, for example, outbound air travel web search volumes recently exceeded precrisis levels by more than 20 percent in some countries.
The case of Greece helps illustrate the importance of clear and consistent communication. Greece was one of the first EU countries to announce the date of, and conditions and protocols for, border reopening. Since that announcement, Greece’s disease incidence has remained steady and there have been no changes to the announced protocols. The result: our joint research with trivago shows that Greece is now among the top five summer destinations for German travelers for the first time. In July and August, Greece will reach inbound airline ticketing levels that are approximately 50 percent of that achieved in the same period last year. This exceeds the rate in most other European summer destinations, including Croatia (35 percent), Portugal (around 30 percent), and Spain (around 40 percent). 6 Based on IATA Air Travel Pulse by McKinsey. In contrast, some destinations that have had inconsistent communications around the time frame of reopening have shown net cancellations of flights for June and July. Even for the high seasons toward the end of the year, inbound air travel ticketing barely reaches 30 percent of 2019 volumes.
Digital solutions can be an effective tool to bridge communication and to create consistency on protocols between governments and the private sector. In China, the health QR code system, which reflects past travel history and contact with infected people, is being widely used during the reopening stage. Travelers have to show their green, government-issued QR code before entering airports, hotels, and attractions. The code is also required for preflight check-in and, at certain destination airports, after landing.
4. Enabling a digital and analytics transformation within the tourism sector
Data sources and forecasts have shifted, and proliferated, in the crisis. Last year’s demand prediction models are no longer relevant, leaving many destinations struggling to understand how demand will evolve, and therefore how to manage supply. Uncertainty over the speed and shape of the recovery means that segmentation and marketing budgets, historically reassessed every few years, now need to be updated every few months. The tourism sector needs to undergo an analytics transformation to enable the coordination of marketing budgets, sector promotions, and calendars of events, and to ensure that products are marketed to the right population segment at the right time.
Governments have an opportunity to reimagine their roles in providing data infrastructure and capabilities to the tourism sector, and to investigate new and innovative operating models. This was already underway in some destinations before COVID-19. Singapore, for example, made heavy investments in its data and analytics stack over the past decade through the Singapore Tourism Analytics Network (STAN), which provided tourism players with visitor arrival statistics, passenger profiling, spending data, revenue data, and extensive customer-experience surveys. During the COVID-19 pandemic, real-time data on leading travel indicators and “nowcasts” (forecasts for the coming weeks and months) could be invaluable to inform the decisions of both public-sector and private-sector entities.
This analytics transformation will also help to address the digital gap that was evident in tourism even before the crisis. Digital services are vital for travelers: in 2019, more than 40 percent of US travelers used mobile devices to book their trips. 7 Global Digital Traveler Research 2019, Travelport, marketing.cloud.travelport.com; “Mobile travel trends 2019 in the words of industry experts,” blog entry by David MacHale, December 11, 2018, blog.digital.travelport.com. In Europe and the United States, as many as 60 percent of travel bookings are digital, and online travel agents can have a market share as high as 50 percent, particularly for smaller independent hotels. 8 Sean O’Neill, “Coronavirus upheaval prompts independent hotels to look at management company startups,” Skift, May 11, 2020, skift.com. COVID-19 is likely to accelerate the shift to digital as travelers look for flexibility and booking lead times shorten: more than 90 percent of recent trips in China were booked within seven days of the trip itself. Many tourism businesses have struggled to keep pace with changing consumer preferences around digital. In particular, many tourism SMEs have not been fully able to integrate new digital capabilities in the way that larger businesses have, with barriers including language issues, and low levels of digital fluency. The commission rates on existing platforms, which range from 10 percent for larger hotel brands to 25 percent for independent hotels, also make it difficult for SMEs to compete in the digital space.
Governments are well-positioned to overcome the digital gap within the sector and to level the playing field for SMEs. The Tourism Exchange Australia (TXA) platform, which was created by the Australian government, is an example of enabling at scale. It acts as a matchmaker, connecting suppliers with distributors and intermediaries to create packages attractive to a specific segment of tourists, then uses tourist engagement to provide further analytical insights to travel intermediaries (Exhibit 3). This mechanism allows online travel agents to diversify their offerings by providing more experiences away from the beaten track, which both adds to Australia’s destination attractiveness, and gives small suppliers better access to customers.

Governments that seize the opportunity to reimagine tourism operations and oversight will be well positioned to steer their national tourism industries safely into—and set them up to thrive within—the next normal.
Download the article in Arabic (513KB)
Margaux Constantin is an associate partner in McKinsey’s Dubai office, Steve Saxon is a partner in the Shanghai office, and Jackey Yu is an associate partner in the Hong Kong office.
The authors wish to thank Hugo Espirito Santo, Urs Binggeli, Jonathan Steinbach, Yassir Zouaoui, Rebecca Stone, and Ninan Chacko for their contributions to this article.
Explore a career with us
Related articles.

Make it better, not just safer: The opportunity to reinvent travel

Hospitality and COVID-19: How long until ‘no vacancy’ for US hotels?

A new approach in tracking travel demand
Thank you for visiting nature.com. You are using a browser version with limited support for CSS. To obtain the best experience, we recommend you use a more up to date browser (or turn off compatibility mode in Internet Explorer). In the meantime, to ensure continued support, we are displaying the site without styles and JavaScript.
- View all journals
- My Account Login
- Explore content
- About the journal
- Publish with us
- Sign up for alerts
- Open access
- Published: 24 February 2024
Modeling the link between tourism and economic development: evidence from homogeneous panels of countries
- Pablo Juan Cárdenas-García ORCID: orcid.org/0000-0002-1779-392X 1 ,
- Juan Gabriel Brida 2 &
- Verónica Segarra 2
Humanities and Social Sciences Communications volume 11 , Article number: 308 ( 2024 ) Cite this article
1010 Accesses
Metrics details
- Development studies
Having previously analyzed the relationship between tourism and economic growth from distinct perspectives, this paper attempts to fill the void existing in scientific research on the relationship between tourism and economic development, by analyzing the relationship between these variables using a sample of 123 countries between 1995 and 2019. The Dumistrescu and Hurlin adaptation of the Granger causality test was used. This study takes a critical look at causal analysis with heterogeneous panels, given the substantial differences found between the results of the causal analysis with the complete panel as compared to the analysis of homogeneous country groups, in terms of their dynamics of tourism specialization and economic development. On the one hand, a one-way causal relationship exists from tourism to development in countries having low levels of tourism specialization and development. On the other hand, a one-way causal relationship exists by which development contributes to tourism in countries with high levels of development and tourism specialization.
Worldwide divergence of values
Joshua Conrad Jackson & Danila Medvedev

The economic commitment of climate change
Maximilian Kotz, Anders Levermann & Leonie Wenz

Ghost roads and the destruction of Asia-Pacific tropical forests
Jayden E. Engert, Mason J. Campbell, … William F. Laurance
Introduction
Across the world, tourism is one of the most important sectors. It has undergone exponential growth since the mid-1900s and is currently experiencing growth rates that exceed those of other economic sectors (Yazdi, 2019 ).
Today, tourism is a major source of income for countries that specialize in this sector, generating 5.8% of the global GDP (5.8 billion US$) in 2021 (UNWTO, 2022 ) and providing 5.4% of all jobs (289 million) worldwide. Although its relevance is clear, tourism data have declined dramatically due to the recent impact of the Covid-19 health crisis. In 2019, prior to the pandemic (UNWTO, 2020 ), tourism represented 10.3% of the worldwide GDP (9.6 billion US$), with the number of tourism-related jobs reaching 10.2% of the global total (333 million). With the evolution of the pandemic and the regained trust of tourists across the globe, it is estimated that by 2022, approximately 80% of the pre-pandemic figures will be attained, with a full recovery being expected by 2024 (UNWTO, 2022 ).
Given the importance of this economic activity, many countries consider tourism to be a tool enabling economic growth (Corbet et al., 2019 ; Ohlan, 2017 ; Xia et al., 2021 ). Numerous works have analyzed the relationship between increased tourism and economic growth; and some systematic reviews have been carried out on this relationship (Brida et al., 2016 ; Ahmad et al., 2020 ), examining the main contributions over the first two decades of this century. These reviews have revealed evidence in this area: in some cases, it has been found that tourism contributes to economic growth while, in other cases, the economic cycle influences tourism expansion. Moreover, other works offer evidence of a bi-directional relationship between these variables.
Distinct international organizations (OECD, 2010 ; UNCTAD, 2011 ) have suggested that not only does tourism promote economic growth, it also contributes to socio-economic advances in the host regions. This may be the real importance of tourism, since the ultimate objective of any government is to improve a country’s socio-economic development (UNDP, 1990 ).
The development of economic and other policies related to the economic scope of tourism, in addition to promoting economic growth, are also intended to improve other non-economic factors such as education, safety, and health. Improvements in these factors lead to a better life for the host population (Lee, 2017 ; Todaro and Smith, 2020 ).
Given tourism’s capacity as an instrument of economic development (Cárdenas-García et al., 2015 ), distinct institutions such as the United Nations Conference on Trade and Development, the United Nations Economic Commission for Africa, the United Nations World Tourism Organization and the World Bank, have begun funding projects that consider tourism to be a tool for improved socio-economic development, especially in less advanced countries (Carrillo and Pulido, 2019 ).
This new trend within the scientific literature establishes, firstly, that tourism drives economic growth and, secondly, that thanks to this economic growth, the population’s economic conditions may be improved (Croes et al., 2021 ; Kubickova et al., 2017 ). However, to take advantage of the economic growth generated by tourism activity to boost economic development, specific policies should be developed. These policies should determine the initial conditions to be met by host countries committed to tourism as an instrument of economic development. These conditions include regulation, tax system, and infrastructure provision (Cárdenas-García and Pulido-Fernández, 2019 ; Lejárraga and Walkenhorst, 2013 ; Meyer and Meyer, 2016 ).
Therefore, it is necessary to differentiate between the analysis of the relationship between tourism and economic growth, whereby tourism boosts the economy of countries committed to tourism, traditionally measured through an increase in the Gross Domestic Product (Alcalá-Ordóñez et al., 2023 ; Brida et al., 2016 ), and the analysis of the relationship between tourism and economic development, which measures the effect of tourism on other factors (not only economic content but also inequality, education, and health) which, together with economic criteria, serve as the foundation to measure a population’s development (Todaro and Smith, 2020 ).
However, unlike the analysis of the relationship between tourism and economic growth, few empirical studies have examined tourism’s capacity as a tool for development (Bojanic and Lo, 2016 ; Cárdenas-García and Pulido-Fernández, 2019 ; Croes, 2012 ).
To help fill this gap in the literature analyzing the relationship between tourism and economic development, this work examines the contribution of tourism to economic development, given that the relationship between tourism and economic growth has been widely analyzed by the scientific literature. Moreover, given that the literature has demonstrated that tourism contributes to economic growth, this work aims to analyze whether it also contributes to economic development, considering development in the broadest possible sense by including economic and socioeconomic variables in the multi-dimensional concept (Wahyuningsih et al., 2020 ).
Therefore, based on the results of this work, it is possible to determine whether the commitment made by many international organizations and institutions in financing tourism projects designed to improve the host population’s socioeconomic conditions, especially in countries with lower development levels, has, in fact, resulted in improved development levels.
It also presents a critical view of causal analyses that rely on heterogeneous panels, examining whether the conclusions reached for a complete panel differ from those obtained when analyzing homogeneous groups within the panel. As seen in the literature review analyzing the relationship between tourism and economic development, empirical works using panel data from several countries tend to generalize the results obtained to the entire panel, without verifying whether, in fact, they are relevant for all of the analyzed countries or only some of the same. Therefore, this study takes an innovative approach by examining the panel countries separately, analyzing the homogeneous groups distinctly.
Therefore, this article presents an empirical analysis examining whether a causal relationship exists between tourism and economic development, with development being considered to be a multi-dimensional variable including a variety of factors, distinct from economic ones. Panel data from 123 countries during the 1995–2019 period was considered to examine the causal relationship between tourism and economic development. For this, the Granger causality test was performed, applying the adaptation of this test made by Dumistrescu and Hurlin. First, a causal analysis was performed collectively for all of the countries of the panel. Then, a specific analysis was performed for each of the homogeneous groups of countries identified within the panel, formed according to levels of tourism specialization and development.
This article provides information on tourism’s capacity to serve as an instrument of development, helping to fill the gap in scientific research in this area. It critically examines the use of causal analyses based on heterogeneous samples of countries. This work offers the following main novelties as compared to prior works on the same topic: firstly, it examines the relationship between tourism and economic development, while the majority of the existing works only analyze the relationship between tourism and economic growth; secondly, it analyzes a large sample of countries, representing all of the global geographic areas, whereas the literature has only considered works from specific countries or a limited number of nations linked to a specific country in a specific geographical area, and; thirdly, it analyzes the panel both individually and collectively, for each of the homogenous groups of countries identified, permitting the adoption of specific policies for each group of countries according to the identified relationship, as compared to the majority of works that only analyze the complete panel, generalizing these results for all countries in the sample.
Overall, the results suggest that a relationship exists between tourism and development in all of the analyzed countries from the sample. A specific analysis was performed for homogeneous country groups, only finding a causal relationship between tourism and development in certain country groups. This suggests that the use of heterogeneous country samples in causal analyses may give rise to inappropriate conclusions. This may be the case, for example, when finding causality for a broad panel of countries, although, in fact, only a limited number of panel units actually explain this causal relationship.
The remainder of the document is organized as follows: the next section offers a review of the few existing scientific works on the relationship between tourism and economic development; section three describes the data used and briefly explains the methodology carried out; section four details the results obtained from the empirical analysis; and finally, the conclusions section discusses the main implications of the work, also providing some recommendations for economic policy.
Tourism and economic development
Numerous organizations currently recognize the importance of tourism as an instrument of economic development. It was not until the late 20th century, however, when the United Nations World Tourism Organization (UNWTO), in its Manila Declaration, established that the development of international tourism may “help to eliminate the widening economic gap between developed and developing countries and ensure the steady acceleration of economic and social development and progress, in particular of the developing countries” (UNWTO, 1980 ).
From a theoretical point of view, tourism may be considered an effective activity for economic development. In fact, the theoretical foundations of many works are based on the relationship between tourism and development (Ashley et al., 2007 ; Bolwell and Weinz, 2011 ; Dieke, 2000 ; Sharpley and Telfer, 2015 ; Sindiga, 1999 ).
The link between tourism and economic development may arise from the increase in tourist activity, which promotes economic growth. As a result of this economic growth, policies may be developed to improve the resident population’s level of development (Alcalá-Ordóñez and Segarra, 2023 ).
Therefore, it is essential to identify the key variables permitting the measurement of the level of economic development and, therefore, those variables that serve as a basis for analyzing whether tourism results in improved the socioeconomic conditions of the host population (Croes et al., 2021 ). Since economic development refers not only to economic-based variables, but also to others such as inequality, education, or health (Todaro and Smith, 2020 ), when analyzing the economic development concept, it has been frequently linked to human development (Pulido-Fernández and Cárdenas-García, 2021 ). Thus, we wish to highlight the major advances resulting from the publication of the Human Development Index (HDI) when measuring economic development, since it defines development as a multidimensional variable that combines three dimensions: health, education, and income level (UNDP, 2023 ).
However, despite the importance that many organizations have given to tourism as an instrument of economic development, basing their work on the relationship between these variables, a wide gap continues to exist in the scientific literature for empirical studies that examine the existence of a relationship between tourism and economic development, with very few empirical analyses analyzing this relationship.
First, a group of studies has examined the causal relationship between tourism and economic development, using heterogeneous samples, and without previously grouping the subjects based on homogeneous characteristics. Croes ( 2012 ) analyzed the relationship between tourism and economic development, measured through the HDI, finding that a bidirectional relationship exists for the cases of Nicaragua and Costa Rica. Using annual data from 2001 to 2014, Meyer and Meyer ( 2016 ) performed a collective analysis of South African regions, determining that tourism contributes to economic development. For a panel of 63 countries worldwide, and once again relying on the HDI to define economic development, it was determined that tourism contributes to economic development. Kubickova et al. ( 2017 ), using annual data for the 1995–2007 period, analyzed Central America and Caribbean nations, determining the existence of this relationship by which tourism influences the level of economic development and that the level of development conditions the expansion of tourism. Another work examined nine micro-states of America, Europe, and Africa (Fahimi et al., 2018 ); and 21 European countries in which human capital was measured, as well as population density and tourism income, analyzing panel data and determining that tourism results in improved economic development. Finally, within this first group of works, Chattopadhyay et al. ( 2022 ), using a broad panel of destinations, (133 countries from all geographic areas of the globe) determined that there is no relationship between tourism and economic development.
Studies performed with large country samples that attempt to determine the causal relationship between tourism and economic development by analyzing countries that do not necessarily share homogeneous characteristics, may lead to erroneous conclusions, establishing causality (or not) for panel sets even when this situation is actually explained by a small number of panel units.
Second, another group of studies have analyzed the causal relationship between tourism and economic development, considering the previous limitation, and has grouped the subjects based on their homogeneous characteristics. Cárdenas-García et al. ( 2015 ) used annual data from 1990–2010, in a collective analysis of 144 countries, making a joint panel analysis and then examining two homogeneous groups of countries based on their level of economic development. They determined that tourism contributes to economic development, but only in the most developed group of countries. They determined that tourism contributes to economic development, both for the total sample and for the homogeneous groups analyzed. Pulido-Fernández and Cárdenas-García ( 2021 ), using annual data for the 1993–2017 period, performed a joint analysis of 143 countries, followed by a specific analysis for three groups of countries sharing homogeneous characteristics in terms of tourism growth and development level. They determined that tourism contributes to economic development and that development level conditions tourism growth in the most developed countries.
Finally, another group of studies has analyzed the causal relationship between tourism and economic development in specific cases examined on an individual basis. In a specific analysis by Aruba et al. ( 2016 ), it was determined that tourism contributes to human development. Analyzing Malaysia, Tan et al. ( 2019 ) determined that tourism contributes to development, but only over the short term, and that level of development does not influence tourism growth. Similar results were obtained by Boonyasana and Chinnakum ( 2020 ) in an analysis carried out in Thailand. In this case of Thailand (Boonyasana and Chinnakum, 2020 ), which relied on the HDI, the relationship with economic growth was also analyzed, finding that an increase in tourism resulted in improved economic development. Finally, Croes et al. ( 2021 ), in a specific analysis of Poland, determined that tourism does not contribute to development.
As seen from the analysis of the most relevant publications detailed in Table 1 , few empirical works have considered the relationship between tourism and economic development, in contrast to the numerous works from the scientific literature that have examined the relationship between tourism and economic growth. Most of the works that have empirically analyzed the relationship between tourism and economic development have determined that tourism positively influences the improved economic development in host destinations. To a lesser extent, some studies have found a bidirectional relationship between these variables (Croes, 2012 ; Kubickova et al., 2017 ; Pulido-Fernández and Cárdenas-García, 2021 ) while others have found no relationship between tourism and economic development (Chattopadhyay et al., 2022 ; Croes et al., 2021 ).
Furthermore, in empirical works relying on panel data, the results have tended to be generalized to the entire panel, suggesting that tourism improves economic development in all countries that are part of the panel. This has been the case in all of the examined works, with the exception of two studies that analyzed the panel separately (Cárdenas-García et al., 2015 ; Pulido-Fernández and Cárdenas-García, 2021 ).
Thus, it may be suggested that the use of very large country panels and, therefore, including very heterogeneous destinations, as was the case in the works of Biagi et al. ( 2017 ) using a panel of 63 countries, as well as that of Chattopadhyay et al. ( 2022 ) working with a panel of 133 countries, may lead to error, given that this relationship may only arise in certain destinations of the panel, although it is generalized to the entire panel.
This work serves to fill this gap in the literature by analyzing the panel both collectively and separately, for each of the homogenous groups of countries that have been previously identified.
The lack of relevant works on the relationship between tourism and development, and of studies using causal analyses to examine these variables based on heterogeneous panels, may lead to the creation of rash generalizations regarding the entirety of the analyzed countries. Thus, conclusions may be reached that are actually based on only specific panel units. Therefore, we believe that this study is justified.
Methodological approach
Given the objective of this study, to determine whether a causal relationship exists between tourism and socio-economic development, it is first necessary to identify the variables necessary to measure tourism activity and development level. Thus, the indicators are highly relevant, given that the choice of indicator may result in distinct results (Rosselló-Nadal and He, 2020 ; Song and Wu, 2021 ).
Table 2 details the measurement variables used in this work. Specifically, the following indicators have been used in this paper to measure tourism and economic development:
Measurement of tourist activity. In this work, we decided to consider tourism specialization, examining the number of international tourists received by a country with regard to its population size as the measurement variable.
This information on international tourists at a national level has been provided annually by the United Nations World Tourism Organization since 1995 (UNWTO, 2023 ). This variable has been relativized based on the country’s population, according to information provided by the World Bank on the residents of each country (WB, 2023 ).
Tourism specialization is considered to be the level of tourism activity, specifically, the arrival of tourists, relativized based on the resident population, which allows for comparisons to be made between countries. It accurately measures whether or not a country is specialized in this economic activity. If the variable is used in absolute values, for example, the United States receives more tourists than Malta, so based on this variable it may be that the first country is more touristic than the second. However, in reality, just the opposite happens, Malta is a country in which tourist activity is more important for its economy than it is in the United States, so the use of tourist specialization as a measurement variable classifies, correctly, both Malta as a country with high tourism specialization and to the United States as a country with low tourism specialization.
Therefore, most of the scientific literature establishes the need to use the total number of tourists relativized per capita, given that this allows for the determination of the level of tourism specialization of a tourism destination (Dritsakis, 2012 ; Tang and Abosedra, 2016 ); furthermore, this indicator has been used in works analyzing the relationship between tourism and economic development (for example, Biagi et al., 2017 ; Boonyasana and Chinnakum; 2020 ; Croes et al., 2021 ; Fahimi et al., 2018 ).
Although some works have used other variables to measure tourism, such as tourism income, exports, or tourist spending, these variables are not available for all of the countries making up the panel, so the sample would have been significantly reduced. Furthermore, the data available for these alternative variables do not come from homogeneous databases, and therefore cannot be compared.
Measurement of economic development. In this work, the Human Development Index has been used to measure development.
This information is provided by the United Nations Development Program, which has been publishing it annually at the country level since 1990 (UNDP, 2023 ).
The selection of this indicator to measure economic development is in line with other works that have defended its use to measure the impact on development level (for example, Jalil and Kamaruddin, 2018 ; Sajith and Malathi, 2020 ); this indicator has also been used in works analyzing the relationship between tourism and economic development (for example, Meyer and Meyer, 2016 ; Kubickova et al., 2017 ; Pulido-Fernández and Cárdenas-García, 2021 ).
Although some works have used other variables, such as poverty or inequality, to measure development, these variables are not available for all of the countries forming the panel. Therefore the sample would have been considerably reduced and the data available for these alternative variables do not come from homogenous databases, and therefore comparisons cannot be made.
These indicators are available for a total of 123 countries, across the globe. Thus, these countries form part of the sample analyzed in this study.
As for the time frame considered in this work, two main issues were relevant when determining this period: on the one hand, there is an initial time restriction for the analyzed series, given that information on the arrival of international tourists is only available as of 1995, the first year when this information was provided by the UNWTO. On the other hand, it was necessary to consider the effect of the Covid-19 pandemic and the resulting tourism sector crisis, which also affected the global economy as a whole. Therefore, our time series ended as of 2019, with the overall time frame including data from 1995 to 2019, a 25-year period.
Previous considerations
Caution should be taken when considering causality tests to determine the relationships between two variables, especially in cases in which large heterogeneous samples are used. This is due to the fact that generalized conclusions may be reached when, in fact, the causality is only produced by some of the subjects of the analyzed sample. This study is based on this premise. While heterogeneity in a sample is clearly a very relevant aspect, in some cases, it may lead to conclusions that are less than appropriate.
In this work, a collective causal analysis has been performed on all of the countries of the panel, which consists of 123 countries. However, given that it is a broad sample including countries having major differences in terms of size, region, development level, or tourism performance, the conclusions obtained from this analysis may lead to the generalization of certain conclusions for the entire sample set, when in fact, these relationships may only be the case for a very small portion of the sample. This has been the case in other works that have made generalized conclusions from relatively large samples in which the sample’s homogeneity regarding certain patterns was not previously verified (Badulescu et al., 2021 ; Ömer et al., 2018 ; Gedikli et al., 2022 ; Meyer and Meyer, 2016 ; Xia et al., 2021 ).
Therefore, after performing a collective analysis of the entire panel, the causal relationship between tourism and development was then determined for homogeneous groups of countries that share common patterns of tourism performance and economic development level, to analyze whether the generalized conclusions obtained in the previous section differ from those made for the individual groups. This was in line with strategies that have been used in other works that have grouped countries based on tourism performance (Min et al., 2016 ) or economic development level (Cárdenas-García et al., 2015 ), prior to engaging in causal analyses. To classify the countries into homogeneous groups based on tourism performance and development level, a previous work was used (Brida et al., 2023 ) which considered the same sample of 123 countries, relying on the same data to measure tourism and development level and the same time frame. This guarantees the coherence of the results obtained in this work.
From the entire panel of 123 countries, a total of six country groups were identified as having a similar dynamic of tourism and development, based on qualitative dynamic behavior. In addition, an “outlier” group of countries was found. These outlier countries do not fit into any of the groups (Brida et al., 2023 ). The three main groups of countries were considered, discarding three other groups due to their small size. Table 3 presents the group of countries sharing similar dynamics in terms of tourism performance and economic development level.
Applied methodology
As indicated above, this work uses the Tourist Specialization Rate (TIR) and the Human Development Index (HDI) to measure tourism and economic development, respectively. In both cases, we work with the natural logarithm (l.TIR and l.HDI) as well as the first differences between the variables (d.l.TIR and d.l.HDI), which measure the growth of these variables.
A complete panel of countries is used, consisting of 123 countries. The three main groups indicated in the previous section are also considered (the first of the groups contains 36 countries, the second contains 29 and the last group contains 43).
The Granger causality test ( 1969 ) is used to analyze the relationships between tourism specialization and development level; this test shows if one variable predicts the other, but this should not be confused with a cause-effect relationship.
In the context of panel data, different tests may be used to analyze causality. Most of these tests differ with regard to the assumptions of homogeneity of the panel unit coefficients. While the standard form of the Granger causality test for panels assumes that all of the coefficients are equal between the countries forming part of the panel, the Dumitrescu and Hurlin test (2012) considers that the coefficients are different between the countries forming part of the panel. Therefore, in this work, Granger’s causality is analyzed using the Dumitrescu and Hurlin test (2012). In this test, the null hypothesis is of no homogeneous causality; in other words, according to the null hypothesis, causality does not exist for any of the countries of the analyzed sample whereas, according to the alternative hypothesis, in which the regression model may be different in the distinct countries, causality is verified for at least some countries. The approach used by Dumitrescu and Hurlin ( 2012 ) is more flexible in its assumptions since although the coefficients of the regressions proposed in the tests are constant over time, the possibility that they may differ for each of the panel elements is accepted. This approach has more realistic assumptions, given that countries exhibit different behaviors. One relevant aspect of this type of tests is that they offer no information on which countries lead to the rejection of the lack of causality.
Given the specific characteristics of this type of tests, the presence of very heterogeneous samples may lead to inappropriate conclusions. For example, causality may be assumed for a panel of countries, when only a few of the panel’s units actually explain this relationship. Therefore, this analysis attempts to offer novel information on this issue, revealing that the conclusions obtained for the complete set of 123 countries are not necessarily the same as those obtained for each homogeneous group of countries when analyzed individually.
Given the nature of the variables considered in this work, specifically, regarding tourism, it is expected that a shock taking place in one country may be transmitted to other countries. Therefore, we first analyze the dependency between countries, since this may lead to biases (Pesaran, 2006 ). The Pesaran cross-sectional dependence test (2004) is used for the total sample and for each of the three groups individually.
First, a dependence analysis is performed for the countries of the sample, verifying the existence of dependence between the panel subjects. A cross-sectional dependence test (Pesaran, 2004 ) is used, first for the overall set of countries in the sample and second, for each of the groups of countries sharing homogeneous characteristics.
The results are presented in Table 4 , indicating that the test is statistically significant for the two variables, both for all of the countries in the sample and for each of the homogeneous country clusters, for the variables taken in logarithms as well as their first differences.
Upon rejecting the null hypothesis of non-cross-sectional dependence, it is assumed that a shock occurs in a country that may be transmitted to other countries in the sample. In fact, the lack of dependence between the variables, both tourism and development, is natural in this type of variables, given the economic cycle through the globalization of the economic activity, common regions visited by tourists, the spillover effect, etc.
Second, the stationary nature of the series is tested, given that cross-sectional dependence has been detected between the variables. First-generation tests may present certain biases in the rejection of the null hypothesis since first-generation unit root tests do not permit the inclusion of dependence between countries (Pesaran, 2007 ). On the other hand, second-generation tests permit the inclusion of dependence and heterogeneity. Therefore, for this analysis, the augmented IPS test (CIPS) proposed by Pesaran ( 2007 ) is used. This second-generation unit root test is the most appropriate for this case, given the cross-sectional dependence.
The results are presented in Table 5 , showing the statistics of the CIPS test for both the overall set of countries in the sample and in each of the homogeneous clusters of countries. The results are presented for models with 1, 2, and 3 delays, considering both the variables in the logarithm and their first differences.
As observed, the null hypothesis of unit root is not rejected for the variables in levels, but it is rejected for the first differences. This result is found in all of the cases, for both the total sample and for each of the homogeneous groups, with a significance of 1%. Therefore, the variables are stationary in their first differences, that is, the variables are integrated at order 1. Given that the causality test requires stationary variables, in this work it is used with the variation or growth rate of the variables, that is, the variable at t minus the variable at t−1.
Finally, to analyze Granger’s causality, the test by Dumitrescu and Hurlin ( 2012 ) is used. This test is used to analyze the causal relationship in both directions; that is, whether tourism contributes to economic development and whether the economic development level conditions tourism specialization. Statistics are calculated considering models with 1, 2, and 3 delays. Considering that cross-sectional dependence exists, the p-values are corrected using bootstrap techniques (making 500 replications). Given that the test requires stationary variables, primary differences of both variables were considered.
Table 6 presents the result of the Granger causality analysis using the Dumitrescu and Hurlin test (2012), considering the null hypothesis that tourism does not condition development level, either for all of the countries or for each homogeneous country cluster.
For the entire sample of countries, the results suggest that the null hypothesis of no causality from tourism to development was rejected when considering 3 delays (in other works analyzing the relationship between tourism and development, the null hypothesis was rejected with a similar level of delay: Rivera ( 2017 ) when considering 3–4 delays or Ulrich et al. ( 2018 ) when considering 3 delays). This suggests that for the entire panel, one-way causality exists whereby tourism influences economic development, demonstrating that tourism specialization contributes positively to improving the economic development of countries opting for tourism development. This is in line with the results of Meyer and Meyer ( 2016 ), Ridderstaat et al. ( 2016 ); Biagi et al. ( 2017 ); Fahimi et al. ( 2018 ); Tan et al. ( 2019 ), or Boonyasana and Chinnakum ( 2020 ).
However, the previous conclusion is very general, given that it is based on a very large sample of countries. Therefore, it may be erroneous to generalize that tourism is a tool for development. In fact, the results indicate that, when analyzing causality by homogeneous groups of countries, sharing similar dynamics in both tourism and development, the null hypothesis of no causality from tourism to development is only rejected for the group C countries, when considering three delays. Therefore, the development of generalized policies to expand tourism in order to improve the socioeconomic conditions of any destination type should consider that this relationship between tourism and economic development does not occur in all cases. Thus, it should first be determined if the countries opting for this activity have certain characteristics that will permit a positive relationship between said variables.
In other words, it may be a mistake to generalize that tourism contributes to economic development for all countries, even though a causal relationship exists for the entire panel. Instead, it should be understood that tourism permits an improvement in the level of development only in certain countries, in line with the results of Cárdenas-García et al. ( 2015 ) or Pulido-Fernández and Cárdenas-García ( 2021 ). In this specific work, this positive relationship between tourism and development only occurs in countries from group C, which are characterized by a low level of tourism specialization and a low level of development. Some works have found similar results for countries from group C. For example, Sharma et al. ( 2020 ) found the same relationship for India, while Nonthapot ( 2014 ) had similar findings for certain countries in Asia and the Pacific, which also made up group C. Some recent works have analyzed the relationship between tourism specialization and economic growth, finding similar results. This has been the case with Albaladejo et al. ( 2023 ), who found a relationship from tourism to economic growth only for countries where income is low, and the tourism sector is not yet developed.
These countries have certain limitations since even when tourism contributes to improved economic development, their low levels of tourism specialization do not allow them to reach adequate host population socioeconomic conditions. Therefore, investments in tourism are necessary there in order to increase tourism specialization levels. This increase in tourism may allow these countries to achieve development levels that are similar to other countries having better population conditions.
Therefore, in this group, consisting of 43 countries, a causal relationship exists, given that these countries are characterized by a low level of tourism specialization. However, the weakness of this activity, due to its low relevance in the country, prevents it from increasing the level of economic development. In these countries (details of these countries can be found in Table 3 , specifically, the countries included in Group C), policymakers have to develop policies to improve tourism infrastructure as a prior step to improving their levels of development.
On the other hand, in Table 7 , the results of Granger’s causal analysis based on the Dumitrescu and Hurlin test (2012) are presented, considering the null hypothesis that development level does not condition an increase in tourism, both in the overall sample set and in each of the homogeneous country clusters.
The results indicate that, for the entire country sample, the null hypothesis of no causality from development to tourism is not rejected, for any type of delay. This suggests that, for the entire panel, one-way causality does not exist, with level of development influencing the level of tourism specialization. This is in line with the results of Croes et al. ( 2021 ) in a specific analysis in Poland.
Once again, this conclusion is quite general, given that it has been based on a very broad sample of countries. Therefore, it may be erroneous to generalize that the development level does not condition tourism specialization. Past studies using a large panel of countries, such as the work of Chattopadhyay et al. ( 2022 ) analyzing panel data from 133 countries, have been generalized to all of the analyzed countries, suggesting that economic development level does not condition the arrival of tourists to the destination, although, in fact, this relationship may only exist in specific countries within the analyzed panel.
In fact, the results indicate that, when analyzing causality by homogeneous country groups sharing a similar dynamic, for both tourism and development, the null hypothesis of no causality from development to tourism is only rejected for country group A when considering 2–3 delays. Although the statistics of the test differ, when the sample’s time frame is small, as in this case, the Z-bar tilde statistic is more appropriate.
Thus, development level influences tourism growth in Group A countries, which are characterized by a high level of development and tourism specialization, in accordance with the prior results of Pulido-Fernández and Cárdenas-García ( 2021 ).
These results, suggesting that tourism is affected by economic development level, but only in the most developed countries, imply that the existence of better socioeconomic conditions in these countries, which tend to have better healthcare systems, infrastructures, levels of human resource training, and security, results in an increase in tourist arrivals to these countries. In fact, when traveling to a specific tourist destination, if this destination offers attractive factors and a higher level of economic development, an increase in tourist flows was fully expected.
In this group, consisting of 36 countries, the high development level, that is, the proper provision of socio-economic factors in their economic foundations (training, infrastructures, safety, health, etc.) has led to the attraction of a large number of tourists to their region, making their countries having high tourism specialization.
Although international organizations have recognized the importance of tourism as an instrument of economic development, based on the theoretical relationship between these two variables, few empirical studies have considered the consequences of the relationship between tourism and development.
Furthermore, some hasty generalizations have been made regarding the analysis of this relationship and the analysis of the relationship of tourism with other economic variables. Oftentimes, conclusions have been based on heterogeneous panels containing large numbers of subjects. This may lead to erroneous results interpretation, basing these results on the entire panel when, in fact, they only result from specific panel units.
Given this gap in the scientific literature, this work attempts to analyze the relationship between tourism and economic development, considering the panel data in a complete and separate manner for each of the previously identified country groups.
The results highlight the need to adopt economic policies that consider the uniqueness of each of the countries that use tourism as an instrument to improve their socioeconomic conditions, given that the results differ according to the specific characteristics of the analyzed country groups.
This work provides precise results regarding the need for policymakers to develop public policies to ensure that tourism contributes to the improvement of economic development, based on the category of the country using this economic activity to achieve greater levels of economic development.
Specifically, this work has determined that tourism contributes to economic development, but only in countries that previously had a lower level of tourism specialization and were less developed. This highlights the need to invest in tourism to attract more tourists to these countries to increase their economic development levels. Countries having major natural attraction resources or factors, such as the Dominican Republic, Egypt, India, Morocco, and Vietnam, need to improve their positioning in the international markets in order to attain a higher level of tourism specialization, which will lead to improved development levels.
Furthermore, the results of this study suggest that a greater past economic development level of a country will help attract more tourists to these countries, highlighting the need to invest in security, infrastructures, and health in order for these destinations to be considered attractive and increase tourist arrival. In fact, given their increased levels of development, countries such as Spain, Greece, Italy, Qatar, and Uruguay have become attractive to tourists, with soaring numbers of visitors and high levels of tourism specialization.
Therefore, the analysis of the relationship between tourism and economic development should focus on the differentiated treatment of countries in terms of their specific characteristics, since working with panel data with large samples and heterogenous characteristics may lead to incorrect results generalizations to all of the analyzed destinations, even though the obtained relationship in fact only takes place in certain countries of the sample.
Conclusions and policy implications
Within this context, the objective of this study is twofold: on the one hand, it aims to contribute to the lack of empirical works analyzing the causal relationship between tourism and economic development using Granger’s causality analysis for a broad sample of countries from across the globe. On the other hand, it critically examines the use of causality analysis in heterogeneous samples, by verifying that the results for the panel set differ from the results obtained when analyzing homogeneous groups in terms of tourism specialization and development level.
In fact, upon analyzing the causal relationship from tourism to development, and the causal relationship from development to tourism, the results from the entire panel, consisting of 123 countries, differ from those obtained when analyzing causality by homogeneous country groups, in terms of tourism specialization and economic development dynamics of these countries.
On the one hand, a one-way causality relationship is found to exist, whereby tourism influences economic development for the entire sample of countries, although this conclusion cannot be generalized, since this relationship is only explained by countries belonging to Group C (countries with low levels of tourism specialization and low development levels). This indicates that, although a causal relationship exists by which tourism contributes to economic development in these countries, the low level of tourism specialization does not permit growth to appropriate development levels.
The existence of a causal relationship whereby the increase in tourism precedes the improvement of economic development in this group of countries having a low level of tourism specialization and economic development, suggests the appropriateness of the focus by distinct international organizations, such as the United Nations Conference on Trade and Development or the United Nations Economic Commission for Africa, on funding tourism projects (through the provision of tourism infrastructure, the stimulation of tourism supply, or positioning in international markets) in countries with low economic development levels. This work has demonstrated that investment in tourism results in the attracting of a greater flow of tourists, which will contribute to improved economic development levels.
Therefore, both international organizations financing projects and public administrations in these countries should increase the funding of projects linked to tourism development, in order to increase the flow of tourism to these destinations. This, given that an increase in tourism specialization suggests an increased level of development due to the demonstrated existence of a one-way causal relationship from tourism to development in these countries, many of which form part of the group of so-called “least developed” countries. However, according to the results obtained in this work, this relationship is not instantaneous, but rather, a certain delay exists in order for economic development to improve as a result of the increase in tourism. Therefore, public managers must adopt a medium and long-term vision of tourism activity as an instrument of development, moving away from short-term policies seeking immediate results, since this link only occurs over a broad time horizon.
On the other hand, this study reveals that a one-way causal relationship does not exist, by which the level of development influences tourism specialization level for the entire sample of countries. However, this conclusion, once again, cannot be generalized given that in countries belonging to Group A (countries with a high development level and a high tourism specialization level), a high level of economic development determines a higher level of tourism specialization. This is because the socio-economic structure of these countries (infrastructures, training or education, health, safety, etc.) permits their shaping as attractive tourist destinations, thereby increasing the number of tourists visiting them.
Therefore, investments made by public administrations to improve these factors in other countries that currently do not display this causal relationship implies the creation of the necessary foundations to increase their tourism specialization and, therefore, as shown in other works, tourism growth will permit economic growth, with all of the associated benefits for these countries.
Therefore, to attract tourist flows, it is not only important for a country to have attractive factors or resources, but also to have an adequate level of prior development. In other words, the tourists should perceive an adequate level of security in the destination; they should be able to use different infrastructures such as roads, airports, or the Internet; and they should receive suitable services at the destination from personnel having an appropriate level of training. The most developed countries, which are the destinations having the greatest endowment of these resources, are the ones that currently receive the most tourist flows thanks to the existence of these factors.
Therefore, less developed countries that are committed to tourism as an instrument to improve economic development should first commit to the provision of these resources if they hope to increase tourist flows. If this increase in tourism takes place in these countries, their economic development levels have been demonstrated to improve. However, since these countries are characterized by low levels of resources, cooperation by organizations financing the necessary investments is key to providing them with these resources.
Thus, a critical perspective is necessary when considering the relationship between tourism and economic development based on global causal analysis using heterogeneous samples with numerous subjects. As in this case, carrying out analyses on homogeneous groups may offer interesting results for policymakers attempting to suitably manage population development improvements due to tourism growth and tourism increases resulting from higher development levels.
One limitation of this work is its national scope since evidence suggests that tourism is a regional and local activity. Therefore, it may be interesting to apply this same approach on a regional level, using previously identified homogeneous groups.
And given that the existence of a causal relationship (in either direction) between tourism and development has only been determined for a specific set of countries, future works could consider other country-specific factors that may determine this causal relationship, in addition to the dynamics of tourism specialization and development level.
Data availability
The datasets generated during and/or analyzed during the current study are available from the corresponding author upon reasonable request.
Ahmad N, Menegaki AN, Al-Muharrami S (2020) Systematic literature review of tourism growth nexus: An overview of the literature and a content analysis of 100 most influential papers. J Econ Surv 34(5):1068–1110. https://doi.org/10.1111/joes.12386
Article Google Scholar
Albaladejo I, Brida G, González M y Segarra V (2023) A new look to the tourism and economic growth nexus: a clustering and panel causality analysis. World Econ https://doi.org/10.1111/twec.13459
Alcalá-Ordóñez A, Brida JG, Cárdenas-García PJ (2023) Has the tourism-led growth hypothesis been confirmed? Evidence from an updated literature review. Curr Issues Tour https://doi.org/10.1080/13683500.2023.2272730
Alcalá-Ordóñez A, Segarra V (2023) Tourism and economic development: a literature review to highlight main empirical findings. Tour Econom https://doi.org/10.1177/13548166231219638
Ashley C, De Brine P, Lehr A, Wilde H (2007) The role of the tourism sector in expanding economic opportunity. Kennedy School of Government, Harvard University, Cambridge MA
Google Scholar
Biagi B, Ladu MG, Royuela V (2017) Human development and tourism specialization. Evidence from a panel of developed and developing countries. Int J Tour Res 19(2):160–178. https://doi.org/10.1002/jtr.2094
Badulescu D, Simut R, Mester I, Dzitac S, Sehleanu M, Bac DP, Badulescu A (2021) Do economic growth and environment quality contribute to tourism development in EU countries? A panel data analysis. Technol Econom Dev Econ 27(6):1509–1538. https://doi.org/10.3846/tede.2021.15781
Bojanic DC, Lo M (2016) A comparison of the moderating effect of tourism reliance on the economic development for islands and other countries. Tour Manag 53:207–214. https://doi.org/10.1016/j.tourman.2015.10.00
Bolwell D, Weinz W (2011) Poverty reduction through tourism. International Labour Office, Geneva
Boonyasana P, Chinnakum W (2020) Linkages among tourism demand, human development, and CO 2 emissions in Thailand. Abac J 40(3):78–98
Brida JG, Cárdenas-García PJ, Segarra V (2023) Turismo y Desarrollo Económico: una Exploración Empírica. Red Nacional de Investigadores en Economía (RedNIE), Working Papers, 283
Brida JG, Cortes-Jimenez I, Pulina M (2016) Has the tourism-led growth hypothesis been validated? A literature review. Curr Issues Tour 19(5):394–430. https://doi.org/10.1080/13683500.2013.868414
Cárdenas-García PJ, Pulido-Fernández JI (2019) Tourism as an economic development tool. Key factors. Curr Issues Tour 22(17):2082–2108. https://doi.org/10.1080/13683500.2017.1420042
Cárdenas-García PJ, Sánchez-Rivero M, Pulido-Fernández JI (2015) Does tourism growth influence economic development? J Travel Res 54(2):206–221. https://doi.org/10.1177/0047287513514297
Carrillo I, Pulido JI, (2019) Is the financing of tourism by international financial institutions inclusive? A proposal for measurement. Curr Issues Tour 22:330–356. https://doi.org/10.1080/13683500.2016.1260529
Chattopadhyay M, Kumar A, Ali S, Mitra SK (2022) Human development and tourism growth’s relationship across countries: a panel threshold analysis. J Sustain Tour 30(6):1384–1402. https://doi.org/10.1080/09669582.2021.1949017
Corbet S, O’Connell JF, Efthymiou M, Guiomard C, Lucey B (2019) The impact of terrorism on European tourism. Ann Tour Res 75:1–17. https://doi.org/10.1016/j.annals.2018.12.012
Croes R (2012) Assessing tourism development from Sen’s capability approach. J Travel Res 51(5):542–554. https://doi.org/10.1177/0047287511431323
Article ADS Google Scholar
Croes R, Ridderstaat J, Bak M, Zientara P (2021) Tourism specialization, economic growth, human development and transition economies: the case of Poland. Tour Manag 82:104181. https://doi.org/10.1016/j.tourman.2020.104181
Dieke P (2000) The political economy of tourism development in Africa. Cognizant, New York
Dritsakis N (2012) Tourism development and economic growth in seven Mediterranean countries: a panel data approach. Tour Econ 18(4):801–816. https://doi.org/10.5367/te.2012.0140
Dumitrescu EI, Hurlin C (2012) Testing for Granger non-causality in heterogeneous panels. Econom Model 29(4):1450–1460. https://doi.org/10.1016/j.econmod.2012.02.014
Fahimi A, Saint Akadiri S, Seraj M, Akadiri AC (2018) Testing the role of tourism and human capital development in economic growth. A panel causality study of micro states. Tour Manag Perspect 28:62–70. https://doi.org/10.1016/j.tmp.2018.08.004
Gedikli A, Erdoğan S, Çevik EI, Çevik E, Castanho RA, Couto G(2022) Dynamic relationship between international tourism, economic growth and environmental pollution in the OECD countries: evidence from panel VAR model. Econom Res 35:5907–5923. https://doi.org/10.1080/1331677X.2022.2041063
Granger CWJ (1969) Investigating causal relations by econometric models and cross-spectral methods. Econometrica 37(3):424–438. https://doi.org/10.2307/1912791
Jalil SA, Kamaruddin MN (2018) Examining the relationship between human development index and socio-economic variables: a panel data analysis. J Int Bus Econ Entrepreneurship 3(2):37–44. https://doi.org/10.24191/jibe.v3i2.14431
Kubickova M, Croes R, Rivera M (2017) Human agency shaping tourism competitiveness and quality of life in developing economies. Tour Manag Perspect 22:120–131. https://doi.org/10.1016/j.tmp.2017.03.002
Lee YS (2017) General theory of law and development. Cornell Int Law Rev 50(3):432–435
CAS Google Scholar
Lejárraga I, Walkenhorst P (2013) Economic policy, tourism trade and productive diversification. Int Econ 135:1–12. https://doi.org/10.1016/j.inteco.2013.09.001
Meyer DF, Meyer N (2016) The relationship between the tourism sector and local economic development (Led): the case of the Vaal Triangle region. South Afr J Environ Manag Tour 3(15):466–472
Min CK, Roh TS, Bak S (2016) Growth effects of leisure tourism and the level of economic development. Appl Econ 48(1):7–17. https://doi.org/10.1080/00036846.2015.1073838
Nonthapot S (2014) The relationship between tourism and economic development in the Greater Mekong Subregion: panel cointegration and Granger causality. J Adv Res Law Econ 1(9):44–51
OECD (2010) Tourism trends & policies 2010. Paris: Organization for Economic Cooperation and Development (OECD)
Ohlan R (2017) The relationship between tourism, financial development and economic growth in India. Future Bus J 3(1):9–22. https://doi.org/10.1016/j.fbj.2017.01.003
Ömer Y, Muhammet D, Kerem K (2018) The effects of international tourism receipts on economic growth: evidence from the first 20 highest income earning countries from tourism in the world (1996–2016). Montenegrin J Econ 14(3):55–71
Pesaran MH (2004) General diagnostic tests for cross section dependence in panels. Cambridge Working Papers in Economics No: 0435. Faculty of Economics, University of Cambridge
Pesaran MH (2006) Estimation and inference in large heterogeneous panels with a multifactor error structure. Econometrica 74(4):967–1012. https://doi.org/10.1111/j.1468-0262.2006.00692.x
Article MathSciNet Google Scholar
Pesaran MH (2007) A simple panel unit root test in the presence of cross-section dependence. J Appl Econ 22:265–312. https://doi.org/10.1002/jae.951
Pulido-Fernández JI, Cárdenas-García PJ (2021) Analyzing the bidirectional relationship between tourism growth and economic development. J Travel Res 60(3):583–602. https://doi.org/10.1177/0047287520922316
Ridderstaat J, Croes R, Nijkamp P (2016) The tourism development–quality of life nexus in a small island destination. J Travel Res 55(1):79–94. https://doi.org/10.1177/0047287514532372
Rivera MA (2017) The synergies between human development, economic growth, and tourism within a developing country: an empirical model for Ecuador. J Destination Mark Manag 6:221–232. https://doi.org/10.1016/j.jdmm.2016.04.002
Rosselló-Nadal J, He J (2020) Tourist arrivals versus tourist expenditures in modelling tourism demand. Tour Econ 26(8):1311–1326. https://doi.org/10.1177/1354816619867810
Sajith GG, Malathi K (2020) Applicability of human development index for measuring economic well-being: a study on GDP and HDI indicators from Indian context. Indian Econom J 68(4):554–571. https://doi.org/10.1177/0019466221998620
Sharma M, Mohapatra G, Giri AK (2020) Beyond growth: does tourism promote human development in India? Evidence from time series analysis. J Asian Financ Econ Bus 7(12):693–702
Sharpley R, Telfer D (2015) Tourism and development: concepts and issues. Routledge, New York
Sindiga I (1999) Tourism and African development: change and challenge of tourism in Kenya. Ashgate, Leiden
Song H, Wu DC (2021) A critique of tourism-led economic growth studies. J Travel Res 61(4):719–729. https://doi.org/10.1177/004728752110185
Tan YT, Gan PT, Hussin MYM, Ramli N (2019) The relationship between human development, tourism and economic growth: evidence from Malaysia. Res World Econ 10(5):96–103. https://doi.org/10.5430/rwe.v10n5p96
Tang C, Abosedra S (2016) Does tourism expansion effectively spur economic growth in Morocco and Tunisia? Evidence from time series and panel data. J Policy Res Tour Leis Events 8(2):127–145. https://doi.org/10.1080/19407963.2015.1113980
Todaro MP, Smith SC (2020) Economic development. 13th Edition. Boston: Addison Wesley
Ulrich G, Ceddia MG, Leonard D, Tröster B (2018) Contribution of international ecotourism to comprehensive economic development and convergence in the Central American and Caribbean region. Appl Econ 50(33):3614–3629. https://doi.org/10.1080/00036846.2018.1430339
UNCTAD (2011) Fourth United Nations Conference on least developed countries. Geneva: United Nations Conference on Trade and Development
UNDP (1990) Human Development Report 1990. Concept and measurement of human development.United Nations Development Programme, NY
UNDP (2023) Human Development Reports 2021/2022.United Nations Development Programme, NY
UNWTO (1980) Manila Declaration on World Tourism. United Nations World Tourism Organization, Madrid
UNWTO (2020) World Tourism Barometer. January 2020. United Nations World Tourism Organization (UNWTO), Madrid
UNWTO (2022) World Tourism Barometer. January 2022. United Nations World Tourism Organization (UNWTO), Madrid
UNWTO (2023) UNWTO Tourism Data Dashboard. United Nations World Tourism Organization (UNWTO), Madrid
Wahyuningsih D, Yunaningsih A, Priadana MS, Wijaya A, Darma DC, Amalia S (2020) The dynamics of economic growth and development inequality in Borneo Island, Indonesia. J Appl Econom Sci 1(67):135–143. https://doi.org/10.14505/jaes.v15.1(67).12
World Bank (2023) World Bank Open Data. World Bank, Washington DC
Xia W, Doğan B, Shahzad U, Adedoyin FF, Popoola A, Bashir MA (2021) An empirical investigation of tourism-led growth hypothesis in the European countries: evidence from augmented mean group estimator. Port Econom J 21(2):239–266. https://doi.org/10.1007/s10258-021-00193-9
Yazdi SK (2019) Structural breaks, international tourism development and economic growth. Econom Res 32(1):1765–1776. https://doi.org/10.1080/1331677X.2019.1638279
Download references
Author information
Authors and affiliations.
Department of Economics, University of Jaén, Campus Las Lagunillas s/n, 23071, Jaén, Spain
Pablo Juan Cárdenas-García
GIDE, Faculty of Economics, Universidad de la República, Gonzalo Ramirez 1926, 11200, Montevideo, Uruguay
Juan Gabriel Brida & Verónica Segarra
You can also search for this author in PubMed Google Scholar
Contributions
Author 1: conceptualization, funding acquisition, investigation, project administration, resources, supervision, validation, writing original draft, writing review & editing. Author 2: conceptualization, formal analysis, methodology, validation, visualization. Author 3: data curation, formal analysis, investigation, methodology, resources, software, validation, writing original draft.
Corresponding author
Correspondence to Pablo Juan Cárdenas-García .
Ethics declarations
Competing interests.
The authors declare no competing interests.
Ethical approval
This article does not contain any studies with human participants performed by any of the authors.
Informed consent
Additional information.
Publisher’s note Springer Nature remains neutral with regard to jurisdictional claims in published maps and institutional affiliations.
Supplementary information
Researchdata-tourism+hdi, rights and permissions.
Open Access This article is licensed under a Creative Commons Attribution 4.0 International License, which permits use, sharing, adaptation, distribution and reproduction in any medium or format, as long as you give appropriate credit to the original author(s) and the source, provide a link to the Creative Commons licence, and indicate if changes were made. The images or other third party material in this article are included in the article’s Creative Commons licence, unless indicated otherwise in a credit line to the material. If material is not included in the article’s Creative Commons licence and your intended use is not permitted by statutory regulation or exceeds the permitted use, you will need to obtain permission directly from the copyright holder. To view a copy of this licence, visit http://creativecommons.org/licenses/by/4.0/ .
Reprints and permissions
About this article
Cite this article.
Cárdenas-García, P.J., Brida, J.G. & Segarra, V. Modeling the link between tourism and economic development: evidence from homogeneous panels of countries. Humanit Soc Sci Commun 11 , 308 (2024). https://doi.org/10.1057/s41599-024-02826-8
Download citation
Received : 03 September 2023
Accepted : 13 February 2024
Published : 24 February 2024
DOI : https://doi.org/10.1057/s41599-024-02826-8
Share this article
Anyone you share the following link with will be able to read this content:
Sorry, a shareable link is not currently available for this article.
Provided by the Springer Nature SharedIt content-sharing initiative
Quick links
- Explore articles by subject
- Guide to authors
- Editorial policies


- Press Releases
- Press Enquiries
- Travel Hub / Blog
- Brand Resources
- Newsletter Sign Up
- Global Summit
- Hosting a Summit
- Upcoming Events
- Previous Events
- Event Photography
- Event Enquiries
- Our Members
- Our Associates Community
- Membership Benefits
- Enquire About Membership
- Sponsors & Partners
- Insights & Publications
- WTTC Research Hub
- Economic Impact
- Knowledge Partners
- Data Enquiries
- Hotel Sustainability Basics
- Community Conscious Travel
- SafeTravels Stamp Application
- SafeTravels: Global Protocols & Stamp
- Security & Travel Facilitation
- Sustainable Growth
- Women Empowerment
- Destination Spotlight - SLO CAL
- Vision For Nature Positive Travel and Tourism
- Governments
- Consumer Travel Blog
- ONEin330Million Campaign
- Reunite Campaign

Economic Impact Research
- In 2023, the Travel & Tourism sector contributed 9.1% to the global GDP; an increase of 23.2% from 2022 and only 4.1% below the 2019 level.
- In 2023, there were 27 million new jobs, representing a 9.1% increase compared to 2022, and only 1.4% below the 2019 level.
- Domestic visitor spending rose by 18.1% in 2023, surpassing the 2019 level.
- International visitor spending registered a 33.1% jump in 2023 but remained 14.4% below the 2019 total.
Click here for links to the different economy/country and regional reports
Why conduct research?
From the outset, our Members realised that hard economic facts were needed to help governments and policymakers truly understand the potential of Travel & Tourism. Measuring the size and growth of Travel & Tourism and its contribution to society, therefore, plays a vital part in underpinning WTTC’s work.
What research does WTTC carry out?
Each year, WTTC and Oxford Economics produce reports covering the economic contribution of our sector in 185 countries, for 26 economic and geographic regions, and for more than 70 cities. We also benchmark Travel & Tourism against other economic sectors and analyse the impact of government policies affecting the sector such as jobs and visa facilitation.
Visit our Research Hub via the button below to find all our Economic Impact Reports, as well as other reports on Travel and Tourism.

- Open access
- Published: 05 January 2021
The relationship between tourism and economic growth among BRICS countries: a panel cointegration analysis
- Haroon Rasool ORCID: orcid.org/0000-0002-0083-4553 1 ,
- Shafat Maqbool 2 &
- Md. Tarique 1
Future Business Journal volume 7 , Article number: 1 ( 2021 ) Cite this article
120k Accesses
87 Citations
13 Altmetric
Metrics details
Tourism has become the world’s third-largest export industry after fuels and chemicals, and ahead of food and automotive products. From last few years, there has been a great surge in international tourism, culminates to 7% share of World’s total exports in 2016. To this end, the study attempts to examine the relationship between inbound tourism, financial development and economic growth by using the panel data over the period 1995–2015 for five BRICS (Brazil, Russia, India, China and South Africa) countries. The results of panel ARDL cointegration test indicate that tourism, financial development and economic growth are cointegrated in the long run. Further, the Granger causality analysis demonstrates that the causality between inbound tourism and economic growth is bi-directional, thus validates the ‘feedback-hypothesis’ in BRICS countries. The study suggests that BRICS countries should promote favorable tourism policies to push up the economic growth and in turn economic growth will positively contribute to international tourism.
Introduction
World Tourism Day 2015 was celebrated around the theme ‘One Billion Tourists; One Billion Opportunities’ highlighting the transformative potential of one billion tourists. With more than one billion tourists traveling to an international destination every year, tourism has become a leading economic sector, contributing 9.8% of global GDP and represents 7% of the world’s total exports [ 59 ]. According to the World Tourism Organization, the year 2013 saw more than 1.087 billion Foreign Tourist Arrivals and US $1075 billion foreign tourism receipts. The contribution of travel and tourism to gross domestic product (GDP) is expected to reach 10.8% at the end of 2026 [ 61 ]. Representing more than just economic strength, these figures exemplify the vast potential of tourism, to address some of the world´s most pressing challenges, including socio-economic growth and inclusive development.
Developing countries are emerging as the important players, and increasingly aware of their economic potential. Once essentially excluded from the tourism industry, the developing world has now become its major growth area. These countries majorly rely on tourism for their foreign exchange reserves. For the world’s forty poorest countries, tourism is the second-most important source of foreign exchange after oil [ 37 ].
The BRICS (Brazil, Russia, India, China and South Africa) countries have emerged as a potential bloc in the developing countries which caters the major tourists from developed countries. Tourism becomes major focus at BRICS Xiamen Summit 2017 held in China. These countries have robust growth rate, and are focal destinations for global tourists. During 1990 to 2014, these countries stride from 11% of the world’s GDP to almost 30% [ 17 ]. Among BRICS countries, China is ranked as an important destination followed by Brazil, Russia, India and South Africa [ 60 ].
The importance of inbound tourism has grown exponentially, because of its growing contribution to the economic growth in the long run. It enhances economic growth by augmenting the foreign exchange reserves [ 38 ], stimulating investments in new infrastructure, human capital and increases competition [ 9 ], promoting industrial development [ 34 ], creates jobs and hence to increase income [ 34 ], inbound tourism also generates positive externalities [ 1 , 14 ] and finally, as economy grows, one can argue that growth in GDP could lead to further increase in international tourism [ 11 ].
The tourism-led growth hypothesis (TLGH) proposed by Balaguer and Cantavella-Jorda [ 3 ], states that expansion of international tourism activities exerts economic growth, hence offering a theoretical and empirical link between inbound tourism and economic growth. Theoretically, the TLGH was directly derived from the export-led growth hypothesis (ELGH) that postulates that economic growth can be generated not only by increasing the amount of labor and capital within the economy, but also by expanding exports.
The ‘new growth theory,’ developed by Balassa [ 4 ], suggests that export expansion can trigger economic growth, because it promotes specialization and raises factors productivity by increasing competition, creating positive externalities by advancing the dispersal of specialized information and abilities. Exports also enhance economic growth by increasing the level of investment. International tourism is considered as a non-standard type of export, as it indicates a source of receipts and consumption in situ. Given the difficulties in measuring tourism activity, the economic literature tends to focus on primary and manufactured product exports, hence neglecting this economic sector. Analogous to the ELGH, the TLGH analyses the possible temporal relationship between tourism and economic growth, both in the short and long run. The question is whether tourism activity leads to economic growth or, alternatively, economic expansion drives tourism growth, or indeed a bi-directional relationship exists between the two variables.
To further substantiate the nexus, the study will investigate the plausible linkages between economic growth and international tourism while considering the relative importance of financial development in the context of BRICS nations. Financial markets are considered a key factor in producing strong economic growth, because they contribute to economic efficiency by diverting financial funds from unproductive to productive uses. The origin of this role of financial development may is traced back to the seminal work of Schumpeter [ 50 ]. In his study, Schumpeter points out that the banking system is the crucial factor for economic growth due to its role in the allocation of savings, the encouragement of innovation, and the funding of productive investments. Early works, such as Goldsmith [ 18 ], McKinnon [ 39 ] and Shaw [ 51 ] put forward considerable evidence that financial development enhances growth performance of countries. The importance of financial development in BRICS economies is reflected by the establishment of the ‘New Development Bank’ aimed at financing infrastructure and sustainable development projects in these and other developing countries. To the best of the authors’ knowledge, no attempt has been made so far to investigate the long-run relationship Footnote 1 between tourism, financial development and economic growth in case of BRICS countries. Hence, the present study is an attempt to fill the gap in the existing literature.
Review of past studies
From last few decades there has been a surge in the research related to tourism-growth nexus. The importance of growth and development and its determinants has been studied extensively both in developed and developing countries. Extant literature has recognized tourism as an important determinant of economic growth. The importance of tourism has grown exponentially, courtesy to its manifold advantages in form of employment, foreign exchange production household income and government revenues through multiplier effects, improvements in the balance of payments and growth in the number of tourism-promoted government policies [ 21 , 41 , 53 ]. Empirical findings on tourism and economic development have produced mixed finding and sometimes conflicting results despite the common choice of time series techniques as a research methodology. On empirical grounds, four hypotheses have been explored to determine the link between tourism and economic growth [ 12 ]. The first two hypotheses present an account on the unidirectional causality between the two variables, either from tourism to economic growth (Tourism-led economic growth hypothesis-TLGH) or its reserve (economic-driven tourism growth hypothesis-EDTH). The other two hypotheses support the existence of bi-directional hypothesis, (bi-directional causality hypothesis-BC) or that there is no relationship at all (no causality hypothesis-NC), respectively. According to TLEG hypothesis, tourism creates an array of benefits which spillover though multiple routes to promote the economic growth [ 55 ]. In particular, it is believed that tourism (1) increases foreign exchange earnings, which in turn can be used to finance imports [ 38 ], (2) it encourages investment and drives local firms toward greater efficiency due to the increased competition [ 3 , 31 ], (3) it alleviates unemployment, since tourism activities are heavily based on human capital [ 10 ] and (4) it leads to positive economies of scale thus, decreasing production costs for local businesses [ 1 , 14 ]. Other recent studies which find evidence in favor of the TLGH hypothesis include [ 44 , 52 ]. Even though literature is dominated by TLGH, few studies produce a result in support of EDTH [ 40 , 41 , 45 ]. Payne and Mervar [ 45 ] posit that tourism growth of a country is mobilized by the stability of well-designed economic policies, governance structures and investments in both physical and human capital. This positive and vibrant environment creates a series of development activities which proliferate and flourish the tourism. Pertaining to the readily available information, bi-directional causality could also exist between tourism income and economic growth [ 34 , 49 ]. From a policy view, a reciprocal tourism–economic growth relationship implies that government agendas should cater for promoting both areas simultaneously. Finally, there are some studies that do not offer support to any of the aforementioned hypotheses, suggesting that the impact between tourism and economic growth is insignificant [ 25 , 47 , 57 ]. There is a vast literature examining the relationship between tourism and growth as a result, only a selective literature review will be presented here.
Banday and Ismail [ 5 ] used ARDL cointegration model to test the relationship between tourism revenue and economic growth in BRICS countries from the time period of (1995–2013). The study validates the tourism-led growth hypothesis for BRICS countries, which evinces that tourism has positive influence on economic growth.
Savaş et al. [ 54 ] evaluated the tourism-led growth hypothesis in the context of Turkey. The study employed gross domestic product, real exchange rate, real total expenditure and international tourism arrivals to sketch out the causality among variables. The result reveals a unidirectional relationship between tourism and real exchange rate. The findings suggest that tourism is the driving force for economic growth, which in turn helps turkey to culminate its current account deficit.
Dhungel [ 15 ] made an effort to investigate causality between tourism and economic growth, In Nepal for the period of (1974–2012), by using Johansen’s cointegration and Error correction model. The result states that unidirectional causality exists in the long run, while in short run no causality exists between two constructs. The study emphasized that strategies should be devised to attain causality running from tourism to economic growth.
Mallick et al. [ 36 ] analyzed the nexus between economic growth and tourism in 23 Indian states over a period of 14 years (1997–2011). Using panel autoregressive distributed lag model based on three alternative estimators such as mean group estimator, pooled mean group and dynamic fixed effects, Research found that tourism exerts positive influence on economic growth in the long run.
Belloumi [ 8 ] examines the causal relationship between international tourism receipts and economic growth in Tunisia by using annual time series data for the period 1970–2007. The study uses the Johansen’s cointegration methodology to analyze the long-run relationship among the concerned variables. Granger causality based Vector error correction mechanism approach indicates that the revenues generated from tourism have a positive impact on economic growth of Tunisia. Thus, the study supports the hypothesis of tourism-driven economic growth, which is specific to developing countries that base their foreign exchange earnings on the existence of a comparative advantage in certain sectors of the economy.
Tang et al. [ 58 ] explored the dynamic Inter-relationships among tourism, economic growth and energy consumption in India for the period 1971–2012. The study employed Bounds testing approach to cointegration and generalized variance decomposition methods to analyze the relationship. The bounds testing and the Gregory-Hansen test for cointegration with structural breaks consistently reveals that energy consumption, tourism and economic growth in India are cointegrated. The study demonstrated that tourism and economic growth have positive impact on energy consumption, while tourism and economic growth are interrelated; with tourism exert significant influence on economic growth. Consequently, this study validates the tourism-led growth hypothesis in the Indian context.
Kadir and Karim [ 24 ]) examined the causal nexus between tourism and economic growth in Malaysia by applying panel time series approach for the period 1998–2005. By applying Padroni’s panel cointegration test and panel Granger causality test, the result indicated both short and long-run relationship. Further, the panel causality shows unidirectional causality directing from tourism receipts to economic growth. The result provides evidence of the significant contribution of tourism industry to Malaysia’s economic growth, thereby justifying the necessity of public intervention in providing tourism infrastructure and facilities.
Antonakakis et al. [ 2 ] test the linkage between tourism and economic growth in Europe by using a newly introduced spillover index approach. Based on monthly data for 10 European countries over the period 1995–2012, the findings suggested that the tourism–economic growth relationship is not stable over time in terms of both magnitude and direction, indicating that the tourism-led economic growth (TLEG) and the economic-driven tourism growth (EDTG) hypotheses are time-dependent. Thus, the findings of the study suggest that the same country can experience tourism-led economic growth or economic-driven tourism growth at different economic events.
Oh [ 41 ] verifies the contribution of tourism development to economic growth in the Korean economy by applying Engle and Granger two-stage approach and a bivariate Vector Autoregression model. He claimed that economic expansion lures tourists in the short run only, while there is no such long-run stable relationship between international tourism and economic development in Korea.
Empirical studies have pronouncedly focused on the literature that tourism promotes economic growth. To further substantiate the nexus, the study will investigate the plausible linkages between economic growth and international tourism while considering the relative importance of financial development in the context of BRICS nations. The inclusion of financial development in the examination of tourism-growth nexus is a unique feature of this study, which have an influencing role in economic growth as financial development has been theoretically and empirically recognized as source of comparative advantage [ 22 ].
This study employs panel ARDL cointegration approach to verify the existence of long-run association among the variables. Further, study estimated the long-run and short-run coefficients of the ARDL model. Subsequently, Dumitrescu and Hurlin [ 16 ] panel Granger causality test has been employed to check the direction of causality between tourism, financial development and economic growth among BRICS countries.
Database and methodology
Data and variables.
The study is analytical and empirical in nature, which intends to establish the relationship between economic growth and inbound tourism in BRICS countries. For the BRICS countries, limited studies have been conducted depicting the present scenario. Therefore, present study tries to verify the relevance of tourism in economic growth to further enhance the understanding of economic dynamics in BRICS countries. The data used in the study are annual figures for the period stretching from 1995 to 2015, consisting of one endogenous variable (GDP per capita, a proxy for economic growth) and two exogenous variables (international tourism receipts per capita and financial development). The variables employed in the study are based on the economic growth theory, proposed by Balassa [ 4 ], which states that export expansion has a relevant contribution in economic growth. Further, this study incorporates financial development in the model to reduce model misspecification as it is considered to have an influencing role in economic growth both theoretically and empirically [ 22 , 33 ].
The annual data for all the variables have been collected from the World Development Indicators (WDI, 2016) database. The variables used in the study includes gross domestic product per capita (GDP) in constant ($US2010) used as a proxy for economic growth (EG), international tourism receipts per capita (TR) in current US$ as it is widely accepted that the most adequate proxy of inbound tourism in a country is tourism expenditure normally expressed in terms of tourism receipts [ 32 ] and financial development (FD). In line with a recent study on the relationship between financial development and economic growth by Hassan et al. [ 19 ], financial development is surrogated by the ratio of the broad money (M3) to real GDP for all BRICS countries. Here we use the broadest definition of money (M3) as a proportion of GDP– to measure the liquid liabilities of the banking system in the economy. We use M3 as a financial depth indicator, because monetary aggregates, such as M2 or M1, may be a poor proxy in economies with underdeveloped financial systems, because they ‘are more related to the ability of the financial system to provide transaction services than to the ability to channel funds from savers to borrowers’ [ 26 ]. A higher liquidity ratio means higher intensity in the banking system. The assumption here is that the size of the financial sector is positively associated with financial services [ 29 ]. All the variables have been taken into log form.
Unit root test
To verify the long-run relationship between tourism and economic growth through Bounds testing approach, it is necessary to test for stationarity of the variables. The stationarity of all the variables can be assessed by different unit root tests. The study utilizes panel unit root test proposed by Levin et al. [ 35 ] henceforth LLC and Im et al. [ 23 ] henceforth IPS based on traditional augmented Dickey–Fuller (ADF) test. The LLC allows for heterogeneity of the intercepts across members of the panel under the null hypothesis of presence of unit root, while IPS allows for heterogeneity in intercepts as well as in the slope coefficients [ 48 ].
Panel ARDL approach to Cointegration
After checking the stationarity of the variables the study employs panel ARDL technique for Cointegration developed by Pesaran et al. [ 23 ]. Pesaran et al. [ 23 ] have introduced the pooled mean group (PMG) approach in the panel ARDL framework. According to Pesaran et al. [ 23 ], the homogeneity in the long-run relationship can be attributed to several factors such as arbitration condition, common technologies, or the institutional development which was covered by all groups. The panel ARDL bounds test [ 46 ] is more appropriate by comparing other cointegration techniques, because it is flexible regarding unit root properties of variables. This technique is more suitable when variables are integrated at different orders but not I (2). Haug [ 20 ] has argued that panel ARDL approach to cointegration provides better results for small sample data set such as in our case. The ARDL approach to cointegration estimates both long and short-run parameters and can be applied independently of variable order integration (independent of whether repressors are purely I (0), purely I(1) or combination of both. The ARDL bounds test approach used in this study is specified as follows:
where Δ is the first-difference operator, \(\alpha_{0}\) stands for constant, t is time element, \(\omega_{1} , \omega_{2} \;\;{\text{and}}\;\; \omega_{3}\) represent the short-run parameters of the model, \(\emptyset_{1} , \emptyset_{2} ,and \emptyset_{3}\) are long-run coefficients, while \(V_{it}\) is white noise error term and lastly, it represents country at a particular time period. In the ARDL model, the bounds test is applied to determine whether the variables are cointegrated or not.
This test is based on the joint significance of F -statistic and the χ 2 statistic of the Wald test. The null hypothesis of no cointegration among the variables under study is examined by testing the joint significance of the F -statistic of \(\omega_{1} , \omega_{2} ,\omega_{3}\) .
In case series variables are cointegrated, an error correction mechanism (ECM) can be developed as Eq. ( 2 ), to assess the short-run influence of international tourism and financial development on economic growth.
where ECT is the error correction term, and \(\varPhi\) is its coefficient which shows how fast the variables attain long-term equilibrium if there is any deviation in the short run. The error correction term further confirms the existence of a stable long-run relationship among the variables.
Panel granger causality test
To examine the direction of causality Dumitrescu and Hurlin [ 16 ] test is employed. Instead of pooled causality, Dumitrescu and Hurlin [ 16 ] proposed a causality based on the individual Wald statistic of Granger non-causality averaged across the cross section units. Dumitrescu and Hurlin [ 16 ] assert that traditional test allows for homogeneous analysis across all panel sets, thereby neglecting the specific causality across different units.
This approach allows heterogeneity in coefficients across cross section panels. The two statistics Wbar-statistics and Zbar-statistics provides standardized version of the statistics and is easier to compute. Wbar-statistic, takes an average of the test statistics, while the Zbar-statistic shows a standard (asymptotic) normal distribution.
They proposed an average Wald statistic that tests the null hypothesis of no causality in a panel subgroup against an alternative hypothesis of causality in at least one panel. Following equations will be used to check the direction of causality between the variables.
Estimation, results and Discussion
Descriptive statistics.
Table 1 presents descriptive statistics of variables selected for the period 1995–2015. The variable set includes GDP, FD and TR for all BRICS countries. Brazil tops the list with GDP per capita of 4.18, while India lagging behind all BRICS nations. In the recent economic survey by International Monetary Fund (IMF report 2016), India was ranked 126 for its per capita GDP. India’s GDP per capita went up to $7170 against all other BRICS countries which were placed in the above $10,000 bracket. China has the highest tourism receipts in comparison to other BRICS countries. China is a very popular country for foreign tourists, which ranks third after France and USA. In 2014, China invested $136.8 billion into its tourist infrastructure, a figure second only to the United States ($144.3 billion). Tourism, based on direct, indirect, and induced impact, accounted for near 10% in the GDP of China (WTTC report 2017).
Stationarity results
Primarily, we employed LLC and IPS unit root test to assess the integrated properties of the series. The results of IPS and PP tests are presented in Table 2 . Panel unit root test result evinces that FD and TR are stationary at level, while GDP per capita is integrated variable of order 1. The result exemplifies that GDP per capita, Tourism receipts and Financial Development are integrated at 1(0) and 1(1). Consequently, the panel ARDL approach to cointegration can be applied.
Cointegration test results
In view of the above results with a mixture of order integration, the panel ARDL approach to cointegration is the most appropriate technique to investigate whether there exists a long-run relationship among the variables [ 42 ]. Table 3 illustrates that the estimated value of F-statistics, which is higher than the lower and upper limit of the bound value, when InEG is used as a dependent variable. Hence, we reject the null hypothesis of no cointegration \(H_{0 } : \emptyset_{1} = \emptyset_{2} = \emptyset_{3} = 0\) of Eq. ( 1 ). Therefore, the result asserts that international tourism, financial development and economic growth are significantly cointegrated over the period (1995–2015).
Subsequently, the study investigates the long-run and short-run impact of international tourism and financial development on economic growth. Lag length is selected on the principle of minimum Bayesian information criterion (SBC) value, which is 2 in our case. The long-run coefficients of financial development and tourism receipts with respect to economic growth in Table 4 indicate that tourism growth and financial development exerts positive influence on economic growth in the long run. In other words, an increase in volume of tourism receipts per capita and financial depth spurs economic growth and both the coefficients are statistically significant in case of BRICS nations in the long run. The results are interpreted in detail as below:
The elasticity coefficient of economic growth with respect to tourism shows that 1% rise in international tourism receipts per capita would imply an estimated increase of almost 0.31% domestic real income in the long run, all else remaining the same. Thus, the earnings in the form of foreign exchange from international tourism affect growth performance of BRICS nations positively. This finding of our study is in consonance with the empirical results of Kreishan for Jordan [ 30 ], Balaguer and Cantavella-Jordá [ 3 ] for Spain and Ohlan [ 43 ] for India.
Further our finding lend support to the wide applicability of the new growth theory proposed by Balassa which states that export expansion promote growth performance of nations. Thus, validates TLGH coined by Balaguer and Cantavell-Jorda [ 3 ] which states that inbound tourism acts a long-run economic growth factor. The so called tourism-led growth hypothesis suggests that the development of a country’s tourism industry will eventually lead to higher economic growth and, by extension, further economic development via spillovers and other multiplier effects.
Likewise, financial development as expected is found to be positively associated with economic growth. The coefficient of financial development states that 1% improvement in financial development will push up economic growth by 0.22% in the long run, keeping all other variables constant. The empirical results are consistent with the finding of Hassan et al. [ 19 ] for a panel of South Asian countries. Well-regulated and properly functioning financial development enhances domestic production through savings, borrowings & investment activities and boosts economic growth. Further, it promotes economic growth by increasing efficiency [ 7 ]. Levine [ 33 ] believes that financial intermediaries enhance economic efficiency, and ultimately growth, by helping allocation of capital to its best use. Modern growth theory identifies two specific channels through which the financial sector might affect long-run growth; through its impact on capital accumulation and through its impact on the rate of technological progress. The sub-prime crisis which depressed the economic growth worldwide in 2007 further substantiates the growth-financial development nexus.
In the third and final step of the bounds testing procedure, we estimate short-run dynamics of variables by estimating an error correction model associated with long-run estimates. The empirical finding indicates that the coefficient of error correction term (ECT) with one period lag is negative as well as statistically significant. This finding further substantiates the earlier cointegration results between tourism, financial development and economic growth, and indicates the speed of adjustment from the short-run toward long-run equilibrium path. The coefficient of ECT reveals that the short-run divergences in economic growth from long-run equilibrium are adjusted by 43% every year following a short-run shock.
The short-run parameters in Table 5 demonstrates that tourism and financial development acts as an engine of economic growth in the short run as well. The coefficient of both tourism receipts per capita and financial development with one period lag is also found to be progressive and significant in the short run. These results highlight the role of earnings from international tourism and financial stability as an important driving force of economic growth in BRICS nations in the short run as well.
Further, a comparison between short-run and long-run elasticity coefficients evince that long-run responsiveness of economic growth with respect to tourism and financial development is higher than that of short run. It exemplifies that over time higher international tourism receipts and well-regulated financial system in BRICS nations give more boost to economic growth.
Analysis of causality
At this stage, we investigate the causality between tourism, financial development and economic growth presented in Table 6 . The result shows bi-directional causal relationship between tourism and economic growth, thereby validates ‘feedback hypothesis’ and consequently supported both the tourism-led growth hypothesis (TLGH) and its reciprocal, the economic-driven tourism growth hypothesis (EDTH). The bi-directional causality between inbound tourism and GDP, which directs the level of economic activity and tourism growth, mutually influences each other in that a high volume of tourism growth leads to a high level of economic development and reverse also holds true. These results replicate the findings of Banday and Ismail [ 5 ] in the context of BRICS countries, Yazdi et al. [ 27 ] for Iran and Kim et al. [ 28 ] for Taiwan. One of the channels through which tourism spurs economic growth is through the use of receipts earned in the form of foreign currency. Thus, growth in foreign earnings may allow the import of technologically advances goods that will favor economic growth and vice versa. Thus, results demonstrate that international tourism promotes growth and in turn economic expansion is necessary for tourism development in case of BRICS countries. With respect to policy context, this finding suggests that the BRICS nations should focus on economic policies to promote tourism as a potential source of economic growth which in turn will further promote tourism growth.
Similarly, in case of economic growth and financial development, the findings demonstrate the presence of bi-directional causality between two constructs. The findings validate thus both ‘demand following’ and supply leading’ hypothesis. The findings suggests that indeed financial development plays a crucial role in promoting economic activity and thus generating economic growth for these countries and reverse also holds. Our findings are in line with Pradhan [ 48 ] in case of BRICS countries and Hassan et al. [ 19 ] for low and middle-income countries. This suggests that finance development can be used as a policy variable to foster economic growth in the five BRICS countries and vice versa. The study emphasizes that the current economic policies should recognize the finance-growth nexus in BRICS in order to maintain sustainable economic development in the economy. The empirical results in this paper are in line with expectations, confirming that the emerging economies of the BRICS are benefiting from their finance sectors.
Finally, two-sided causal relationship is found between tourism receipts and financial development. That is, tourism might contribute to financial development and, in return, financial development may positively contribute to tourism. This means that financial depth and tourism in BRICS have a reinforcing interaction. The positive impact of tourism on financial development can be attributed to the fact that inflows of foreign exchange via international tourism not only increases income levels but also leads to rise in official reserves of central banks. This in turn enables central banks to adapt expansionary monetary policy. The positive contribution of financial sector to tourism is further characterized by supply leading hypothesis. Further, better financial and market conditions will attract tourism entrepreneurship, because firms will be able to use more capital instead of being forced to use leveraging [ 13 ]. Hence, any shocks in money supply could adversely affect tourism industry in these countries. Song and Lin [ 56 ] found that global financial crisis had a negative impact on both inbound and outbound tourism in Asia. This result is in consistent with Başarir and Çakir [ 6 ] for Turkey and four European countries.
Stability tests
In addition, to test the stability of parameters estimated and any structural break in the model CUSUM and CUSUMSQ tests are employed. Figs. 1 and 2 show blue line does not transcend red lines in both the tests, thus provides strong evidence that our estimated model is fit and valid policy implications can be drawn from the results.

Plot of CUSUM

Plot of CUSUMQ
Summary and concluding remarks
A rigorous study of the relationship between tourism and economic growth, through the tourism-led growth hypothesis (TLGH) perspective has remained a debatable issue in the economic growth literature. This study aims to empirically investigate the relationship between inbound tourism, financial development and economic growth in BRICS countries by utilizing the panel data over the period 1995–2015. The study employs the panel ARDL approach to cointegration and Dumitrescu-Hurlin panel Granger causality test to detect the direction of causation.
To the best of authors’ knowledge, this is the first study which explored the relationship between economic growth and tourism while considering the relative importance of financial development in the context of BRICS nations. The empirical results of ARDL model posits that in BRICS countries inbound tourism, financial development and economic growth are significantly cointegrated, i.e., variables have stable long-run relationship. This methodology has allowed obtaining elasticities of economic growth with respect to tourism and financial development both in the long run and short run. The result reveals that international tourism growth and financial development positively affects economic growth both in the long run and short run. The coefficient of tourism indicates that with a 1% rise in tourism receipts per capita, GDP per capita of BRICS economies will go up by 0.31% in the long run. This finding lends support to TLGH coined by Balaguer and Cantavell-Jorda [ 3 ] which states that inbound tourism acts a long-run economic growth factor. The so called tourism-led growth hypothesis suggests that the development of a country’s tourism industry will eventually lead to higher economic growth and, by extension, further economic development via spillovers and other multiplier effects.
Likewise, 1% improvement in financial development, on average, will increase economic growth in BRICS countries by 0.22% in the long run. The result seems logical as modern growth theory identifies two channels through which the financial sector might affect long-run growth: first, through its impact on capital accumulation and secondly, through its impact on the rate of technological progress. The sub-prime crisis which hit the economic growth Worldwide in 2007 further substantiates the growth-financial development nexus.
The negative and statistically significant coefficient of lagged error correction term (ECT) further substantiates the long-run equilibrium relationship among variables. The negative coefficient of ECT also shows the speed of adjustment toward long-run equilibrium is 43% per annum if there is any short-run deviation. The estimates of parameters are found to be stable by applying CUSUM and CUSUMQ for the time period under consideration. Therefore, inbound tourism earnings and financial institutions can be used as a channel to increase economic growth in BRICS economies.
Further, Granger causality test result indicates the bi-directional causation in all cases. Hence, the causal relationship between international tourism and economic growth is bi-directional. And, consequently this empirical finding lends support to both the tourism-led growth hypothesis (TLGH) and its reciprocal, the economic-driven tourism growth hypothesis (EDTH). This means that tourism is not only an engine for economic growth, but the economic outcome on itself can play an important role in providing growth potential to tourism sector.
The Granger causality findings provide useful information to governments to examine their economic policy, to adjust priorities regarding economic investment, and boost their economic growth with the given limited resources. Thus, it is suggested that more resources should be allocated to tourism industry and tourism-related industries if the tourism-led growth hypothesis holds true. On the other side, if economic-driven tourism growth is supported then more resources should be diverted to leading industries rather than the travel and tourism sector, and the tourism industry will in turn benefit from the resulting overall economic growth. And, when bi-directional causality is detected, a balanced allocation of economic resources for the travel and tourism sector and other industries is important and necessary. The policy implication is that resource allocation supporting both the tourism and tourism-related industries could benefit both tourism development and economic growth.
To sum up, the major finding of this study lends support to wide applicability of the tourism-led growth hypothesis in case of BRICS countries. Thus, in the Policy context, significant impact of tourism on BRICS economy rationalizes the need of encouraging tourism. Tourism can spur economic prosperity in these countries and for this reason; policymakers should give serious consideration toward encouraging tourism industry or inbound tourism. BRICS countries should focus more on tourism infrastructure, such as, convenient transportation, alluring destinations, suitable tax incentives, viable hostels and proper security arrangements to attract the potential tourists. Most of these countries are devoid of rich facilities and popular tourist incentives, to get promoted as important destination and in the long-run promotes economic growth. Further, they need a staunch support from all sections of authorities, non-government organizations (NGOs), and private and allied industries, in the endeavor to attain sustainable growth in tourism. Both state and non-state actors must recognize this growing industry and its positive implication on economy.
For future research, we suggest that researchers should consider the nonlinear factor in the dynamic relationship of tourism and economic growth in case of BRICS countries. Further one can go for comparative study to examine the TLGH in BRICS countries.
Availability of data and materials
Data used in the study can be provided by the corresponding author on request.
There are no fixed definitions of short, medium and long run and generally in macroeconomics, short run can be viewed as 1 to 2 or 3 years, medium up to 5 years and long run from 5 years to 20 or 25 years.
Abbreviations
autoregressive distributed lag model
Brazil, Russia, India, China and South-Africa
United Nations World Tourism Organization
World Travel & Tourism Council
gross domestic product
world development indicators
tourism-led growth hypothesis
export-led growth hypothesis
economic-driven tourism hypothesis
augmented Dickey–Fuller test
error correction model
error correction term
Andriotis K (2002) Scale of hospitality firms and local economic development—evidence from Crete. Tourism Manag 23(4):333–341
Google Scholar
Antonakakis N, Dragouni M, Filis G (2015) How strong is the linkage between tourism and economic growth in Europe? Econ Modell 44:142–155
Balaguer J, Cantavella-Jorda M (2002) Tourism as a long-run economic growth factor: the Spanish case. Appl Econ 34(7):877–884
Balassa B (1978) Exports and economic growth: further evidence. J Dev Econ 5(2):181–189
Banday UJ, Ismail S (2017) Does tourism development lead positive or negative impact on economic growth and environment in BRICS countries? A panel data analysis. Econ Bull 37(1):553–567
Basarir C, Çakir YN (2015) Causal interactions between CO 2 emissions, financial development, energy and tourism. Asian Econ Financ Rev 5(11):1227
Bell C, Rousseau PL (2001) Post-independence India: a case of finance-led industrialization? J Dev Econ 65(1):153–175
Belloumi M (2010) The relationship between tourism receipts, real effective exchange rate and economic growth in Tunisia. Int J Tour Res 12(5):550–560
Blake A, Sinclair MT, Soria JAC (2006) Tourism productivity: evidence from the United Kingdom. Ann Tourism Res 33(4):1099–1120
Brida JG, Pulina M (2010) A literature review on the tourism-led-growth hypothesis. Working paper CRENoS201017. Centre for North South Economic Research, Sardinia
Brida JG, Cortes-Jimenez I, Pulina M (2016) Has the tourism-led growth hypothesis been validated? A literature review. Curr Issues Tourism 19(5):394–430
Chatziantoniou I, Filis G, Eeckels B, Apostolakis A (2013) Oil prices, tourism income and economic growth: a structural VAR approach for European Mediterranean countries. Tourism Manag 36:331–341
Chen M-H (2010) The economy, tourism growth and corporate performance in the Taiwanese hotel industry. Tourism Manag 31:665–675
Croes R (2006) A paradigm shift to a new strategy for small island economies: embracing demand side economics for value enhancement and long term economic stability. Tourism Manag 27:453–465
Dhungel KR (2015) An econometric analysis on the relationship between tourism and economic growth: empirical evidence from Nepal. Int J Econ Financ Manag 3(2):84–90
Dumitrescu EI, Hurlin C (2012) Testing for Granger non-causality in heterogeneous panels. Econ Modell 29(4):1450–1460
Daniel Mminele (2016) The role of BRICS in the global economy. Speech at the Bundesbank Regional Office in North Rhine-Westphalia, Düsseldorf, Germany. https://www.bis.org/review/r160720c.pdf
Goldsmith RW (1969) Financial structure and development (No. HG174 G57)
Hassan MK, Sanchez B, Yu JS (2011) Financial development and economic growth: new evidence from panel data. Quart Rev Econ Financ 51(1):88–104
Haug AA (2002) Temporal aggregation and the power of cointegration tests: A Monte Carlo study. Oxf Bull Econ Stat 64:399–412
Henry EW, Deane B (1997) The contribution of tourism to the economy of Ireland in 1990 and 1995. Tourism Manag 18(8):535–553
Hur J, Raj M, Riyanto YE (2006) Finance and trade: a cross-country empirical analysis on the impact of financial development and asset tangibility on international trade. World Dev 34(10):1728–1741
Im KS, Pesaran MH, Shin Y (2003) Testing for unit roots in heterogeneous panels. J Econ 115(1):53–74
Kadir N, Karim MZA (2012) Tourism and economic growth in Malaysia: evidence from tourist arrivals from Asean-S countries. Econ Res Ekonomska istraživanja 25(4):1089–1100
Katircioglu S (2009) Testing the tourism-led growth hypothesis: the case of Malta. Acta Oeconomica 59(3):331–343
Khan M, Senhadji A (2003) Financial development and economic growth: a review and new evidence. J Afr Econ 12:89–110
Khoshnevis Yazdi S, Homa Salehi K, Soheilzad M (2017) The relationship between tourism, foreign direct investment and economic growth: evidence from Iran. Curr Issues Tourism 20(1):15–26
Kim HJ, Chen MH (2006) Tourism expansion and economic development: the case of Taiwan. Tourism Manag 27(5):925–933
King R, Levine R (1993) Finance, entrepreneurship, and growth: theory and evidence. J Monet Econ 32:513–542
Kreishan FM (2010) Tourism and economic growth: the case of Jordan. Eur J Soc Sci 15:229–234
Krueger A (1980) Trade policy as an input to development. Am Econ Rev 70:188–292
Kumar RR (2014) Exploring the role of technology, tourism and financial development: an empirical study of Vietnam. Qual Quant 48(5):2881–2898
Levine R (1997) Financial development and economic growth: views and agenda. J Econ Lit 35(2):688–726
Lee CC, Chang CP (2008) Tourism development and economic growth: a closer look at panels. Tourism Manag 29(1):180–192
Levin A, Lin CF, Chu CSJ (2002) Unit root tests in panel data: asymptotic and finite-sample properties. J Econ 108(1):1–24
Mallick L, Mallesh U, Behera J (2016) Does tourism affect economic growth in Indian states? Evidence from panel ARDL model. Theor Appl Econ 23(1):183–194
Mastny L (2001) Treading lightly: new paths for international tourism. In: Peterson JA (ed) World Watch Paper 159. World Watch Institute
McKinnon RI (1964) Foreign exchange constraints in economic development and efficient aid allocation. Econ J 74(294):388–409
McKinnon RI (1973) Money and capital in economic development. The Brookings Institution, Washington
Narayan PK (2004) Economic impact of tourism on Fiji’s economy: empirical evidence from the computable general equilibrium model. Tourism Econ 10(4):419–433
Oh CO (2005) The contribution of tourism development to economic growth in the Korean economy. Tourism Manag 26(1):39–44
Ohlan R (2015) The impact of population density, energy consumption, economic growth and trade openness on CO 2 emissions in India. Nat Hazards 79(2):1409–1428
Ohlan R (2017) The relationship between tourism, financial development and economic growth in India. Future Bus J 3(1):9–22
Parrilla JC, Font AR, Nadal JR (2007) Tourism and long-term growth a Spanish perspective. Ann Tourism Res 34(3):709–726
Payne JE, Mervar A (2010) Research note: the tourism-growth nexus in Croatia. Tourism Econ 16(4):1089–1094
Pesaran MH, Shin Y, Smith RJ (2001) Bounds testing approaches to the analysis of level relationships. J Appl Econ 16(3):289–326
Po WC, Huang BN (2008) Tourism development and economic growth—a nonlinear approach. Phys A Stat Mech Appl 387(22):5535–5542
Pradhan RP, Dasgupta P, Bele S (2013) Finance, development and economic growth in BRICS: a panel data analysis. J Quant Econ 11(1–2):308–322
Ridderstaat J, Oduber M, Croes R, Nijkamp P, Martens P (2014) Impacts of seasonal patterns of climate on recurrent fluctuations in tourism demand: evidence from Aruba. Tourism Manag 41:245–256
Schumpeter JA (1911) The theory of economic development: an inquiry into profits, capital, credit, interest, and the business cycle. Harvard University Press, Cambridge, p 1934
Shaw ES (1973) Financial deepening in economic development. Oxford University Press, London
Sugiyarto G, Blake A, Sinclair MT (2003) Tourism and globalization: economic impact in Indonesia. Ann Tourism Res 30(3):683–701
Szivas E, Riley M (1999) Tourism employment during economic transition. Ann Tourism Res 26(4):747–771
Savaş B, Beşkaya A, Şamiloğlu F (2010) Analyzing the impact of international tourism on economic growth in Turkey. Uluslararası Yönetim İktisat ve İşletme Dergisi 6(12):121–136
Schubert SF, Brida JG, Risso WA (2011) The impacts of international tourism demand on economic growth of small economies dependent on tourism. Tourism Manag 32(2):377–385
Song H, Lin S (2010) Impacts of the financial and economic crisis on tourism in Asia. J Travel Res 49(1):16–30
Tang CF (2013) Temporal Granger causality and the dynamics relationship between real tourism receipts, real income and real exchange rates in Malaysia. Int J Tourism Res 15(3):272–284
Tang CF, Tiwari AK, Shahbaz M (2016) Dynamic inter-relationships among tourism, economic growth and energy consumption in India. Geosyst Eng 19(4):158–169
United Nations World Tourism Report (2014) Annual report 2014
World Travel & Tourism Council (2012) Travel & Tourism Economic Impact. World, London: World Travel & Tourism Council.
World Travel and Tourism Council (2016) Global travel and tourism economic impact update August 2016
Download references
Acknowledgements
Not applicable.
This research has received no specific funding.
Author information
Authors and affiliations.
Department of Economics, Aligarh Muslim University, Aligarh, India
Haroon Rasool & Md. Tarique
Department of Commerce, Aligarh Muslim University, Aligarh, India
Shafat Maqbool
You can also search for this author in PubMed Google Scholar
Contributions
HR has written introduction, research methodology and results and discussion part. Review of literature and data analysis was done by SM. Conclusion was written jointly by HR and SM. MT has provided useful inputs and finalized the manuscript. All authors read and approved the manuscript.
Corresponding author
Correspondence to Haroon Rasool .
Ethics declarations
Competing interests.
Authors declare that there are no competing interests.
Additional information
Publisher's note.
Springer Nature remains neutral with regard to jurisdictional claims in published maps and institutional affiliations.
Rights and permissions
Open Access This article is licensed under a Creative Commons Attribution 4.0 International License, which permits use, sharing, adaptation, distribution and reproduction in any medium or format, as long as you give appropriate credit to the original author(s) and the source, provide a link to the Creative Commons licence, and indicate if changes were made. The images or other third party material in this article are included in the article's Creative Commons licence, unless indicated otherwise in a credit line to the material. If material is not included in the article's Creative Commons licence and your intended use is not permitted by statutory regulation or exceeds the permitted use, you will need to obtain permission directly from the copyright holder. To view a copy of this licence, visit http://creativecommons.org/licenses/by/4.0/ .
Reprints and permissions
About this article
Cite this article.
Rasool, H., Maqbool, S. & Tarique, M. The relationship between tourism and economic growth among BRICS countries: a panel cointegration analysis. Futur Bus J 7 , 1 (2021). https://doi.org/10.1186/s43093-020-00048-3
Download citation
Received : 02 August 2019
Accepted : 30 November 2020
Published : 05 January 2021
DOI : https://doi.org/10.1186/s43093-020-00048-3
Share this article
Anyone you share the following link with will be able to read this content:
Sorry, a shareable link is not currently available for this article.
Provided by the Springer Nature SharedIt content-sharing initiative
- Economic growth
- Inbound tourism
- Financial development
- Cointegration
- Panel granger causality
JEL Classification
UN Tourism | Bringing the world closer

share this content
- Share this article on facebook
- Share this article on twitter
- Share this article on linkedin
International Tourism to Reach Pre-Pandemic Levels in 2024
- All Regions
- 19 Jan 2024
Following a strong 2023, international tourism is well on track to return to pre-pandemic levels in 2024.
According to the first UNWTO World Tourism Barometer of the year, international tourism ended 2023 at 88% of pre-pandemic levels , with an estimated 1.3 billion international arrivals . The unleashing of remaining pent-up demand, increased air connectivity, and a stronger recovery of Asian markets and destinations, are expected to underpin a full recovery by the end of 2024.
Middle East, Europe and Africa performed strongest in 2023
The latest UNWTO World Tourism Barometer provides a comprehensive overview of the sector's performance in 2023, tracking recovery by global region, sub-region and destination. Key takeaways include:
- The Middle East led recovery in relative terms as the only region to overcome pre-pandemic levels with arrivals 22% above 2019.
- Europe , the world's most visited region, reached 94% of 2019 levels, supported by intra-regional demand and travel from the United States.
- Africa recovered 96% of pre-pandemic visitors and Americas reached 90%.
- Asia and the Pacific reached 65% of pre-pandemic levels following the reopening of several markets and destinations. However, performance is mixed, with South Asia already recovering 87% of 2019 levels and North-East Asia around 55%.
International Tourist Arrivals (% change over 2019)
Available data shows several destinations, including both large, established destinations as well as small and emerging ones, reporting double-digit growth in international arrivals in 2023 when compared to 2019. Four sub-regions exceeded their 2019 arrival levels: Southern Mediterranean Europe, Caribbean, Central America and North Africa.
UNWTO Secretary-General Zurab Pololikashvili says: "The latest UNWTO data underscores tourism's resilience and rapid recovery, with pre-pandemic numbers expected by the end of 2024. The rebound is already having a significant impact on economies, jobs, growth and opportunities for communities everywhere. These numbers also recall the critical task of progressing sustainability and inclusion in tourism development"
International tourism hit US$1.4 trillion in 2023
The latest UNWTO data also highlights the economic impact of recovery.
- International tourism receipts reached USD 1.4 trillion in 2023 according to preliminary estimates, about 93% of the USD 1.5 trillion earned by destinations in 2019.
- Total export revenues from tourism (including passenger transport) are estimated at USD 1.6 trillion in 2023, almost 95% of the USD 1.7 trillion recorded in 2019.
- Preliminary estimates on the economic contribution of tourism, measured in tourism direct gross domestic product (TDGDP) point to USD 3.3 trillion in 2023, or 3% of global GDP. This indicates a recovery of pre-pandemic TDGDP driven by strong domestic and international tourism.
Several destinations reported strong growth in international tourism receipts during the first ten to twelve months of 2023, exceeding in some cases growth in arrivals. Strong demand for outbound travel was also reported by several large source markets this period, with many exceeding 2019 levels.
The sustained recovery is also reflected in the performance of industry indicators. According to the UNWTO Tourism Recovery Tracker, both international air capacity and passenger demand recovered about 90% of pre-pandemic levels through October 2023 (IATA). Global occupancy rates in accommodation establishments reached 65% in November, slightly above 62% in November 2022 (based on STR data).
Looking Ahead to 2024
International tourism is expected to fully recover pre-pandemic levels in 2024, with initial estimates pointing to 2% growth above 2019 levels. This central forecast by UNWTO remains subject to the pace of recovery in Asia and to the evolution of existing economic and geopolitical downside risks.
The positive outlook is reflected in the latest UNWTO Tourism Confidence Index survey, with 67% of tourism professionals indicating better or much better prospects for 2024 compared to 2023. Some 28% expect similar performance, while only 6% expect tourism performance in 2024 to be worse than last year. Key considerations include:
- There is still significant room for recovery across Asia. The reopening of several source markets and destinations will boost recovery in the region and globally.
- Chinese outbound and inbound tourism is expected to accelerate in 2024, due to visa facilitation and improved air capacity. China is applying visa-free travel for citizens of France, Germany, Italy, the Netherlands, Spain and Malaysia for a year to 30 November 2024.
- Visa and travel facilitation measures will promote travel to and around the Middle East and Africa with the Gulf Cooperation Council (GCC) countries to implement a unified tourist visa, similar to the Schengen visa, and measures to facilitate intra-African travel in Kenya and Rwanda.
- Europe is expected to drive results again in 2024. In March, Romania and Bulgaria will join the Schengen area of free movement, and Paris will host the Summer Olympics in July and August.
- Strong travel from the United States, backed by a strong US dollar, will continue to benefit destinations in the Americas and beyond. As in 2023, robust source markets in Europe, the Americas and the Middle East, will continue to fuel tourism flows and spending around the world.
- Economic and geopolitical headwinds continue to pose significant challenges to the sustained recovery of international tourism and confidence levels. Persisting inflation, high interest rates, volatile oil prices and disruptions to trade can continue to impact transport and accommodations costs in 2024.
- Against this backdrop, tourists are expected to increasingly seek value for money and travel closer to home. Sustainable practices and adaptability will also play an increasing role in consumer choice.
- Staff shortages remain a critical issue, as tourism businesses face a shortfall in labor to cope with high demand.
- The evolution of the Hamas-Israel conflict may disrupt travel in the Middle East and impact traveler confidence. Uncertainty derived from the Russian aggression against Ukraine as well as other mounting geopolitical tensions, continue to weigh on confidence.
Related links
- Download the News Release on PDF
- World Tourism Barometer | EXCERPT | Volume 22 • Issue 1 • January 2024
- World Tourism Barometer | PPT Version | Volume 22 • Issue 1 • January 2024
- UNWTO Tourism Recovery Tracker
- UNWTO World Tourism Barometer
- UNWTO Tourism Data Dashboard
Category tags
Related content.

International Tourism to End 2023 Close to 90% of Pre-P...

Tourism’s Importance for Growth Highlighted in World Ec...

International Tourism Swiftly Overcoming Pandemic Downturn

Tourism on Track for Full Recovery as New Data Shows St...

An official website of the United States government
- Special Topics
Travel and Tourism
Travel and tourism satellite account for 2017-2021.
The travel and tourism industry—as measured by the real output of goods and services sold directly to visitors—increased 64.4 percent in 2021 after decreasing 50.7 percent in 2020, according to the most recent statistics from BEA’s Travel and Tourism Satellite Account.

Data & Articles
- U.S. Travel and Tourism Satellite Account for 2017–2021 By Sarah Osborne - Survey of Current Business February 2023
- "U.S. Travel and Tourism Satellite Account for 2015–2019" By Sarah Osborne - Survey of Current Business December 2020
- "U.S. Travel and Tourism Satellite Account for 2015-2017" By Sarah Osborne and Seth Markowitz - Survey of Current Business June 2018
- Tourism Satellite Accounts 1998-2019
- Tourism Satellite Accounts Data Sheets A complete set of detailed annual statistics for 2017-2021 is coming soon -->
- Article Collection
Documentation
- Product Guide
Previously Published Estimates
- Data Archive This page provides access to an archive of estimates previously published by the Bureau of Economic Analysis. Please note that this archive is provided for research only. The estimates contained in this archive include revisions to prior estimates and may not reflect the most recent revision for a particular period.
- News Release Archive
What is Travel and Tourism?
Measures how much tourists spend and the prices they pay for lodging, airfare, souvenirs, and other travel-related items. These statistics also provide a snapshot of employment in the travel and tourism industries.
What’s a Satellite Account?

- TTSA Sarah Osborne (301) 278-9459
- News Media Connie O'Connell (301) 278-9003 [email protected]
Interactive visualization requires JavaScript
Related research and data
- Promote sustained, inclusive and sustainable economic growth, full and productive employment and decent work for all
- Air passengers
- Air passengers per fatality
- Average length of stay of international visitors
- Employment in food and beverage serving activities per 1,000 people
- Employment in tourism-related industries per 1,000 people
- Fatal airliner accidents and hijacking incidents
- Fatal airliner accidents per million commercial flights
- Fatalities from airliner accidents and hijackings
- Foreign guests in hotels and similar establishments
- Global aviation fatalities per million passengers
- International one-day trips
- International one-day trips per 1,000 people
- International tourist departures
- International tourist departures per 1,000 people
- International tourist departures per 1,000 people vs. GDP per capita
- International tourist expenditure abroad
- International tourist expenditure within the country they visit
- International tourist trips
- International tourist trips by destination region
- International tourist trips by region of origin
- International tourist trips per 1,000 people
- International trips for business and professional reasons
- International trips for personal reasons
- International trips for personal vs. business and professional reasons
- Local guests in hotels and similar establishments
- Local vs. foreign guests in hotels and similar establishments
- Monitoring of sustainable tourism
- Monthly CO₂ emissions from commercial passenger flights
- Monthly CO₂ emissions from domestic and international commercial passenger flights
- Per capita CO₂ emissions from domestic commercial passenger flights
- Per capita CO₂ emissions from commercial aviation, tourism-adjusted
- Per capita CO₂ emissions from international commercial passenger flights, tourism-adjusted Clarke & UNWTO
- Per capita CO₂ emissions from international passenger flights, tourism-adjusted Graver & World Bank
- Ratio of business trips to trips for personal reasons
- Ratio of inbound to outbound tourist trips
- Ratio of same-day trips to tourist trips
- Share of global services exports
- Trips by domestic tourists per 1,000 people
Our World in Data is free and accessible for everyone.
Help us do this work by making a donation.
10 Economic impacts of tourism + explanations + examples
Disclaimer: Some posts on Tourism Teacher may contain affiliate links. If you appreciate this content, you can show your support by making a purchase through these links or by buying me a coffee . Thank you for your support!
There are many economic impacts of tourism, and it is important that we understand what they are and how we can maximise the positive economic impacts of tourism and minimise the negative economic impacts of tourism.
Many argue that the tourism industry is the largest industry in the world. While its actual value is difficult to accurately determine, the economic potential of the tourism industry is indisputable. In fact, it is because of the positive economic impacts that most destinations embark on their tourism journey.
There is, however, more than meets the eye in most cases. The positive economic impacts of tourism are often not as significant as anticipated. Furthermore, tourism activity tends to bring with it unwanted and often unexpected negative economic impacts of tourism.
In this article I will discuss the importance of understanding the economic impacts of tourism and what the economic impacts of tourism might be. A range of positive and negative impacts are discussed and case studies are provided.
At the end of the post I have provided some additional reading on the economic impacts of tourism for tourism stakeholders , students and those who are interested in learning more.
Foreign exchange earnings
Contribution to government revenues, employment generation, contribution to local economies, development of the private sector, infrastructure cost, increase in prices, economic dependence of the local community on tourism, foreign ownership and management, economic impacts of tourism: conclusion, further reading on the economic impacts of tourism, the economic impacts of tourism: why governments invest.
Tourism brings with it huge economic potential for a destination that wishes to develop their tourism industry. Employment, currency exchange, imports and taxes are just a few of the ways that tourism can bring money into a destination.
In recent years, tourism numbers have increased globally at exponential rates, as shown in the World Tourism Organisation data below.
There are a number of reasons for this growth including improvements in technology, increases in disposable income, the growth of budget airlines and consumer desires to travel further, to new destinations and more often.

Here are a few facts about the economic importance of the tourism industry globally:
- The tourism economy represents 5 percent of world GDP
- Tourism contributes to 6-7 percent of total employment
- International tourism ranks fourth (after fuels, chemicals and automotive products) in global exports
- The tourism industry is valued at US$1trillion a year
- Tourism accounts for 30 percent of the world’s exports of commercial services
- Tourism accounts for 6 percent of total exports
- 1.4billion international tourists were recorded in 2018 (UNWTO)
- In over 150 countries, tourism is one of five top export earners
- Tourism is the main source of foreign exchange for one-third of developing countries and one-half of less economically developed countries (LEDCs)
There is a wealth of data about the economic value of tourism worldwide, with lots of handy graphs and charts in the United Nations Economic Impact Report .
In short, tourism is an example of an economic policy pursued by governments because:
- it brings in foreign exchange
- it generates employment
- it creates economic activity
Building and developing a tourism industry, however, involves a lot of initial and ongoing expenditure. The airport may need expanding. The beaches need to be regularly cleaned. New roads may need to be built. All of this takes money, which is usually a financial outlay required by the Government.
For governments, decisions have to be made regarding their expenditure. They must ask questions such as:
How much money should be spent on the provision of social services such as health, education, housing?
How much should be spent on building new tourism facilities or maintaining existing ones?
If financial investment and resources are provided for tourism, the issue of opportunity costs arises.
By opportunity costs, I mean that by spending money on tourism, money will not be spent somewhere else. Think of it like this- we all have a specified amount of money and when it runs out, it runs out. If we decide to buy the new shoes instead of going out for dinner than we might look great, but have nowhere to go…!
In tourism, this means that the money and resources that are used for one purpose may not then be available to be used for other purposes. Some destinations have been known to spend more money on tourism than on providing education or healthcare for the people who live there, for example.
This can be said for other stakeholders of the tourism industry too.
There are a number of independent, franchised or multinational investors who play an important role in the industry. They may own hotels, roads or land amongst other aspects that are important players in the overall success of the tourism industry. Many businesses and individuals will take out loans to help fund their initial ventures.
So investing in tourism is big business, that much is clear. What what are the positive and negative impacts of this?

Positive economic impacts of tourism
So what are the positive economic impacts of tourism? As I explained, most destinations choose to invest their time and money into tourism because of the positive economic impacts that they hope to achieve. There are a range of possible positive economic impacts. I will explain the most common economic benefits of tourism below.

One of the biggest benefits of tourism is the ability to make money through foreign exchange earnings.
Tourism expenditures generate income to the host economy. The money that the country makes from tourism can then be reinvested in the economy. How a destination manages their finances differs around the world; some destinations may spend this money on growing their tourism industry further, some may spend this money on public services such as education or healthcare and some destinations suffer extreme corruption so nobody really knows where the money ends up!
Some currencies are worth more than others and so some countries will target tourists from particular areas. I remember when I visited Goa and somebody helped to carry my luggage at the airport. I wanted to give them a small tip and handed them some Rupees only to be told that the young man would prefer a British Pound!
Currencies that are strong are generally the most desirable currencies. This typically includes the British Pound, American, Australian and Singapore Dollar and the Euro .
Tourism is one of the top five export categories for as many as 83% of countries and is a main source of foreign exchange earnings for at least 38% of countries.
Tourism can help to raise money that it then invested elsewhere by the Government. There are two main ways that this money is accumulated.
Direct contributions are generated by taxes on incomes from tourism employment and tourism businesses and things such as departure taxes.
Taxes differ considerably between destinations. I will never forget the first time that I was asked to pay a departure tax (I had never heard of it before then), because I was on my way home from a six month backpacking trip and I was almost out of money!
Japan is known for its high departure taxes. Here is a video by a travel blogger explaining how it works.
According to the World Tourism Organisation, the direct contribution of Travel & Tourism to GDP in 2018 was $2,750.7billion (3.2% of GDP). This is forecast to rise by 3.6% to $2,849.2billion in 2019.
Indirect contributions come from goods and services supplied to tourists which are not directly related to the tourism industry.
Take food, for example. A tourist may buy food at a local supermarket. The supermarket is not directly associated with tourism, but if it wasn’t for tourism its revenues wouldn’t be as high because the tourists would not shop there.
There is also the income that is generated through induced contributions . This accounts for money spent by the people who are employed in the tourism industry. This might include costs for housing, food, clothing and leisure Activities amongst others. This will all contribute to an increase in economic activity in the area where tourism is being developed.
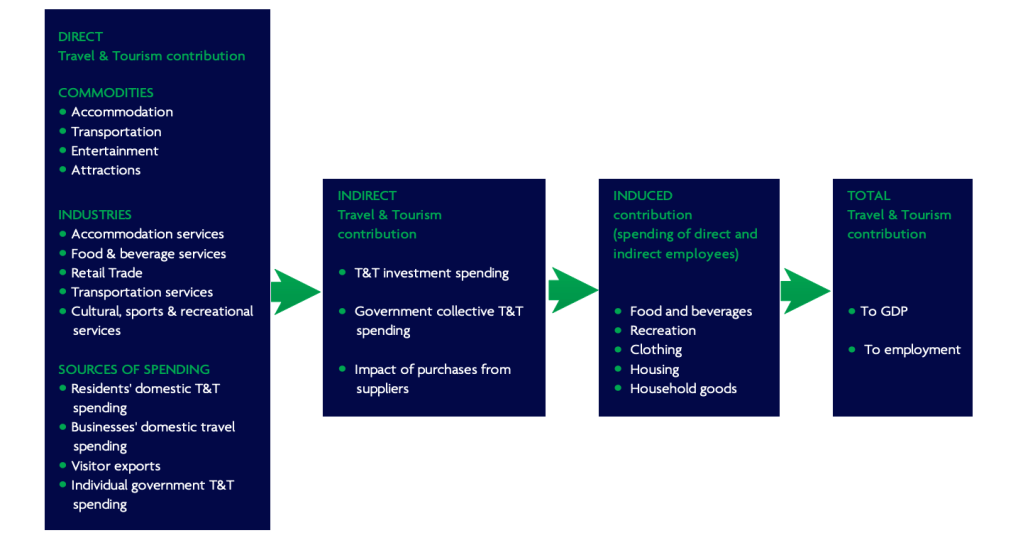
The rapid expansion of international tourism has led to significant employment creation. From hotel managers to theme park operatives to cleaners, tourism creates many employment opportunities. Tourism supports some 7% of the world’s workers.
There are two types of employment in the tourism industry: direct and indirect.
Direct employment includes jobs that are immediately associated with the tourism industry. This might include hotel staff, restaurant staff or taxi drivers, to name a few.
Indirect employment includes jobs which are not technically based in the tourism industry, but are related to the tourism industry. Take a fisherman, for example. He does not have any contact of dealings with tourists. BUT he does sell his fish to the hotel which serves tourists. So he is indirectly employed by the tourism industry, because without the tourists he would not be supplying the fish to the hotel.
It is because of these indirect relationships, that it is very difficult to accurately measure the economic value of tourism.
It is also difficult to say how many people are employed, directly and indirectly, within the tourism industry.
Furthermore, many informal employments may not be officially accounted for. Think tut tut driver in Cambodia or street seller in The Gambia – these people are not likely to be registered by the state and therefore their earnings are not declared.
It is for this reason that some suggest that the actual economic benefits of tourism may be as high as double that of the recorded figures!
All of the money raised, whether through formal or informal means, has the potential to contribute to the local economy.
If sustainable tourism is demonstrated, money will be directed to areas that will benefit the local community most.
There may be pro-poor tourism initiatives (tourism which is intended to help the poor) or volunteer tourism projects.
The government may reinvest money towards public services and money earned by tourism employees will be spent in the local community. This is known as the multiplier effect.
The multiplier effect relates to spending in one place creating economic benefits elsewhere. Tourism can do wonders for a destination in areas that may seem to be completely unrelated to tourism, but which are actually connected somewhere in the economic system.

Let me give you an example.
A tourist buys an omelet and a glass of orange juice for their breakfast in the restaurant of their hotel. This simple transaction actually has a significant multiplier effect. Below I have listed just a few of the effects of the tourist buying this breakfast.
The waiter is paid a salary- he spends his salary on schooling for his kids- the school has more money to spend on equipment- the standard of education at the school increases- the kids graduate with better qualifications- as adults, they secure better paying jobs- they can then spend more money in the local community…
The restaurant purchases eggs from a local farmer- the farmer uses that money to buy some more chickens- the chicken breeder uses that money to improve the standards of their cages, meaning that the chickens are healthier, live longer and lay more eggs- they can now sell the chickens for a higher price- the increased money made means that they can hire an extra employee- the employee spends his income in the local community…
The restaurant purchase the oranges from a local supplier- the supplier uses this money to pay the lorry driver who transports the oranges- the lorry driver pays road tax- the Government uses said road tax income to fix pot holes in the road- the improved roads make journeys quicker for the local community…
So as you can see, that breakfast that the tourist probably gave not another thought to after taking his last mouthful of egg, actually had the potential to have a significant economic impact on the local community!

The private sector has continuously developed within the tourism industry and owning a business within the private sector can be extremely profitable; making this a positive economic impact of tourism.
Whilst many businesses that you will come across are multinational, internationally-owned organisations (which contribute towards economic leakage ).
Many are also owned by the local community. This is the case even more so in recent years due to the rise in the popularity of the sharing economy and the likes of Airbnb and Uber, which encourage the growth of businesses within the local community.
Every destination is different with regards to how they manage the development of the private sector in tourism.
Some destinations do not allow multinational organisations for fear that they will steal business and thus profits away from local people. I have seen this myself in Italy when I was in search of a Starbucks mug for my collection , only to find that Italy has not allowed the company to open up any shops in their country because they are very proud of their individually-owned coffee shops.
Negative economic impacts of tourism
Unfortunately, the tourism industry doesn’t always smell of roses and there are also several negative economic impacts of tourism.
There are many hidden costs to tourism, which can have unfavourable economic effects on the host community.
Whilst such negative impacts are well documented in the tourism literature, many tourists are unaware of the negative effects that their actions may cause. Likewise, many destinations who are inexperienced or uneducated in tourism and economics may not be aware of the problems that can occur if tourism is not management properly.
Below, I will outline the most prominent negative economic impacts of tourism.

Economic leakage in tourism is one of the major negative economic impacts of tourism. This is when money spent does not remain in the country but ends up elsewhere; therefore limiting the economic benefits of tourism to the host destination.
The biggest culprits of economic leakage are multinational and internationally-owned corporations, all-inclusive holidays and enclave tourism.
I have written a detailed post on the concept of economic leakage in tourism, you can take a look here- Economic leakage in tourism explained .

Another one of the negative economic impacts of tourism is the cost of infrastructure. Tourism development can cost the local government and local taxpayers a great deal of money.
Tourism may require the government to improve the airport, roads and other infrastructure, which are costly. The development of the third runway at London Heathrow, for example, is estimated to cost £18.6billion!
Money spent in these areas may reduce government money needed in other critical areas such as education and health, as I outlined previously in my discussion on opportunity costs.

One of the most obvious economic impacts of tourism is that the very presence of tourism increases prices in the local area.
Have you ever tried to buy a can of Coke in the supermarket in your hotel? Or the bar on the beachfront? Walk five minutes down the road and try buying that same can in a local shop- I promise you, in the majority of cases you will see a BIG difference In cost! (For more travel hacks like this subscribe to my newsletter – I send out lots of tips, tricks and coupons!)
Increasing demand for basic services and goods from tourists will often cause price hikes that negatively impact local residents whose income does not increase proportionately.
Tourism development and the related rise in real estate demand may dramatically increase building costs and land values. This often means that local people will be forced to move away from the area that tourism is located, known as gentrification.
Taking measures to ensure that tourism is managed sustainably can help to mitigate this negative economic impact of tourism. Techniques such as employing only local people, limiting the number of all-inclusive hotels and encouraging the purchasing of local products and services can all help.
Another one of the major economic impacts of tourism is dependency. Many countries run the risk of becoming too dependant on tourism. The country sees $ signs and places all of its efforts in tourism. Whilst this can work out well, it is also risky business!
If for some reason tourism begins to lack in a destination, then it is important that the destination has alternative methods of making money. If they don’t, then they run the risk of being in severe financial difficulty if there is a decline in their tourism industry.
In The Gambia, for instance, 30% of the workforce depends directly or indirectly on tourism. In small island developing states, percentages can range from 83% in the Maldives to 21% in the Seychelles and 34% in Jamaica.
There are a number of reasons that tourism could decline in a destination.
The Gambia has experienced this just recently when they had a double hit on their tourism industry. The first hit was due to political instability in the country, which has put many tourists off visiting, and the second was when airline Monarch went bust, as they had a large market share in flights to The Gambia.
Other issues that could result in a decline in tourism includes economic recession, natural disasters and changing tourism patterns. Over-reliance on tourism carries risks to tourism-dependent economies, which can have devastating consequences.

The last of the negative economic impacts of tourism that I will discuss is that of foreign ownership and management.
As enterprise in the developed world becomes increasingly expensive, many businesses choose to go abroad. Whilst this may save the business money, it is usually not so beneficial for the economy of the host destination.
Foreign companies often bring with them their own staff, thus limiting the economic impact of increased employment. They will usually also export a large proportion of their income to the country where they are based. You can read more on this in my post on economic leakage in tourism .
As I have demonstrated in this post, tourism is a significant economic driver the world over. However, not all economic impacts of tourism are positive. In order to ensure that the economic impacts of tourism are maximised, careful management of the tourism industry is required.
If you enjoyed this article on the economic impacts of tourism I am sure that you will love these too-
- Environmental impacts of tourism
- The 3 types of travel and tourism organisations
- 150 types of tourism! The ultimate tourism glossary
- 50 fascinating facts about the travel and tourism industry
- 23 Types of Water Transport To Keep You Afloat
Liked this article? Click to share!
Travel, Tourism & Hospitality
Travel and tourism in the U.S. - statistics & facts
What are the most popular travel destinations in the u.s., u.s. travel trends, key insights.
Detailed statistics
Tourism contribution to GDP in the U.S. 2019-2022
Total travel expenditures in the U.S. 2019-2026
Number of domestic leisure and business trips in the U.S. 2019-2026
Editor’s Picks Current statistics on this topic
Current statistics on this topic.
International travel spending in the U.S. 2019-2026
Leading city destinations in the U.S. 2019, by number of international arrivals
Related topics
Recommended.
- National park tourism in the U.S.
- Millennial travel behavior in the U.S.
- Tourism worldwide
- Hotel industry worldwide
- Sustainable tourism worldwide
Recommended statistics
Industry overview.
- Basic Statistic Tourism contribution to GDP in the U.S. 2019-2022
- Premium Statistic Total travel expenditures in the U.S. 2019-2026
- Premium Statistic Direct travel spending in the U.S. 2019-2022, by traveler type
- Basic Statistic Countries that visited the U.S. the most 2019-2022
- Basic Statistic Leading outbound travel markets in the U.S. 2019-2022, country
- Basic Statistic Contribution of travel and tourism to employment in the U.S. 2019-2022
- Premium Statistic Most visited states in the U.S. 2022
Total contribution of travel and tourism to the gross domestic product (GDP) in the United States in 2019 and 2022 (in trillion U.S. dollars)
Total travel spending in the United States from 2019 to 2022, with a forecast until 2026 (in trillion U.S. dollars)
Direct travel spending in the U.S. 2019-2022, by traveler type
Total direct travel spending in the United States from 2019 to 2022, by type of traveler (in billion U.S. dollars)
Countries that visited the U.S. the most 2019-2022
Distribution of international tourist arrivals in the United States in 2019 and 2022, by country
Leading outbound travel markets in the U.S. 2019-2022, country
Distribution of outbound tourist departures in the United States in 2019 and 2022, by country
Contribution of travel and tourism to employment in the U.S. 2019-2022
Contribution of travel and tourism to employment in the United States in 2019 and 2022 (in millions)
Most visited states in the U.S. 2022
Most visited states by adults in the United States as of September 2022
Key players
- Premium Statistic Leading holiday travel provider websites in the U.S. Q2 2023, by share of voice
- Premium Statistic Most downloaded travel apps in the U.S. 2022, by aggregated number of downloads
- Premium Statistic Number of aggregated downloads of leading online travel agency apps in the U.S. 2023
- Basic Statistic American Customer Satisfaction Index for internet travel companies U.S. 2002-2023
- Premium Statistic American Customer Satisfaction Index for hotel companies in the U.S. 2008-2023
Leading holiday travel provider websites in the U.S. Q2 2023, by share of voice
Leading travel brands in the United States in 2nd quarter 2023, by share of voice
Most downloaded travel apps in the U.S. 2022, by aggregated number of downloads
Most downloaded travel apps in the United States in 2022, by aggregated number of downloads (in millions)
Number of aggregated downloads of leading online travel agency apps in the U.S. 2023
Number of aggregated downloads of selected leading online travel agency apps in the United States in 2023 (in millions)
American Customer Satisfaction Index for internet travel companies U.S. 2002-2023
American Customer Satisfaction Index Scores for internet travel companies in the United States from 2002 to 2023
American Customer Satisfaction Index for hotel companies in the U.S. 2008-2023
American Customer Satisfaction Index scores for hotel companies in the United States from 2008 to 2023
- Premium Statistic U.S. hotel and motel industry market size 2012-2022
- Premium Statistic Number of hotel jobs in the U.S. 2019-2022
- Premium Statistic ADR of hotels in the U.S. 2001-2022
- Premium Statistic Occupancy rate of the U.S. hotel industry 2001-2022
- Premium Statistic Revenue per available room of the U.S. hotel industry 2001-2022
- Premium Statistic Change in monthly number of hotel bookings in the U.S. 2020-2023
- Premium Statistic YoY monthly change in number of online hotel searches in the U.S. 2020-2023
U.S. hotel and motel industry market size 2012-2022
Market size of the hotel and motel sector in the United States from 2012 to 2022 (in billion U.S. dollars)
Number of hotel jobs in the U.S. 2019-2022
Number of hotel jobs in the United States from 2019 to 2022, with a forecast for 2023 (in millions)
ADR of hotels in the U.S. 2001-2022
Average daily rate of hotels in the United States from 2001 to 2022 (in U.S. dollars)
Occupancy rate of the U.S. hotel industry 2001-2022
Occupancy rate of the hotel industry in the United States from 2001 to 2022
Revenue per available room of the U.S. hotel industry 2001-2022
Revenue per available room (RevPAR) of hotel industry in the United States from 2001 to 2022 (in U.S. dollars)
Change in monthly number of hotel bookings in the U.S. 2020-2023
Year-over-year monthly change in number of hotel bookings in the United States from 2020 to 2023
YoY monthly change in number of online hotel searches in the U.S. 2020-2023
Year-over-year monthly change in number of online hotel searches in the United States from 2020 to 2023
Attractions
- Premium Statistic Leading museums by highest attendance worldwide 2019-2022
- Basic Statistic Most visited amusement and theme parks worldwide 2019-2022
- Premium Statistic U.S. amusement park industry market size 2011-2022
- Premium Statistic Landmarks most recommended visitors in the U.S. 2022
Leading museums by highest attendance worldwide 2019-2022
Most visited museums worldwide from 2019 to 2022 (in millions)
Most visited amusement and theme parks worldwide 2019-2022
Leading amusement and theme parks worldwide from 2019 to 2022, by attendance (in millions)
U.S. amusement park industry market size 2011-2022
Market size of the amusement park sector in the United States from 2011 to 2022 (in billion U.S. dollars)
Landmarks most recommended visitors in the U.S. 2022
Most recommended landmarks by visitors in the United States as of September 2022
City tourism
- Basic Statistic City destinations with the highest direct travel and tourism GDP worldwide 2022
- Premium Statistic World's highest-priced business travel destinations Q4 2022
- Basic Statistic Selected cities with the highest hotel rates in the U.S. as of September 2023
- Basic Statistic Most affordable cities for backpacking in the U.S. 2023, by daily price
- Premium Statistic Average price per night of Airbnb listings in selected U.S. cities 2024
- Premium Statistic Number of Airbnb listings in selected U.S. cities 2024
City destinations with the highest direct travel and tourism GDP worldwide 2022
Leading city tourism destinations worldwide in 2022, ranked by direct contribution of travel and tourism to GDP (in billion U.S. dollars)
World's highest-priced business travel destinations Q4 2022
Most expensive cities for business tourism worldwide in 4th quarter 2022, by average daily costs (in U.S. dollars)
Selected cities with the highest hotel rates in the U.S. as of September 2023
Selected cities with the most expensive hotel rates in the United States as of September 2023 (in U.S. dollars)
Most affordable cities for backpacking in the U.S. 2023, by daily price
Most affordable cities for backpacking in the United States as of January 2023, by daily price (in U.S. dollars)
Average price per night of Airbnb listings in selected U.S. cities 2024
Average price per night of Airbnb listings in selected cities in the United States as of February 2024 (in U.S. dollars)
Number of Airbnb listings in selected U.S. cities 2024
Number of Airbnb listings in selected cities in the United States as of February 2024
Sustainable tourism
- Premium Statistic Travelers who find sustainable travel important in the U.S. 2022
- Premium Statistic Share of travelers that plan to make sustainable travel choices in the U.S. 2022
- Premium Statistic How much more travelers would pay to make a trip more sustainable in the U.S. 2022
- Premium Statistic U.S. consumers who have paid extra for sustainable travel in the past two years 2022
- Premium Statistic U.S. consumers willing to pay extra for a sustainable travel provider 2022
- Premium Statistic Share of U.S. travelers that feel guilty over non-eco-friendly past travel 2022
- Premium Statistic Reasons travelers were against staying in sustainable hotels in the U.S. 2022
Travelers who find sustainable travel important in the U.S. 2022
Share of travelers that think sustainable travel is important in the United States as of February 2022
Share of travelers that plan to make sustainable travel choices in the U.S. 2022
Share of travelers that intend to make more sustainable travel decisions in the United States as of March 2022
How much more travelers would pay to make a trip more sustainable in the U.S. 2022
Extra cost travelers would be willing to pay to make a trip more carbon friendly in the United States as of March 2022
U.S. consumers who have paid extra for sustainable travel in the past two years 2022
Share of consumers that have paid extra for sustainable travel in the past two years in the United States as of February 2022
U.S. consumers willing to pay extra for a sustainable travel provider 2022
Share of consumers willing to pay extra for a sustainable travel provider in the United States as of February 2022
Share of U.S. travelers that feel guilty over non-eco-friendly past travel 2022
Share of travelers that experience guilt over past trips not being sustainable in the United States as of August 2022
Reasons travelers were against staying in sustainable hotels in the U.S. 2022
Reasons travelers were against staying in a hotel with sustainable practices in the United States as of August 2022
- Premium Statistic Priorities when choosing a leisure travel destination in the U.S. 2023, by generation
- Premium Statistic Leading destinations travelers intend to visit in the next 12 months in the U.S. 2023
- Premium Statistic Trust in travel and hospitality brands in the U.S. 2023, by brand type
- Premium Statistic American Customer Satisfaction Index: travel and tourism industries in the U.S. 2023
Priorities when choosing a leisure travel destination in the U.S. 2023, by generation
Main factors for choosing a leisure travel destination among adults in the United States as of May 2023, by generation
Leading destinations travelers intend to visit in the next 12 months in the U.S. 2023
Leading leisure travel destinations travelers intend to go to in the next 12 months in the United States as of September 2023
Trust in travel and hospitality brands in the U.S. 2023, by brand type
Level of trust in travel and hospitality brands in the United States as of September 2023, by brand type
American Customer Satisfaction Index: travel and tourism industries in the U.S. 2023
American Customer Satisfaction Index for the travel and tourism sector in the United States in 2023, by industry
Further reports Get the best reports to understand your industry
Get the best reports to understand your industry.
Mon - Fri, 9am - 6pm (EST)
Mon - Fri, 9am - 5pm (SGT)
Mon - Fri, 10:00am - 6:00pm (JST)
Mon - Fri, 9:30am - 5pm (GMT)
New analysis highlights the value of foreign tourism in Greenland
In the summer of 2023, eight key players in tourism and society came together to produce an in-depth analysis of the economic impact of foreign tourism in greenland..
Press release: Nuuk, 18 April 2024

In recent years, foreign tourism in Greenland has become an increasingly important part of the country’s economy. In line with this, there is an increased need for solid data and documentation that can support both economic growth in the sector and sustainable development in the area.
In the summer of 2023, eight key players in tourism and society came together to produce an in-depth analysis of the economic impact of foreign tourism in Greenland. Among those involved were Air Greenland, Kalaallit Airports, Bank of Greenland, Bank of Greenland Business Fund, Nalik Ventures, AECO – Association of Arctic Expedition Cruise Operators, Sikuki Nuuk Harbour and Visit Greenland.
Partners believe facts and knowledge are essential for making informed decisions about future priorities and investments, which applies to political decisions and those that happen at the company level. With the prospect of new international airports and a new sector plan for the tourism sector, they want to take joint responsibility for contributing insights that can set the framework for promoting sustainable tourism in and for Greenland.
“A nuanced understanding of foreign tourism’s contribution to the national economy is essential to predict the effects of new investments and decisions. At the same time, we must have a common understanding of the socio-economic benefits tourism currently contributes to Greenland so that together, we can set goals for the economic role we want tourism to play in the country’s future. With the publication of this analysis, it is our common wish to contribute to a fact-based debate on tourism while recognizing the tourism sector as a significant socio-economic contributor,” says Visit Greenland’s CEO, Anne Nivíka Grødem.
The main results from the analysis show the following:
In 2023, foreign tourism contributed with revenue to Greenland of almost DKK 1.9 billion.
Foreign tourism amounted to a gross added value of DKK 1.2 billion, direct taxes of DKK 48 million and duties of DKK 87 billion in 2023.
Foreign tourism directly accounted for 1,075 jobs.
Continues further down the page...

By Visit Greenland
Behind Greenland's largest travel site is the Visit Greenland that is 100% owned by the Government of Greenland, who is responsible for marketing the country's adventures and opportunities for guests wishing to visit the world's largest island
Frequently Visited
- Contact Info
- Cruise Call List
- Use of our media
- Press and PR
- Adventure in Greenland
Important Links
- VisitGreenland.com
- Our photobank
- Tourism Statistics
- Big Artic Five
- Subscribe to our B2B Newsletter
Tourism ‘intrinsically susceptible’ to climate shocks, political unrest, pandemic threat

Facebook Twitter Print Email
The President of the UN General Assembly on Tuesday highlighted the urgent need to boost sustainable and resilient tourism practices to protect the environment while continuing to benefit local economies.
Addressing a high-level meeting on tourism as part of the General Assembly’s first ever Sustainability Week , Dennis Francis said it was a vital driver of economic growth and empowerment .
In 2023, the sector contributed three per cent to the global gross domestic product (GDP), amounting to $3.3 trillion, and employed one in every ten people worldwide. For countries in special situations, like small island nations, tourism accounted for nearly 35 per cent of all export earnings and up to 80 per cent of national exports .
“Despite the spectacular benefits reaped across its vast supply chains – tourism is also intrinsically susceptible to a host of disruptive forces – such as climate change, pandemics, acts of terrorism, and domestic political instability,” Mr. Francis said.
Sustainable
He expressed concerns about the sector’s environmental and carbon footprint, saying sustainability must be paramount.
“We need a global tourism sector that is sustainable – one with deep local value chains that expand demand for locally made products and services in ways that also directly and positively benefit local communities,” he urged.
Moreover, he emphasized that the sector should also leverage digital technology to foster innovation and expand opportunities for jobs and economic growth, especially for women, youth, and indigenous and local communities.
“We also need a global tourism sector that is resilient,” said Mr. Francis, stressing the need to minimize its vulnerabilities and bolstering its ability to withstand external shocks.
This includes designing infrastructures that can withstand environmental disasters, fostering innovations that enhance economic and social resilience, and diversifying tourism activities to reduce recovery time after disruptive events.
Symbol of hope
Zurab Pololikashvili, head of the UN World Tourism Organization ( UNWTO ), also spoke at the General Assembly, noting that despite today’s pressing challenges, tourism offered a glimmer of hope.
Reflecting on the sector’s recovery from the COVID-19 pandemic – its most significant crisis in history – he observed that in 2023, international arrivals rebounded to almost 90 per cent of pre-pandemic levels , with full recovery expected by the end of 2024.
This recovery must serve as a catalyst for bold action and transformative change, he said, emphasizing, “tourism can – and must – be a part of this plan for a better future for all.”
Sustainability Week
The high-level event on tourism followed Monday’s deliberations on debt sustainability , where speakers outlined the crippling impact of debt on developing economies, and called for urgent reform of the global financial system.
Upcoming highlights of the week include dedicated discussions on sustainable transport, infrastructure and energy.
- General Assembly
- 2030 Agenda for Sustainable Development
- Subscribe Digital Print
- Semiconductors
- Latest News
- Deep Dive Podcast
Today's print edition
Home Delivery
- Crime & Legal
- Science & Health
- More sports
- CLIMATE CHANGE
- SUSTAINABILITY
- EARTH SCIENCE
- Food & Drink
- Style & Design
- TV & Streaming
- Entertainment news
Inbound tourism numbers hit record high, with Japan set to achieve 2025 goal

Japan is on course to achieve a government goal of topping the pre-pandemic figure of 32 million annual foreign visitors by 2025, with the January-March quarter seeing a record 8.56 million, data from the Japan National Tourism Organization showed Wednesday.
Foreign travelers also spent ¥1.8 trillion during the January-March period, which translates to about ¥210,000 per person per stay. The total marks the highest figure on record as more people stay longer in Japan thanks to the weaker yen.
Japan also welcomed a record 3.08 million foreign visitors in March, surpassing the previous high of 2.99 million from July 2019, JNTO said.
The spike in numbers can be attributed to the Easter holiday in March, when there were more travelers from Western countries such as Australia and the United States, as well as the attraction of the cherry blossom season.
In 2023, about 25 million visitors came to Japan, spending a record ¥5.3 trillion, with a single tourist on average spending around ¥210,000 per stay.
The figures have already surpassed a target — set at ¥5 trillion total and ¥200,000 on average — that had been fixed for 2025 in the government’s tourism strategy and goals, which were drafted in 2023.
However, other goals in the plan have yet to be reached, and the government held the ministerial meeting on Wednesday evening to discuss their efforts and further plans.

For instance, one of the goals set in the basic plan is to establish sustainable tourist spots, or destinations that can continue to flourish and be self-sustainable in terms of financial, social, cultural and natural resources, with minimum impacts on the environment.
As of November, the latest figure available, there were only 31 areas that have set up such projects, well short of the government goal of 100 by 2025. The tourism agency is offering support to various local governments and destination marketing organizations to encourage more to join.
Another issue that remains is the fact that tourists still tend to congregate in urban areas. In 2023, around 70% of all visitors stayed in the three metropolitan cities of Tokyo, Osaka or Kyoto, or areas surrounding the capital such as Chiba and Kanagawa prefectures. The figure was just over 60% prior to the pandemic.
"I think the potential of rural areas is truly limitless — and we are yet to see this potential fully flourish," said Ichiro Takahashi, the head of Japan Tourism Agency. "While there is a trend of uneven distribution in the three major metropolitan areas, we would like to especially strengthen our efforts to attract visitors to these rural regions."
Meanwhile, outbound tourism remains low compared to inbound arrivals, mostly due to the weak yen and high prices abroad. In March, about 1.22 million people visited foreign countries from Japan, around 60% of the figure during the same period in 2019.
In 2023, the figure was 9.62 million, less than half of the amount recorded in 2019.
However, domestic travel through 2023 almost rebounded to 2019 levels, and individuals spent 17.8% more on average per person. The total consumption amount was ¥21.9 trillion, approaching the goal of ¥22 trillion set by the government for 2025.
Staff writer Gabriele Ninivaggi contributed to this report.

In a time of both misinformation and too much information, quality journalism is more crucial than ever. By subscribing, you can help us get the story right.
- Ground Reports
- 50-Word Edit
- National Interest
- Campus Voice
- Security Code
- Off The Cuff
- Democracy Wall
- Around Town
- PastForward
- In Pictures
- Last Laughs
- ThePrint Essential
New Delhi [India], April 15 (ANI): The travel and tourism market in India is set to generate a revenue of USD 23.72 billion in 2024, with a projected annual growth rate (CAGR 2024-2028) of 9.62 per cent, according to projections by the India Brand Equity Foundation (IBEF).
This growth trajectory is expected to propel the market volume to USD 34.25 billion by 2028.
As per Invest India, India announced 100 per cent Foreign Direct Investment (FDI) in tourism-related ventures, including the development of hotels, resorts, and recreational facilities, in a move aimed at fostering growth and development in the tourism sector as of 2023.
Prime Minister Narendra Modi has been asserting that India’s efforts in the tourism sector are centered on preserving its rich heritage while at the same time creating a world-class infrastructure for tourism.
The total FDI inflows in India for the fiscal year 2023-2024 stand at a USD 17.96 billion, with USD 11.54 billion attributed to FDI equity.
This announcement comes as the nation charts a course towards bolstering its tourism industry, positioning it as a major contributor to economic growth and job creation.
The tourism landscape in India is diverse, with the package holidays market emerging as the largest segment, projected to reach a market volume of USD 10.48 billion in 2024.
By 2028, the number of users in the package holidays market is expected to soar to 64.74 million, with a user penetration rate increasing from 7.8 per cent in 2024 to 10.0 per cent in 2028.
The average revenue per user (ARPU) in this segment is forecasted to be USD 209.70 by 2028, with online sales expected to contribute 60 per cent of the total revenue in the travel and tourism market in India.
In alignment with global trends, India’s tourism industry is undergoing a transformation, with a focus on promoting sustainable and eco-friendly travel options to attract travelers.
The sector is poised to make significant contributions to the country’s GDP, with projections indicating that it will contribute USD 250 billion by 2030, generating employment for 137 million individuals.
In a recent development on March 7, Prime Minister Narendra Modi dedicated and launched 52 tourism sector projects worth more than Rs 1400 crores under the Swadesh Darshan and PRASHAD Scheme.
These projects encompass various aspects of tourism infrastructure development, including pilgrimage sites, heritage destinations, and recreational facilities, with a focus on enhancing visitor experiences and promoting local communities’ participation in tourism initiatives.
During the event, Prime Minister Modi also unveiled visionary campaigns and schemes aimed at fostering growth in the tourism sector, including the ‘Dekho Apna Desh People’s Choice 2024’ and ‘Chalo India Global Diaspora Campaign.’
These initiatives seek to engage citizens and the Indian diaspora in promoting tourism and showcasing India’s rich cultural heritage and diverse attractions.
The revamped Swadesh Darshan 2.0 Scheme underscores the government’s commitment to integrated destination development and community engagement in tourism projects.
With India’s tourism industry poised for exponential growth, driven by factors such as world-class infrastructure development, evolving technology landscape, and rising disposable incomes, the nation is poised to emerge as a leading global tourism destination.
Through strategic partnerships, innovative campaigns, and concerted efforts towards sustainable tourism, India is set to unlock its vast potential and position itself as a premier destination for travelers worldwide. (ANI)
This report is auto-generated from ANI news service. ThePrint holds no responsibility for its content.
Subscribe to our channels on YouTube , Telegram & WhatsApp
Support Our Journalism
India needs fair, non-hyphenated and questioning journalism, packed with on-ground reporting. ThePrint – with exceptional reporters, columnists and editors – is doing just that.
Sustaining this needs support from wonderful readers like you.
Whether you live in India or overseas, you can take a paid subscription by clicking here .
LEAVE A REPLY Cancel
Save my name, email, and website in this browser for the next time I comment.
Most Popular
As modi makes 6th trip to kerala this yr, a look at constituencies where bjp aims to put up tough fight, bjp’s ‘ab ki baar 400 paar’ push isn’t a new idea. it’s a political pledge from 73 years ago, everyone says ‘aayega to modi hi’—some with a drumroll, many with despair.
Required fields are marked *
Copyright © 2024 Printline Media Pvt. Ltd. All rights reserved.
- Terms of Use
- Privacy Policy
We have updated our terms and conditions and privacy policy Click "Continue" to accept and continue with ET TravelWorld
We use cookies to ensure best experience for you
We use cookies and other tracking technologies to improve your browsing experience on our site, show personalize content and targeted ads, analyze site traffic, and understand where our audience is coming from. You can also read our privacy policy , We use cookies to ensure the best experience for you on our website.
By choosing I accept, or by continuing being on the website, you consent to our use of Cookies and Terms & Conditions .
- Leaders Speak
- Brand Solutions
- India's travel and tourism sector poised for growth: Projected revenue to reach USD 23.72 bn by 2024
The total FDI inflows in India for the fiscal year 2023-2024 stand at a USD 17.96 billion, with USD 11.54 billion attributed to FDI equity. This announcement comes as the nation charts a course towards bolstering its tourism industry, positioning it as a major contributor to economic growth and job creation.
- Updated On Apr 16, 2024 at 01:37 PM IST

New York City expects 65 million visitors this year with over 3.8 lakh visitors from India
New York City is home to the world’s busiest airport system and the number one port of entry for US international travellers. New York City welcomed a total 61.8 million travellers in 2023, marking a recovery of 93 per cent of the City’s record 2019 visitation levels. New York City welcomed 336,000 India travellers – marking full recovery of the market’s pre-pandemic visitation levels.
- Published On Apr 16, 2024 at 01:36 PM IST
All Comments
By commenting, you agree to the Prohibited Content Policy
Find this Comment Offensive?
- Foul Language
- Inciting hatred against a certain community
- Out of Context / Spam
Join the community of 2M+ industry professionals
Subscribe to our newsletter to get latest insights & analysis., download ettravelworld app.
- Get Realtime updates
- Save your favourite articles
- tourism sector growth
- India travel market
- FDI in tourism
- Prime Minister Narendra Modi
- tourism industry projections
- package holidays market
- tourism infrastructure development
- global tourism destination
- tourism initiatives
- India Brand Equity Foundation (IBEF)
What is a tourist tax? Fees for foreign tourists at hot summer destinations
Many countries across Europe have implemented fees for foreign visitors.
Barcelona is among the top 20 summer destinations of 2024, and for anyone planning to visit the bustling Mediterranean metropolis known for its art and architecture, or other tourist-filled hotspots during high-season, there may be some additional costs to consider.
Many countries across Europe including Spain, Greece, and Germany have implemented fees for foreign visitors to help support local costs of doing business, especially during the busy summer months. It's similar to that of a hotel occupancy tax that American travelers may be more familiar with for domestic stays.

MORE: The best luggage for kids for summer travel and beyond
What is a tourist tax.
"Tourist taxes are a rapidly growing trend," Clint Henderson, Managing Editor at The Points Guy, told "Good Morning America," adding that the fee system is increasingly popular "because it’s an easy way for cities to raise revenues without taxing local citizens. It’s also more politically palatable and it has the added benefit of helping to deal with over-tourism."
Henderson also pointed out that "Crowding at especially popular spots made famous by Instagram are simply out of control."

"Locals in places like Venice, [Italy] and Maui are also getting more vocal about problematic tourists," he said. "We think you’ll only see this trend of tourist taxes spread. Look for action from places like Hawaii in the future, which has been considering some kind of tax for a few years now."
The rural town of La Salut, located just outside Barcelona and best known for Park Güell mosaic-covered buildings, tapas bars and seafood restaurants, was recently removed from Google and Apple maps, Yahoo first reported , after being inundated with tourists taking over the locals' main bus route.
What to know about tourist fees abroad this summer
Henderson said tourism taxes "are not yet that widespread," with the caveat that "local taxes and fees are very common and often hidden in your hotel bill."
His tip? "Google your destination to see about potential fees before you go."
"Many hotels are now listing local taxes and fees in their online pricing, but you can always call ahead of time to make sure you won’t be facing additional 'destination' or 'resort' fees," he suggested.
Summer vacation destinations with a tourist tax
There are some newcomers adding a tourist tax for the first time this summer, and other nations increasing percentages that people will be expected to pay.
"Galapagos National Park is charging $200 as of August 1 to visit. Bhutan charges $100 per day. Wales and Hawaii are among the locations now considering tourist taxes," Henderson listed.

MORE: Try Before You Buy: The best neck pillows for travel
The Barcelona municipality recently increased its tourist tax from 2.75 euros to 3.25 euros on April 1.
The tourist tax for the Olympics host nation is based on a municipal rate. Typically the cost has been under $6 per night, but starting in January officials increased the visitor fee up to $17, depending on the hotel type.
Earlier this year Mayor of Seville, José Luis Sanz, announced on X plans to "close the Plaza de España and charge tourists to finance its conservation and guarantee its safety."
Sanz shared a video along with his post that showed missing tiles, damaged facades and street vendors occupying alcoves and stairs.
The southern Spanish city will now charge visitors to enter the historic area that has been at risk of irreversible damage to its famed tile floors, bridges and towers.

Earlier this year, coastal city known for it's canals, blown glass and close proximity to the heart of Italy's Prosecco region implemented a fee of 5 euro per day tripper through a new reservation system.
Travelers can download an app to pay and attain a QR code which will be shown to enter the city as a visitor.
"It is not a revolution, but the first step of a path that regulates the access of daily visitors. An experiment that aims to improve the liveability of the city, who lives there and who works there. We will carry it forward with great humility and with the awareness that there may be problems," the Mayor of Venice Luigi Brugnaro stated on X in the announcement.
"The margins of error are wide, but we are ready, with humility and courage, to make all the changes that will serve to improve the procedure. Venice is the first city in the world to implement this path, which can be an example for other fragile and delicate cities that must be safeguarded," he continued.
Related Topics
Top stories.

Trump hush money trial: Judge sets opening statements for Monday
- Apr 19, 5:15 PM

Savannah Chrisley talks about the fate of her parents Todd and Julie
- Apr 19, 6:48 PM

Man dies after setting himself on fire outside courthouse where Trump is on trial

USC cancels all commencement speakers after canceled valedictorian speech
- Apr 19, 10:02 PM

Emergency rooms refused to treat pregnant women, leaving one to miscarry in a lobby restroom
- Apr 19, 12:01 AM
ABC News Live
24/7 coverage of breaking news and live events
IMAGES
COMMENTS
International Tourism and COVID-19. Export revenues from international tourism dropped 62% in 2020 and 59% in 2021, versus 2019 (real terms) and then rebounded in 2022, remaining 34% below pre-pandemic levels. The total loss in export revenues from tourism amounts to USD 2.6 trillion for that three-year period. Go to Dashboard.
As such, international tourism can generate a tourism trade surplus when receipts exceed expenditure, or a deficit (vice versa) in the travel balance of countries. In 2019, the United States of America had the world's largest travel surplus with USD 62 billion, resulting from tourism receipts of USD 214 billion and expenditure of USD 152 billion.
4 International Tourism ighlights - 2023 Edition (Revised and updated, October 2023) In the decades leading up to 2019, tourism saw continued expansion and diversification despite occasional shocks, to become one of the largest and fastest-growing economic sectors in the world.
International tourism continues to outpace the global economy. 2. Driven by a relatively strong global economy, a growing middle class in emerging economies, technological advances, new business models, affordable travel costs and visa facilitation, international tourist arrivals grew 5% in 2018 to reach the 1.4 billion mark.
Governments have generally played a limited role in the industry, with partial oversight and light-touch management. COVID-19 has caused an unprecedented crisis for the tourism industry. International tourist arrivals are projected to plunge by 60 to 80 percent in 2020, and tourism spending is not likely to return to precrisis levels until 2024.
Ömer Y, Muhammet D, Kerem K (2018) The effects of international tourism receipts on economic growth: evidence from the first 20 highest income earning countries from tourism in the world (1996 ...
Total contribution of travel & tourism to global economy 7.71tr USD Detailed statistics ... Carbon footprint of international tourism transport worldwide 2005-2030, by type.
To accompanying the global economy recovering, international tourism demand gradually increases, which triggers the expansion of tourism sector in developing countries. As such, the dependence of growth on tourism in developing economies remains relatively similar to its GFC levels in the post-GFC period with upward tendency as shown in Figure ...
In 2023, the Travel & Tourism sector contributed 9.1% to the global GDP; an increase of 23.2% from 2022 and only 4.1% below the 2019 level. In 2023, there were 27 million new jobs, representing a 9.1% increase compared to 2022, and only 1.4% below the 2019 level. Domestic visitor spending rose by 18.1% in 2023, surpassing the 2019 level.
Tourism has become the world's third-largest export industry after fuels and chemicals, and ahead of food and automotive products. From last few years, there has been a great surge in international tourism, culminates to 7% share of World's total exports in 2016. To this end, the study attempts to examine the relationship between inbound tourism, financial development and economic growth ...
The relationship between international tourism and economic growth has been well discussed in the existing literature (e.g., Zhang and Jensen, 2007). From a theoretical point of view, tourism-led economic growth is in alignment with the well-known export-led economic growth theory which emphasises the importance of export-oriented trade policy ...
International tourism is expected to fully recover pre-pandemic levels in 2024, with initial estimates pointing to 2% growth above 2019 levels. This central forecast by UNWTO remains subject to the pace of recovery in Asia and to the evolution of existing economic and geopolitical downside risks. The positive outlook is reflected in the latest ...
Travel and Tourism Satellite Account for 2017-2021 The travel and tourism industry—as measured by the real output of goods and services sold directly to visitors—increased 64.4 percent in 2021 after decreasing 50.7 percent in 2020, according to the most recent statistics from BEA's Travel and Tourism Sate
Employment in tourism-related industries per 1,000 people. Fatal airliner accidents and hijacking incidents. Fatal airliner accidents per million commercial flights. Fatalities from airliner accidents and hijackings. Foreign guests in hotels and similar establishments. Global aviation fatalities per million passengers. International one-day trips.
Tourism Economics is an international peer reviewed journal, covering the business aspects of tourism in the wider context. It takes account of constraints on development, such as social and community interests and the sustainable use of tourism and recreation resources, and inputs into the production process.
The tourism economy represents 5 percent of world GDP ; Tourism contributes to 6-7 percent of total employment; International tourism ranks fourth (after fuels, chemicals and automotive products) in global exports ; The tourism industry is valued at US$1trillion a year; Tourism accounts for 30 percent of the world's exports of commercial services
Thanks to this influx of visitors and a boost in U.S. travel spending, the travel and tourism industry contributed over two trillion U.S. dollars to the country's GDP in 2022. Domestic leisure ...
In line with this, there is an increased need for solid data and documentation that can support both economic growth in the sector and sustainable development in the area. In the summer of 2023, eight key players in tourism and society came together to produce an in-depth analysis of the economic impact of foreign tourism in Greenland.
Tourism Statistics. Get the latest and most up-to-date tourism statistics for all the countries and regions around the world. Data on inbound, domestic and outbound tourism is available, as well as on tourism industries, employment and complementary indicators. All statistical tables available are displayed and can be accessed individually ...
Addressing a high-level meeting on tourism as part of the General Assembly's first ever Sustainability Week, Dennis Francis said it was a vital driver of economic growth and empowerment.. In 2023, the sector contributed three per cent to the global gross domestic product (GDP), amounting to $3.3 trillion, and employed one in every ten people worldwide.
Japan is on course to achieve a government goal of topping the pre-pandemic figure of 32 million annual foreign visitors by 2025, with the January-March quarter seeing a record 8.56 million, data ...
As per Invest India, India announced 100 per cent Foreign Direct Investment (FDI) in tourism-related ventures, including the development of hotels, resorts, and recreational facilities, in a move aimed at fostering growth and development in the tourism sector as of 2023. ... positioning it as a major contributor to economic growth and job ...
The World Travel & Tourism Council is projecting 2024 to be a record-breaking year for tourism's global economic contribution, amounting to $11.1 trillion. A total of 142 countries are expected to ...
Tourism Sector Growth: The total FDI inflows in India for the fiscal year 2023-2024 stand at a USD 17.96 billion, with USD 11.54 billion attributed to FDI equity. This announcement comes as the nation charts a course towards bolstering its tourism industry, positioning it as a major contributor to economic growth and job creation.
Many countries across Europe including Spain, Greece, and Germany have implemented fees for foreign visitors to help support local costs of doing business, especially during the busy summer months.