- Get One: Tornado Alert Apps
- The Best Tech Gifts Under $100

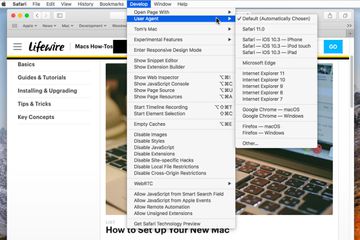
How to Enable Safari's Debug Menu to Gain Added Capabilities
Find Safari's hidden menu
Tom Nelson is an engineer, programmer, network manager, and computer network and systems designer who has written for Other World Computing,and others. Tom is also president of Coyote Moon, Inc., a Macintosh and Windows consulting firm.
What to Know
- Enable debug menu by inputting defaults write com.apple.Safari IncludeInternalDebugMenu 1 into Terminal .
- Disable debug menu by inputting defaults write com.apple.Safari IncludeInternalDebugMenu 0 into Terminal .
- Relaunch Safari after turning the debug menu on or off.
Safari long had a hidden Debug menu that contained useful capabilities. Originally intended to assist developers in debugging web pages and the JavaScript code that runs on them, the debug menu was hidden away because the commands that were included in the menu could wreak havoc on web pages. Information in this article applies to Macs running OS X El Capitan (10.11) or earlier.
Safari Debug Menu in OS X El Capitan and Earlier
With the release of Safari 4 in the summer of 2008, many useful menu items in the Debug menu were moved to the new Develop menu . However, the hidden Debug menu remained and even picked up a command or two as Safari development continued. It was removed completely from OS X Sierra and later releases of the operating system.
Apple made accessing the hidden Develop menu an easy process, only requiring a trip to the Safari's preferences. Accessing the Debug menu, on the other hand, was a bit more complicated.
Enabling the Safari debug window requires the use of Terminal , a powerful tool for accessing hidden features of the Mac operating system and its many apps. Terminal is the secret to turning on Safari’s Debug menu.
Enable Safari's Debug Menu
Close Safari if you have it open and then:
Go to Applications > Utilities and launch Terminal .
Enter the following command line into Terminal by typing it or using copy and paste. Enter the command as a single line in Terminal, even though your browser may break it into multiple lines.
Press Enter or Return .
Relaunch Safari . The new Debug menu is available.
Disable Safari’s Debug Menu
If you want to disable the Debug menu, you can do so at any time, again using Terminal. Close Safari if it is open and then:
Launch Terminal .
Relaunch Safari . The Debug menu is gone.
Favorite Safari Debug Menu Items
With the Debug menu under your control, you can try out various menu items. Not all of the menu items are usable because many are designed to be used in a development environment where you have control over the web server. Nevertheless, useful items include:
- Force Repaint
- Show Frame Rate Meter, which displays CPU load, page frame rate speed, and updates being made to the page, all in the form of analog speedometers.
- Various flag options.
- Sync iCloud History.
- Depending on the version of Safari, the option to reset and recompute Top Sites.
Get the Latest Tech News Delivered Every Day
- Enable Disk Utility's Debug Menu
- Create Your Own Mac Recovery HD on Any Drive
- Make a Bootable USB Installer for OS X El Capitan
- How to Control the 2D or 3D Appearance of the Mac's Dock
- How to Make a Bootable Flash Installer of OS X or macOS
- Add Custom and Standard Dock Spacers to Your Mac
- How to Run Widgets on Your Mac Desktop
- Troubleshooting Slow Page Loads in Safari
- Add More Features by Turning on Safari's Develop Menu
- Use Terminal to Create and Manage a RAID 0 (Striped) Array in OS X
- How to Show Hidden Files and Folders on Mac
- Restore Autoplay to QuickTime X
- Create a Bootable macOS Sierra Installer on a USB Flash Drive
- AirDrop With or Without a Wi-Fi Connection
- How to Delete Apps on a Mac That Won't Delete
- View Hidden Files and Folders on Your Mac With Terminal
How-To Geek
How to turn on the develop menu in safari on mac.
The Develop menu lets you view page source in Safari on Mac.
Quick Links
How to enable the develop menu in safari on mac, how to view page source in safari on mac.
When you right-click on any web page in Safari on Mac, it doesn't reveal the Show Page Source and Inspect Element buttons. To see these, you need to enable the Develop menu---we'll show you how to do that.
Once you've enabled the Develop menu, right-clicking a blank space on any website will reveal the Inspect Element and Show Page Source buttons. These allow you to take a look at the source code of any website, which is useful for things like downloading images from websites and debugging code or finding out what it looks like behind any site (for website designers).
You can easily turn on the Develop menu in Safari by following a couple of steps. Open Safari on your Mac and click the "Safari" button in the menu bar.
Next, select "Preferences." Alternatively, you can use the keyboard shortcut Command+, (comma). This will also open up Safari preferences.
Go to the "Advanced" tab.
Check the box for "Show Develop Menu in Menu Bar."
Now the Develop menu will appear between Bookmarks and Window at the top.
Apart from being able to view the page source, this will allow you to access developer-focused features, such as disabling JavaScript on any website.
Once you've enabled the Develop menu, there are a couple of ways to view the page source in Safari.
Open any website in Safari and right-click the blank space on the page. Now, select "Show Page Source." You can also get to this menu by using the keyboard shortcut Option+Command+u.
If you're looking for images or other media elements from any web page, Safari makes it easy to find these. In the left-hand pane, you will see various folders such as Images, Fonts, etc. Click the "Images" folder to quickly find the photos that you need.
After selecting an image, you can view its details easily by opening up the details sidebar. The button to open this is located at the top-right of the console, just below the gear icon. You can also open this with the shortcut Option+Command+0.
Click "Resource" at the top of the details sidebar to view details, such as the size of the image and its full URL.
You can change the position of the page source console easily, too. There are two buttons at the top-left of this console, right next to the X button. Click the rectangle icon to move the console to a different side within the browser window.
If you'd like to open the page source console in a separate window, you can click the two-rectangles icon. This will detach the console and open it in a separate window.
To check out the code for any specific element on the page, you can right-click that element and select "Inspect Element." This will take you directly to the code for the element that you selected.
Whenever you're done looking at the code, click the X button to close the page source console and return to browsing on Safari. You can also check out how to view a website's page source in Google Chrome here.
Related: How to View the HTML Source in Google Chrome

by Jason Snell & Dan Moren
This Week's Sponsor
Magic Lasso Adblock : YouTube ad blocker for Safari
By Dan Moren
September 21, 2020 8:48 AM PT
Enabling the Debug menu in Safari 14 on Big Sur and Catalina
Note : This story has not been updated since 2020.
Update 9/22: After further testing, it seems the standard defaults write command does continue to work in macOS Catalina with Safari 14, though the Big Sur beta may require the method mentioned below.
Update 2 9/22: Oh, what a tangled web we weave… It turns out it’s a little more complicated than the post below makes it sound. Developer Jeff Johnson has written a great blog post explaining exactly what’s going on here: it involves a combination of macOS sandboxing and System Integrity Protection. In certain cases you can use defaults write in Big Sur—if you’ve granted Terminal access to your disk in the Security & Privacy pane in System Preferences.
With new Apple software updates come new questions, and reader Martin has one related to an old tip of mine:
Thanks for the great tip on fixing tab behavior . However, the directions on how to get the debug menu no longer seem to work with Safari 14. Any idea on how to enable nowadays?
Great question! The tip in question deals with making new Safari tabs open at the end of the window rather than next to the active tab, a behavior that many users prefer. Thus far you’ve been able to change that setting in Safari’s hidden Debug menu, but Martin’s right that Safari 14 adds some additional complications.
It seems that the trusty defaults write command does no longer allows users to enable Safari’s Debug menu. So I enlisted my pal, dicemaster, and developer extraordinaire James Thomson to help me figure out this puzzle.
First, just to note: it seems that, having already had the Debug menu enabled on my iMac running Catalina, it’s persisted with the update to Safari 14. But if you want to newly enable it in Safari 14 on Catalina (or on the Big Sur beta), you’ll need to use the following process.
So, with the Safari 14 update, the preferences file that you need to edit to enable the Debug menu no longer resides in the Preferences directory of your library 1 , and the defaults command thus can’t edit it. However, it’s still possible to make the Debug menu show up—it’s just a little more complicated.
You’ll want to navigate to ~/Library/Containers/com.apple.Safari/Data/Library/Preferences/ —note that if you’re trying this on the Big Sur beta and you’re using the Finder and not Terminal, the path is ~/Library/Containers/Safari/Data/Library/Preferences/ . 2
No matter how you get to that folder, open the com.apple.Safari.plist file in it using your favorite text editor—I’d, naturally, recommend BBEdit, but TextEdit should work too.
Scroll down or search the file to find the phrase IncludeDevelopMenu —this isn’t the key that you want to edit, but it’s handy to keep things organized. Above that entry (which should start with <key> ), paste the following two lines:
<key>IncludeInternalDebugMenu</key> <true/>
Save the file, reboot Safari, and voilà, the Debug menu should appear, allowing you to once again set your tab behavior to that which is undeniably correct. Happy tabbing!
- That clearly made too much sense. ↩
- It’s the same directory, but in Big Sur it displays differently in the command-line and the GUI for…reasons?) ↩
[ Dan Moren is the East Coast Bureau Chief of Six Colors. You can find him on Mastodon at @[email protected] or reach him by email at [email protected]. His latest novel, the supernatural detective story All Souls Lost, is out now . ]
If you appreciate articles like this one, support us by becoming a Six Colors subscriber . Subscribers get access to an exclusive podcast, members-only stories, and a special community.
Search Six Colors
- Accessories
- Meet the team
- Advertise with us
- Privacy Policy
Safari browser on Mac OS X has a hidden debug menu. It is more for developers who wish to carry advanced level operations on Safari browser. The menu consists of features like sampling, JavaScript error logging, stress and load test, and much more. Don’t worry if you didn’t understand these terms, they are designed for developers and advanced users.
Having debug menu is not as simple as clearing cache , it’s slightly tedious to get. As said earlier, the menu is more focused on developers but there are few features that can be used by a normal user. So it’s good to know how to enable the debug menu. We have covered a step-by-step process, have a look.
How to Enable Safari Debug Menu in Mac OS X
Step #1. In almost every guide, we ask you to launch some or the other app in the first step. But here the things are different; if you have Safari opened then you’ll have to quit it first.
Step #2. Now launch the Terminal from Spotlight.

Step #3. Type in the following command exactly as it is given, better copy and paste it.
defaults write com.apple.Safari IncludeInternalDebugMenu 1
Step #4. Now hit Enter to execute the command.

Step #5. You can now launch Safari and you’ll see a new menu “ Debug ” listed.
Step #6. This is an optional step, in case you wish to disable Debug menu. Simply, copy paste the following command again in the Terminal.
defaults write com.apple.Safari IncludeInternalDebugMenu 0
Congrats! You have now got the idea of enabling and disabling Debug menu. Even though there aren’t any risk involved, we would still suggest to not to mess with the Debug features. The ultimate disaster could be weird web pages on your Safari browser, nothing worse can be expected than that.

Jignesh Padhiyar is the co-founder of iGeeksBlog.com, who has a keen eye for news, rumors, and all the unusual stuff around Apple products. During his tight schedule, Jignesh finds some moments of respite to share side-splitting content on social media.
View all posts
🗣️ Our site is supported by our readers like you. When you purchase through our links, we earn a small commission. Read Disclaimer .
- Enable Debug Menu
LEAVE A REPLY Cancel reply
Save my name, email, and website in this browser for the next time I comment.
Related Articles
How to stop “verification required” when installing free apps, how to make a voice memo a ringtone on iphone (2024 guide), best web browsers for mac in 2024, how to install homebrew on mac m1, m2, m3 (2024 updated).
The Tech Edvocate
- Advertisement
- Home Page Five (No Sidebar)
- Home Page Four
- Home Page Three
- Home Page Two
- Icons [No Sidebar]
- Left Sidbear Page
- Lynch Educational Consulting
- My Speaking Page
- Newsletter Sign Up Confirmation
- Newsletter Unsubscription
- Page Example
- Privacy Policy
- Protected Content
- Request a Product Review
- Shortcodes Examples
- Terms and Conditions
- The Edvocate
- The Tech Edvocate Product Guide
- Write For Us
- Dr. Lynch’s Personal Website
- The Edvocate Podcast
- Assistive Technology
- Child Development Tech
- Early Childhood & K-12 EdTech
- EdTech Futures
- EdTech News
- EdTech Policy & Reform
- EdTech Startups & Businesses
- Higher Education EdTech
- Online Learning & eLearning
- Parent & Family Tech
- Personalized Learning
- Product Reviews
- Tech Edvocate Awards
- School Ratings
Product Review of the Tribit XSound Plus 2
Teaching reading to struggling students: everything you need to know, rhyming capacity: everything you need to know, phonological awareness: everything you need to know, product review of kate spade’s bloom: the perfect mother’s day gift, learning to read: everything you need to know, product review of the arzopa z1c portable monitor, how to teach phonics: everything you need to know, reading groups: everything you need to know, product review of the ultenic p30 grooming kit, how to enable safari’s debug menu to gain added capabilities.
Safari is one of the most popular web browsers in the world, and it comes with a lot of features that many users may not be aware of. One of these features is the debug menu, which gives users access to additional capabilities that are not available in the standard version of Safari.
Enabling Safari’s debug menu is a relatively simple process, and it can be done in just a few steps. Here’s how to do it:
Step 1: Open Safari
Launch Safari on your Mac by clicking on the Safari icon in the Dock or by searching for it using Spotlight.
Step 2: Access Terminal
Open Terminal on your Mac by going to the Applications folder, then to the Utilities folder, and finally clicking on Terminal.
Step 3: Enter the Command
In the Terminal window, type the following command:
defaults write com.apple.Safari IncludeInternalDebugMenu 1
Then press Enter.
Step 4: Relaunch Safari
Quit Safari and then relaunch it. You should now see the debug menu in the menu bar.
Step 5: Explore the Debug Menu
Click on the debug menu to explore the additional capabilities that it provides. Some of the features that you can access from the debug menu include:
1. Inspecting elements on a web page
2. Disabling cache
3. Debugging JavaScript
4. Modifying user agent strings
5. Enabling experimental features
It’s important to note that some of the features in the debug menu are intended for developers and may not be useful for the average user. However, there are still plenty of features that can be useful for anyone who wants to get more out of Safari.
In conclusion, enabling Safari’s debug menu is a simple process that can give users access to additional capabilities that are not available in the standard version of Safari. By following the steps outlined above, you can start exploring the debug menu and taking advantage of its features.
How Forgiveness Separates The Good Education Leaders ...
Best classic arcade games of 1980.

Matthew Lynch
Related articles more from author.

What is IT Security Management (ITSM)?
5 Ways to Check Your Wi-Fi Connection Strength on Windows
How to Use CapCut on Windows and macOS Without an Emulator

What’s the Difference Between a Mac and a PC?
How to Set Up Philips Hue Without a Hue Bridge
How Do I Find Compatible RAM for a Motherboard?
Tips & Tricks
Troubleshooting, enable safari hidden debug menu in mac os x.

Safari has a hidden “Debug” menu that offers some additional features for debugging the browser, including stress and load tests, sampling, javascript error logging, the ability to intentionally crash a page, and more. Intended for Safari developers, the Debug menu is different from the Developer menu , which is geared more at web developers, although there are a few options in the Debug menu that general web developers would find useful as well, notably advanced cache choices and CSS animation controls. If this sounds confusing, just enable both of them and poke around and you’ll quickly see the differences.
Here’s how to enable the hidden Debug menu in Safari for Mac OS X with the assistance of a defaults command string in the terminal.
How to Enable Safari’s Hidden Debug Menu on Mac
This works in all versions of Safari in nearly all versions of macOS / OS X, from all modern releases to most prior versions as well:
- Quit Safari on Mac
- Launch the Terminal from /Applications/Utilities/ and enter the following defaults write command exactly:
defaults write com.apple.Safari IncludeInternalDebugMenu 1
- Hit return, then relaunch Safari
The “Debug” menu will be visible to the far right in Safari’s menubar choices.

If you want to disable the menu, go back to the Terminal and type:
defaults write com.apple.Safari IncludeInternalDebugMenu 0
Again you will need to relaunch Safari for changes to take effect.
We’ve poked around in the Debug menu before to stop auto-refreshing in Safari by disabling multi-process windows, that is no longer necessary with the latest version of Safari, however.

Generally aimed at developers, Safari debugging, and web workers, the Debug menu has many features that can be useful to more advanced Safari users as well. If you’re a tinkerer and like to mess around with settings, you’ll find plenty to keep you busy and explore.
Enjoy this tip? Subscribe to our newsletter!
Get more of our great Apple tips, tricks, and important news delivered to your inbox with the OSXDaily newsletter.
You have successfully joined our subscriber list.
Related articles:
- Enable the Safari Debug Console on iPhone & iPad
- Enable Mac App Store Hidden Debug Menu
- How to Enable a Hidden Debug Menu in Photo Booth for Mac OS X
- How to Stop Autoplay Video in Safari for Mac
» Comments RSS Feed
[…] can enable similar debug menus in a variety of default apps, including Safari (by far the most useful), Reminders, Calendar, Contacts, Apple Remote Desktop, the Mac App Store, […]
I just tried this four times and it didn’t work. I have never used Terminal before. After I type in the command, do I close Terminal? I tried closing it, and keeping it open, and neither time did the Debug menu appear. I have Safari 5. Thanks.
so what do I need to disable so that safari won’t refresh every time I go back on my browsing history. This is so damn annoying and a waste of time. Where is your efficiency and productivity apple???
[…] and resolve issues with webpages while on the go. While not as in inclusive as the desktop Safari debug and developer tools, it’s still useful and is easy to enable or disable on the iPhone and […]
This is so crappy annoying. Good there is a way to change it.
[…] the iCal menu is probably not quite as useful as the Safari debug menu but it’s still interesting to take a peak at. Great little trick from MacGasm, who used it to […]
Sorry to disagree with you, a true expert on OS X. I have the latest version of Lion and the latest version of Safari, and if I do not use your trick of disabling the multi-process windows, my Mac is slower than a snail on crutches. Am I the only one?
[…] Via | OSXDaily […]
Leave a Reply
Name (required)
Mail (will not be published) (required)
Subscribe to OSXDaily
- - How to Connect AirPods to a Smart TV
- - How to Customize the Finder Sidebar on Mac
- - How to Uninstall Apps on MacOS Sonoma & Ventura via System Settings
- - How to Mute a Call on Apple Watch
- - How to Use the Latest GPT 4 & DALL-E 3 Free on iPhone & iPad with Copilot
- - Beta 3 of iOS 17.5, macOS Sonoma 14.5, iPadOS 17.5, Available for Testing
- - Apple Event Set for May 7, New iPads Expected
- - Beta 2 of iOS 17.5, iPadOS 17.5, macOS Sonoma 14.5, Available for Testing
- - Opinion: Shiny Keys on MacBook Air & Pro Are Ugly and Shouldn’t Happen
- - MacOS Ventura 13.6.6 & Safari 17.4.1 Update Available
iPhone / iPad
- - How to Bulk Image Edit on iPhone & iPad wth Copy & Paste Edits to Photos
- - What Does the Bell with Line Through It Mean in Messages? Bell Icon on iPhone, iPad, & Mac Explained
- - iOS 16.7.7 & iPadOS 16.7.7 Released for Older iPhone & iPad Models
- - Fix a Repeating “Trust This Computer” Alert on iPhone & iPad
- - Make a Website Your Mac Wallpaper with Plash
- - 15 Mail Keyboard Shortcuts for Mac
- - How to Use Hover Text on Mac to Magnify On-Screen Text
- - Fix “warning: unable to access /Users/Name/.config/git/attributes Permission Denied” Errors
- - How to Fix the Apple Watch Squiggly Charging Cable Screen
- - NewsToday2: What it is & How to Disable NewsToday2 on Mac

About OSXDaily | Contact Us | Privacy Policy | Sitemap
This website is unrelated to Apple Inc
All trademarks and copyrights on this website are property of their respective owners.
© 2024 OS X Daily. All Rights Reserved. Reproduction without explicit permission is prohibited.
- a. Send us an email
- b. Anonymous form
- Buyer's Guide
- Upcoming Products
- Tips / Contact Us
- Podcast Instagram Facebook Twitter Mastodon YouTube Notifications RSS Newsletter
Apple Releases Safari Technology Preview 193 With Bug Fixes and Performance Improvements
Apple today released a new update for Safari Technology Preview , the experimental browser Apple first introduced in March 2016. Apple designed the Safari Technology Preview to test features that may be introduced into future release versions of Safari.

The current Safari Technology Preview release is compatible with machines running macOS Ventura and macOS Sonoma , the latest version of macOS that Apple released in September 2023.
The Safari Technology Preview update is available through the Software Update mechanism in System Preferences or System Settings to anyone who has downloaded the browser . Full release notes for the update are available on the Safari Technology Preview website .
Apple's aim with Safari Technology Preview is to gather feedback from developers and users on its browser development process. Safari Technology Preview can run side-by-side with the existing Safari browser and while designed for developers, it does not require a developer account to download.
Get weekly top MacRumors stories in your inbox.
Top Rated Comments
I'm always curious about these Safari Tech Preview posts. Are they just a quick way to add another headline? I suspect so, as I don't see many people trusting these builds as their daily driver. I've tried that in the past, but it never stuck.
Popular Stories

Apple Releases Open Source AI Models That Run On-Device

iOS 18 Rumored to Add These 10 New Features to Your iPhone

Apple Announces 'Let Loose' Event on May 7 Amid Rumors of New iPads

Apple Cuts Vision Pro Shipments as Demand Falls 'Sharply Beyond Expectations'

Apple Finally Plans to Release a Calculator App for iPad Later This Year

Best Buy Introduces Record Low Prices on Apple's M3 MacBook Pro for Members
Next article.

Our comprehensive guide highlighting every major new addition in iOS 17, plus how-tos that walk you through using the new features.

App Store changes for the EU, new emoji, Podcasts transcripts, and more.

Get the most out your iPhone 15 with our complete guide to all the new features.
A deep dive into new features in macOS Sonoma, big and small.

Revamped models with OLED displays, M3 chip, and redesigned Magic Keyboard accessory.

Updated 10.9-inch model and new 12.9-inch model, M2 chip expected.

Apple's annual Worldwide Developers Conference will kick off with a keynote on June 10.

Expected to see new AI-focused features and more. Preview coming at WWDC in June with public release in September.
Other Stories

10 hours ago by Tim Hardwick

1 day ago by Joe Rossignol

1 day ago by MacRumors Staff

2 days ago by Joe Rossignol

3 days ago by Tim Hardwick
Navigation Menu
Search code, repositories, users, issues, pull requests..., provide feedback.
We read every piece of feedback, and take your input very seriously.
Saved searches
Use saved searches to filter your results more quickly.
To see all available qualifiers, see our documentation .
- Notifications
The Go extension allows you to launch or attach to Go programs for debugging. You can inspect variables and stacks, set breakpoints, and do other debugging activities using VS Code’s Debugging UI .
These debugging features are possible by using Delve , the Go debugger.
Previously, the Go extension communicated with Delve through a custom debug adaptor program ( legacy mode). Since Delve 's native debug adapter implementation is available, the Go extension is transitioning to deprecate the legacy debug adapter in favor of direct communication with Delve via DAP .
📣 We are happy to announce that the new dlv-dap mode of Delve integration is enabled for local debugging by default. For remote debugging it is the default in Go Nightly and is available with stable builds on demand with "debugAdapter": "dlv-dap" attribute in launch.json or settings.json !
Many features and settings described in this document may be available only with the new dlv-dap mode. For troubleshooting and configuring the legacy debug adapter, see the legacy debug adapter documentation .
Get started
Open a file to debug (either package main source file or the test file) in the editor, and select the Run and Debug button from the Run view . Alternatively, you can start debugging using Start Debugging (F5) command from the Run menu or from the Command Palette (Linux/Windows: Ctrl+Shift+P, Mac: ⇧+⌘+P).
If you already have launch configurations for the project ( .vscode/launch.json ), the Run view will display the configuration list to choose from.
When no configuration is configured yet (no .vscode/launch.json file), the extension will choose a default configuration based on the file open in the editor.
❗ When you start debugging for the first time or if the dlv executable on your system is too old to support DAP, the Go extension may ask to install or update Delve. Follow the instructions to install it, and then start the debugging session again.
To learn more about debugging in Go, watch Go: Writing and debugging fast, reliable, and efficient software .
Review the Features section for an overview of the Go Extension's debug UI and available features.
Stay up to date
Delve’s native DAP implementation is under active development. Take advantage of the most recent features and bug fixes by installing the latest version of dlv using the Go:Install/Update Tools command from the Command Palette (Linux/Windows: Ctrl + Shift + P , Mac: Command + Shift + P ). The command will show dlv in the tool list.
Once dlv is installed on your system, the extension will prompt you for update whenever installing a newer version is necessary. You can set the go.toolsManagement.autoUpdate setting so the extension can update dlv automatically for you.
If you need to install dlv manually outside of VS Code, follow the instruction in Manually installing dlv . An example of a situation where manual installation might be needed is if you are building a dev container with the necessary tools preinstalled, or installing dlv built from the tree head.
Switch to legacy debug adapter
Note: The extension still uses the legacy debug adapter for remote debugging.
If you need to use the legacy debug adapter for local debugging ( legacy mode) by default, add the following in your VSCode settings.
When mode is set to remote you must explicitly set debugAdapter to dlv-dap to override the legacy adapter default.
If you want to switch to legacy for only a subset of your launch configurations, you can use the debugAdapter attribute to switch between "dlv-dap" and "legacy" mode.
If you chose to switch to legacy because of bugs or limitations in the new debug adapter, open an issue to help us improve.
For general debugging features such as inspecting variables, setting breakpoints, and other activities that aren't language-dependent, review VS Code debugging .
When you need more than the default debugging setup, you can create a launch configuration file for the project.
To create a configuration file:
- In the the Run view , click "create a launch.json file"
- Choose Go: Launch Package from the debug configuration drop-down menu. VS Code will create a launch.json file in a .vscode folder in your workspace (project root folder) or in your user settings or workspace settings .
If you already have a launch.json for your project, you can open it using the Command Palette Open launch.json command.
To add a new configuration to an existing launch.json file:
- Open your launch.json file using the Command Palette Open launch.json command.
- Click the Add Configuration button to invoke the snippet IntelliSense.
There are many configuration attributes (see the Launch.json attributes section). IntelliSense in VS Code’s launch.json editor will help you navigate available options and documentation.
To launch and debug your project, select Run > Start Debugging (F5) .
The launch feature uses a launch request type configuration in your launch.json file. Its program attribute needs to be the absolute path to either the Go file, or folder containing the main package or test file. In this mode, the Go extension will start the debug session by building and launching the program. The launched program will be terminated when the debug session ends.
- debug : build and debug a main package
- test : build and debug a test
- The binary must be built with go build -gcflags=all="-N -l" to disable inlining and optimizations that can interfere with debugging.
- auto : automatically choose between debug and test depending on the open file
⚠️ For "Remote Debugging" , add the port attribute to the launch configuration. VS Code will connect to the external user-specified dlv dap server at host:port and launch the target there.
For remote debugging, the program attribute must point to the absolute path to the package or binary to debug in the remote host’s file system even when substitutePath is specified.
You can use this configuration to attach to a running process or a running debug session.
- remote : attaches to an in-progress debug session run by an external server.
You can debug an already running program using the local mode type configuration. The Go extension will start dlv dap and configure it to attach to the specified process. Users can select the process to debug with one of the following options:
- Specifying the numeric process id (PID) with the processId attribute.
- Specifying the target program name in the processId attribute. If there are multiple processes matching the specified program name, the extension will show the list of matching processes at the start of the debug session.
- Specifying 0 in the processId attribute and selecting the process from the drop-down menu at the start of the debug session.
NOTE: For remote debugging, add the port attribute to the launch configuration. VS Code will connect to the external user-specified dlv dap server at host:port and attach to the target there.See "remote debugging" for more details).
You can connect to an already running remote debug session using the remote mode. Specify optional host and required port for the external dlv --headless server that already took program or process id details as command-line arguments. See "Remote Debugging" for more details).
When you end an attach debug session, the debug UI allows you to choose to:
- local : leave the target process running (dlv terminates).
- dlv debug/test/exec : terminate the target process if dlv terminates.
- dlv attach : leave the target process running even if dlv terminates.
- Stop: stop the attached server and the target process.
Debug actions
Once a debug session starts, the Debug toolbar will appear on the top of the editor.

The available commands are:
- Continue / Pause F5
- Step Over (aka next in Delve) F10
- Step Into (aka step in Delve) F11
- Step Out (aka stepout in Delve) Shift+F11 or ⇧F11
- Restart (currently this is "Stop + Start") Ctrl+Shift+F5 or ⇧⌘F5
- Stop (terminate the debugee. Available in Launch request) Shift+F5 or ⇧F5
- Disconnect (detach from the debugee. Available only in Attach request) Shift+F5 or ⇧F5
- Terminate (terminate the debugee. Available only in Attach request) Alt+Shift+F5 or ⌥⇧F5
Breakpoints
See VS Code’s Debug Documentation on Breakpoints to get familiar with VS Code’s UI. The Go debugger supports multiple ways to configure breakpoints.
- Breakpoints : you can set breakpoints by clicking on the editor margin or using F9 on the current line. If the breakpoints can’t be set by Delve, VS Code will show the failure reason and grey out the dot.

- Expression condition: takes a boolean expression.
- Hit count: supports comparison operators ( > , >= , < , <= , == , != ) with an integer value. % n form means we should stop at the breakpoint when the hitcount is a multiple of n .
- Function Breakpoints : breakpoints can be set based on function names. Press the + button in the BREAKPOINTS section header and enter the location in the form of <function>[:<line>] . This sets the breakpoint in the line inside the function . The full syntax for function is <package>.(*<receiver type>).<function_name> as specified in Delve’s location spec . Function breakpoints are shown with a red triangle in the BREAKPOINTS section.
- Logpoints : a logpoint is a variant of breakpoint that does not 'break', but instead logs a message to DEBUG CONSOLE and continues execution. Expressions within {} are interpolated. For the list of acceptable expressions and syntax, see Delve's documentation .
Data inspection
You can inspect variables in the VARIABLES section of the Run view or by hovering over their source in the editor. Variable values and expression evaluation are relative to the selected stack frame in the CALL section.
By default, the VARIABLES section hides global variables, and shows only local variables and function arguments. However, you can still inspect global variables from the DEBUG CONSOLE panel. If you prefer to have the VARIABLES section show global variables, set the showGlobalVariables attribute in the launch.json configuration, or set it in the go.delveConfig setting.
When you select a variable and right click from the VARIABLES section, the context menu will present shortcuts to features such as:
- Set Value : you can set/modify simple string, numeric, pointer values. Using composite literals, or memory allocation is not supported.
- Copy Value : this copies the value in clipboard.
- Copy as Expression : this is useful when you need to query from the REPL in the DEBUG CONSOLE panel.
- Add to Watch : this will automatically add the expression to the WATCH section.
Shadowed variables will be marked with () .

⚠️ Delve debugger imposes variable loading limits to prevent loading too many variables at once and negatively impacting debugging latency. The dlv-dap mode uses a different approach. It takes advantage of the interactive UI features to provide on-demand loading of individual variables, paging of arrays, slices and maps and increased string limits depending on the context. We continue to explore additional interactive features to balance performance and usability of variable loading and look forward to your feedback.
You can inspect variables and evaluate expressions from the DEBUG CONSOLE panel too. Acceptable expressions are either
- A valid Delve expression , or
- call <function_call_expression> to call functions.

Variables and expressions accepted in DEBUG CONSOLE can be also registered in the Run view’s WATCH section, so they can be evaluated automatically as you debug. The "Add to Watch" feature from the VARIABLES section is convenient when you want to register interesting variables.
⚠️ Function call feature is highly EXPERIMENTAL due to the limitation in Go runtime. Registering function calls in the WATCH section can often be problematic. Pause, stop, and disconnect will not work while a function call is running.
Hover over variables in editors during debugging shows the value of the variable. For this feature, VS Code extracts the variable expression and makes a request to the debugger to evaluate the expression. Delve evaluates the expression relative to the highlighted stack frame chosen in the CALL STACK. By default, that is the current top-most frame.

⚠️ Limitation
- VS Code heuristically determines the variable expression without full understanding of the scope & the currently selected frame. Delve tries to evaluate the provided expression in the selected frame. As a result, hover over variables outside the selected frame’s function may present incorrect information.
You can inspect all goroutines and their stacks in the CALL STACK section. The CALL STACK section UI allows switching between goroutines or selecting a different stack frame. As a different stack frame or different goroutine is selected, the scope shown in the VARIABLE section will be updated for the newly selected stack frame, and the expressions in the WATCH section will be automatically reevaluated relative to the newly selected stack frame.
- Goroutine stacks are annotated with their internal goroutine IDs.
- The current goroutine is marked with * . If multiple goroutines stop (e.g. hit breakpoints) concurrently, Delve will pick one randomly. There also might not be a current goroutine (e.g. deadlock, pause or internal breakpoint hit by a system thread not running a goroutine).
- If you click a goroutine call stack from the CALL STACK section, the goroutine is selected .
- You can select a frame of the selected goroutine. The VARIABLE and WATCH sections will be updated accordingly and the cursor in the editor will be moved to the corresponding location in the source code.
- Runtime stack frames are deemphasized (greyed out or collapsed).
- Thread IDs are shown for scheduled goroutines.
- Stop reason. It’s possible that there are multiple reasons goroutines were stopped, but currently only one reason is presented.
- File name and line number of the frame.
- You can trigger a debug action with the selected goroutine. Note: Resuming or stopping only a single goroutine (Go Issue 25578 , 31132 ) is currently not supported, so the action will cause all the goroutines to get activated or paused.
- Function name of the frame.
When the program stops due to exception, panic, or bad access error, the CALL STACK shows the stop reason and the editor highlights the source location with more details.

dlv command from DEBUG CONSOLE
DEBUG CONSOLE accepts commands that allow users to dynamically inspect/change debug configuration, or inspect the list of source code compiled in the debugged binary. Use dlv help and dlv config -list from the DEBUG CONSOLE panel to see the list of supported commands and dynamically adjustable settings.
Configuration
Launch.json attributes.
There are many attributes that you can adjust in the launch and attach debug configuration. The following general attributes are mandatory for all launch configurations.
- name : the name of your configuration as it appears in the drop-down in the Run view.
- type : the debugging type VS Code uses to decide which debugging extension should be used. Always leave this set to "go" .
- request : launch or attach .
Here is the list of attributes specific to Go debugging.
⚠️ Delve resolves relative paths from dlv dap process's working directory, but from which directory the extension spawns the dlv dap process is an implementation detail. Thus, use the VS Code variables substitution to ensure consistent expansion of paths. VS Code will resolve the variables inside strings in launch.json before passing the configuration to the Go extension and dlv dap . For example, ${workspaceFolder} will be replaced with the absolute path to the workspace root folder. When appropriate, the Go extension will resolve relative paths or home directory (~) before sending the configuration to dlv dap .
Debug symlink directories
Since the debugger and go compiler use the actual filenames, extra configuration is required to debug symlinked directories. Use the substitutePath property to tell the debugAdapter how to properly translate the paths. For example, if your project lives in /path/to/actual/helloWorld , but the project is open in vscode under the linked folder /link/to/helloWorld , you can add the following to your config to set breakpoints in the files in /link/to/helloWorld :
You can adjust the default value of the following configuration properties using go.delveConfig settings. These default values are useful when you choose to run a debug session without the launch configuration set in launch.json . For example, debug sessions started using the Debug Test code lenses use the adjusted values from these settings.
- debugAdapter : Controls which debug adapter to use (default: legacy ). Select ‘dlv-dap’.
- showGlobalVariables : Show global variables in the Debug view (default: false ).
- substitutePath : Path mappings to apply to get from a path in the editor to a path in the compiled program (default: [] ).
⚠️ Where is the dlvLoadConfig setting? Delve debugger imposes variable loading limits to avoid loading too many variables at once and negatively impacting debugging latency. The legacy adapter supported dlvLoadConfig to adjust these limits for the duration of the session. The user therefore had to come up with a one-size-fits-all limit if the default behavior was not satisfactory. dlv-dap mode uses a different approach as described in the Data Inspection section . If this setting is configured and dlv-dap mode is used, the extension will show a warning prompt now. If the current variable loading behavior and internal limits are not working for you, please open an issue and share your feedback.

Advanced topics
Go debug extension architecture overview.
VS Code implements a generic, language-agnostic debugger UI based on Debug Adapter Protocol (DAP), an abstract protocol for communicating with debugger backend. Previously, the Go extension used an intermediary typescript program (legacy debug adapter) to launch Delve and adapt Delve to DAP. With the new, native DAP implementation in Delve , the intermediary program is no longer necessary, and efficient and tight integration with Delve becomes possible.

For information on debugging using the legacy debug adapter, please see the old Debugging Documentation . Note that many new or enhanced features discussed in this document may not be available with the legacy debug adapter.
Handling STDIN
The Go extension and dlv started as a subprocess of the extension do not have access to tty . The Go extension captures and forwards STDOUT/STDERR of the debug program to VS Code, so they can appear in DEBUG OUTPUT panel. But this arrangement does not handle STDIN.
When the target program needs to read from STDIN or access terminals ( tty ), use the "console" launch option that controls where the dlv debugger and the target process run:
- integratedTerminal for the terminal inside VS Code
- externalTerminal for the terminal outside VS Code
The Go extension delegates interaction with terminals to VS Code using Debug Adapter Protocol's RunInTerminal functionality . For configuring VS Code's terminal related behavior, see VS Code's documentation .
Debug programs and tests as root
In order to run and debug a program or a package test running as root, the debugger ( dlv ) must run with root privilege, too. You can start the debug session with root privilege utilizing the "asRoot" AND "console" launch options. This is currently supported only on Linux and Mac.
When asRoot is true, the Go extension will use the sudo command to run dlv . Since sudo may ask you to enter password, the debug session needs terminal access so set "console": "integratedTerminal" or "console": "externalTerminal" in the launch configuration.
Debug a program as root
For example, the following launch configuration will start myprogram and debug it by running sudo dlv dap command in the integrated terminal.
The asRoot setting can be used with auto / test / debug launch modes that build the target binary to debug. That means the go command will be invoked as root to compile the binary, too. This can cause issues:
- by default, sudo does not preserve the user's current environment variables (see documentations about sudo's --preserve-env option). For example, PATH or library paths required for build may be different.
- Go environment variable settings usually associated in the home directory are different.
- Module/build caches used during build as root may be different from the caches used in your normal build. If they are the same, you may encounter permission errors due to cache data written to the caches as root.
Instead, you can arrange the exec launch mode to work with a pre-launch task .
First, configure a debug build task to compile the target binary.
In .vscode/tasks.json :
The -gcflags=all=-N -l flag tells the go build command to preserve the debug information. The -o flag causes the compiled binary to be placed in "${fileDirname}/__debug_bin" . Extra build flags and environment variables used for build should be configured here as args or options 's env settings.
It might be useful to add __debug_bin to your .gitignore to avoid debugging binaries getting checked-in into your repository.
Then, configure the launch config to run the task before starting debugging.
In .vscode/launch.json :
Settings ( args , cwd , env , ...) configured in the above launch.json will only apply when running the compiled binary, not when building the binary.
Debug a package test as root
To debug package tests as root add the following launch and task configurations.
Manually install dlv
On rare occasions, you may want to install dlv by yourself instead of letting the extension handle its installation.
First, find where the Go extension finds tools. Like other tools the extension uses , the Go extension searches the dlv executable from ${GOPATH}/bin , ${GOBIN} and ${PATH} (or Path in Windows). So, install dlv in the directory. The easiest way to check the tool installation location the Go extension uses is currently by running the Go: Locate Configured Go Tools command from the command palette (⇧+⌘+P or Ctrl+Shift+P).
If your Go version is 1.16 or newer:
If your Go version is older than 1.16:
You can choose to install a different version of dlv by specifying a specific commit hash, a branch name (e.g. master ), or a released version instead of latest . For more details about manual installation, see Delve's documentation .
If you want to explicitly specify the location of the delve binary, use the go.alternateTools setting:
Remote debugging
If you are able to use the Remote Development extensions and VS Code’s universal remote development capabilities , that is the recommended way to debug Go programs remotely. Check out Getting started section and Remote tutorials to learn more.
Remote debugging is the debug mode commonly used to work with a debugger and target running on a remote machine or a container. In spite of its name, it can also be used on a local machine with server started in an external terminal (e.g. to support entering stdin into the server's terminal window).
With the introduction of dlv dap users now have two options for remote (i.e. external) debugging.
Connect to headless delve with target specified at server start-up
In this mode the user must first manually start a dlv --headless server listening at host:port while specifying the target program to debug/test/exec or a process to attach to on the command-line. A remote attach configuration is then used to connect to the debugger with a running target.
The headless dlv server can now be used with both "debugAdapter": "legacy" (default value) and "debugAdapter": "dlv-dap" (with Delve v1.7.3 or newer) as well as Delve's command-line interface via dlv connect . The --accept-multiclient flag makes this a multi-use server that persists on Disconnect from a client and allows repeated connections from any of the aforementioned clients. A combination of --accept-multiclient --continue flags can be used to resume process execution on start-up. Please see dlv --help and dlv [command] --help for dlv's command-line options.
We encourage you to give the newly added "debugAdapter": "dlv-dap" support a try and to let us know of any issues . If you need to use the legacy mode, pleasse also see the legacy remote debugging documentation.
For example, start external headless server:
Connect to it with a remote attach configuration in your launch.json :
Connect to delve dap with target specified at client start-up
In this mode the user must first manually start a dlv dap server listening at host:port and then specify the target program via launch or attach client config with a "port" attribute. Instead of starting a new local server, the Go extension will tell VS Code to connect to the server specified by host:port attributes and then send a request with the target to debug. This option provides the flexibility of easily adapting local configurations to connect to external servers, but ⚠️ must be used with care since anyone who can connect to the server can make it run arbitrary programs.
When using launch mode, the program attribute must point to the absolute path of the package or binary to debug in the remote host’s file system even when substitutePath is specified. When using attach mode outside of local host, you need to specify the processId in the config since the processId resolution feature cannot gather information about processes running remotely.
Start a dlv dap server ready to accept a client request to launch or attach to a target process:
Use the following launch configuration to tell dlv to execute a binary precompiled with go build -gcflags=all="-N -l" :
Or have the binary compiled by dlv dap by modifying the above configuration to use:
⚠️ Limitations
- Unlike dlv --headless above, dlv dap does not support --accept-multiclient or --continue flags, which means after a debug session ends, the dlv dap process will always exit.
- If you use debug or test mode launch requests, Delve builds the target binary. Delve tries to build the target from the directory where the dlv process is running, so make sure to run the dlv command from the directory you would run the go build or go test command.
Run debugee externally
Sometimes you might like to launch the program for debugging outside of VS Code (e.g. as a workaround of the missing console support to enter stdin via an external terminal or separate target's output from debug session logging). There are currently two options:
- Compile and run the target program from the external terminal and use the "attach" configuration .
- Run the debug server from the external terminal with --listen=:<port> and have VS Code connect to it using port in your launch configuration (see "Remote Debugging" for more details)
Troubleshooting
The suggestions below are intended to help you troubleshoot any problems you encounter. If you are unable to resolve the issue, please take a look at the current known debugging issues or report a new issue .
- Read documentation and FAQs . Also check the Delve FAQ in case the problem is mentioned there.
- Check your launch.json configuration. Often error messages appearing in the DEBUG CONSOLE panel reveal issues.
- Update Delve ( dlv ) to pick up most recent bug fixes. Follow the instruction .
- Check if you can reproduce the issue with dlv , the command line tool from the integrated terminal. If it's reproducible when using dlv , take a look at the Delve project issue tracker .
- Capture logs and inspect them.
- Look at the existing debugging issues if similar issues were reported.
- If none of these solve your problem, please open a new issue .
I need to view large strings. How can I do that if dlvLoadConfig with maxStringLen is deprecated?
The legacy adapter used dlvLoadConfig as one-time session-wide setting to override dlv's conservative default variable loading limits, intended to protect tool's performance. The new debug adapter is taking a different approach with on-demand loading of composite data and updated string limits, relaxed when interacting with individual strings. In particular, if the new default limit of 512, applied to all string values in the variables pane, is not sufficient, you can take advantage of a larger limit of 4096 with one of the following:
- Hover over the variable in the source code
- Copy as Expression to query the string via REPL in the DEBUG CONSOLE panel
- Copy Value to clipboard
Please open an issue if this is not sufficient for your use case or if you have any additional feedback.
Why does my debug session have an invalid command error when I try to step?
When stepping through a program on a particular goroutine, the debugger will make sure that the step is completed, even when interrupted by events on a different goroutine. If a breakpoint is hit on a different goroutine, the debug adapter will stop the program execution to allow you to inspect the state, even though the step request is still active.
If you attempt to make another step request you will get an invalid command error.

Use Continue to resume program execution.
If you do not want the step request to be interrupted, you can disable all breakpoints from VS Code from the context menu in the Breakpoints view.

My program does not stop at breakpoints
Check the "BREAKPOINTS" section in the debug view and see if the breakpoints are greyed out when your debug session is active. Setting stopOnEntry is a great way to pause execution at the start to verify breakpoints are set correctly. Or enable logging and see if setBreakpoints requests succeeded with all the breakpoints verified .
This problem often occurs when the source location used in compiling the debugged program and the workspace directory VS Code uses are different. Common culprits are remote debugging where the program is built in the remote location, use of symbolic links, or use of -trimpath build flags. In this case, configure the substitutePath attribute in your launch configuration.
Trimpath tips
If you are using -trimpath to build your program, you need to add entries to substitute path to let the debugger know how to map the package paths that are compiled in the binary to the files that you are looking at in the editor.
Here are some tips for configuring substitutePath. This assumes that your program is using module mode, which is the default.
One rule that you will need will map your main module. The mapping will map "from" the file path to the directory containing the module, "to" the module path.
You will also need to create a similar mapping for all dependencies. These include modules in the module cache, vendored modules, and the standard library.
Since rules are applied both from client to server and server to client, rules with an empty string will be applied to all paths that it sees, so even dependencies will be mapped to "/path/to/module" .
We plan to make this easier in the future. Progress can be tracked in the issue tracker golang/vscode-go#1985 .
Debug sessions started with the "debug test" CodeLens or the test UI does not use my launch.json configuration
The "debug test" CodeLens and the test UI do not use the launch.json configuration ( Issue 855 ). As a workaround, use the go.delveConfig setting and the go.testFlags setting. Please note that these all apply to all debug sessions unless overwritten by a specific launch.json configuration.
Starting a debug session fails with
decoding dwarf section info at offset 0x0: too short or could not open debug info error
These errors indicate that your binary was built with linker flags that stripped the symbol table ( -s ) or the DWARF debug information ( -w ), making debugging impossible. If the binary is built while launching the session, make sure your launch.json configuration does not contain "buildFlags": "--ldflags '-s -w'" . If you use debug test or Test Explorer, check go.buildFlags in settings.json . If the binary is built externally, check the command-line flags and do not use go run . Unlike go build , go run passes -s -w to the linker under the hood. If you try to attach to such a binary with a debugger, it will fail with one of the above errors (see Go Issue 24833 ). Instead let dlv build the binary for you or use go build -gcflags=all="-N -l" .
Report issues
When you are having issues in dlv-dap mode, first check if the problems are reproducible after updating dlv and using the most recent version of dlv . It's possible that the problems are already fixed. You can also try to install dlv at tree head. Follow the instruction for updating dlv and updating extension .
Please report issues in our issue tracker with the following information.
- go version -m <path/to/dlv>
- VS Code and VS Code Go version (e.g. code --version )
- Instructions to reproduce the issue (code snippets, your launch.json , screenshot)
- DAP trace (See the instruction )
Collect logs
The logOutput and showLog attributes in launch.json enable Delve-side logging (server-side) and DAP message tracing. The trace attribute controls the verbosity of Go extension's side logging (client-side).
The logging will appear in the Go Debug output channel (Command Palette -> "View: Toggle Output" -> Select "Go Debug" from the dropdown menu). By nature, debug logs may contain sensitive information. Please review the logs carefully before sharing debug logs.
Development
Code location.
The core part of Delve DAP implementation is in the service/dap package. Follow Delve project's contribution guideline to send PRs.
Code for integration with the Go extension is mostly in src/goDebugFactory.ts and tests are in test/integration/goDebug.test.ts . Please take a look at VS Code Go project's contribution guideline to learn about how to prepare a change and send it for review.
For simple launch cases, build the dlv binary, and configure "go.alternateTools" setting.

✏️ Want to contribute to this wiki?
Update the source and send a PR.
Clone this wiki locally
- Client log in
Metallurgicheskii Zavod Electrostal AO (Russia)
In 1993 "Elektrostal" was transformed into an open joint stock company. The factory occupies a leading position among the manufacturers of high quality steel. The plant is a producer of high-temperature nickel alloys in a wide variety. It has a unique set of metallurgical equipment: open induction and arc furnaces, furnace steel processing unit, vacuum induction, vacuum- arc furnaces and others. The factory has implemented and certified quality management system ISO 9000, received international certificates for all products. Elektrostal today is a major supplier in Russia starting blanks for the production of blades, discs and rolls for gas turbine engines. Among them are companies in the aerospace industry, defense plants, and energy complex, automotive, mechanical engineering and instrument-making plants.
Headquarters Ulitsa Zheleznodorozhnaya, 1 Elektrostal; Moscow Oblast; Postal Code: 144002
Contact Details: Purchase the Metallurgicheskii Zavod Electrostal AO report to view the information.
Website: http://elsteel.ru
EMIS company profiles are part of a larger information service which combines company, industry and country data and analysis for over 145 emerging markets.
To view more information, Request a demonstration of the EMIS service
COMMENTS
Safari Debug Menu in OS X El Capitan and Earlier . With the release of Safari 4 in the summer of 2008, many useful menu items in the Debug menu were moved to the new Develop menu. However, the hidden Debug menu remained and even picked up a command or two as Safari development continued.
Open Safari on your Mac and click the "Safari" button in the menu bar. Next, select "Preferences." Alternatively, you can use the keyboard shortcut Command+, (comma). This will also open up Safari preferences. Go to the "Advanced" tab. Check the box for "Show Develop Menu in Menu Bar." Now the Develop menu will appear between Bookmarks and ...
Look for and click the Finder logo. Click "Applications" on the left toolbar. Open the folder marked "Utilities". Launch "Terminal" by clicking on it twice. 4. Type in the command: At this stage, you are close to fixing the "not seeing the Debug menu in Safari for macOS Big Sur " issue. You will get even a step closer by typing ...
Enabling debug menu in Safari for Windows. Ask Question Asked 13 years, 10 months ago. Modified 7 years, 11 months ago. Viewed 34k times 15 I found plenty of info on this for Safari 3, but things have evidently changed in version 4. I just happened to stumble upon the answer by experimenting, so posting it here for others.
Web development tools. Apple has brought its expertise in development tools to the web. Safari includes Web Inspector, a powerful tool that makes it easy to modify, debug, and optimize websites for peak performance and compatibility on both platforms. And with Responsive Design Mode, you can preview your web pages in various screen sizes ...
Mac OS Big Sur & MacOS Monterey CHANGED How to Enable the Hidden Safari Debug Menu - I think Apple's TCC (Transparency Control & Consent) Security is the iss...
Scroll down or search the file to find the phrase IncludeDevelopMenu —this isn't the key that you want to edit, but it's handy to keep things organized. Above that entry (which should start with <key> ), paste the following two lines: <key>IncludeInternalDebugMenu</key>. <true/>. Save the file, reboot Safari, and voilà, the Debug menu ...
Connect the iOS device to the machine. Enable the Web-Inspector option. To do so: Go to Settings > Safari > Scroll down to the bottom > Open Advanced Menu>. Turn on Web Inspector. Open the desired web page to debug or preview on your mobile Safari browser. Once done, enable the Develop menu on the Mac device.
Type in the following command exactly as it is given, better copy and paste it. defaults write com.apple.Safari IncludeInternalDebugMenu 1. Step #4. Now hit Enter to execute the command. Step #5. You can now launch Safari and you'll see a new menu " Debug " listed. Step #6. This is an optional step, in case you wish to disable Debug menu.
Overview. The Develop menu is home to the tools available to design and develop web content in Safari, as well as web content used by other applications on your Mac and other devices. The Develop menu also provides quick access to Changing Developer settings in Safari on macOS and Changing Feature Flag settings in Safari on macOS.. Note. If you haven't already enabled features for web ...
Enable Web Inspector on iOS : Open the Settings app on your iPhone or iPad. Scroll down and tap Safari. Scroll to the bottom of the page and tap Advanced. Tap the toggle next to Web Inspector to the On position. Enable Safari Developer Mode on Mac : Open Safari on your Mac. Click Safari in the top left corner of your Menu Bar.
30. The Scripts Debugger was updated to support some popular keyboard shortcuts: Continue — F8 or Command - / on a Mac or Control - / on other platforms. Step Over — F10 or Command - ' on a Mac or Control - ' on other platforms. Step Into — F11 or Command -; on a Mac or Control -; on other platforms. Step Out — Shift - F11 or Shift ...
To debug your website using the Responsive Design mode on Safari, follow the steps mentioned below: Enable the Developer Menu. To do that, launch the Safari Browser on your Mac computer. Go to Preferences > Advanced and check the Show Develop menu in the menu bar. Navigate to the website you want to debug.
To open the Safari Developer Tools, right-click on Inspect and start debugging. You can leverage other built-in features offered by LambdaTest, like geolocation testing, uploading files, accessibility, and much more. Using Safari, you can use the Responsive Design Mode while debugging your websites on LambdaTest.
Step 4: Relaunch Safari. Quit Safari and then relaunch it. You should now see the debug menu in the menu bar. Step 5: Explore the Debug Menu. Click on the debug menu to explore the additional capabilities that it provides. Some of the features that you can access from the debug menu include: 1. Inspecting elements on a web page. 2. Disabling ...
defaults write com.apple.Safari IncludeInternalDebugMenu 1. Hit return, then relaunch Safari. The "Debug" menu will be visible to the far right in Safari's menubar choices. If you want to disable the menu, go back to the Terminal and type: defaults write com.apple.Safari IncludeInternalDebugMenu 0. Again you will need to relaunch Safari ...
STEP 3: Enable the Safari Debug menu. Open Launchpad, go to others, and launch Terminal. Then execute the below command in the Terminal. Now open Activity Monitor from the Launchpad, select Safari, and hit the cross icon. Then click on Quit in the confirmation dialog box that appears.
Apple has dropped the number of Vision Pro units that it plans to ship in 2024, going from an expected 700 to 800k units to just 400k to 450k units, according to Apple analyst Ming-Chi Kuo.
Elektrostal is a city in Moscow Oblast, Russia, located 58 kilometers east of Moscow. Elektrostal has about 158,000 residents. Mapcarta, the open map.
Open a file to debug (either package main source file or the test file) in the editor, and select the Run and Debug button from the Run view.Alternatively, you can start debugging using Start Debugging (F5) command from the Run menu or from the Command Palette (Linux/Windows: Ctrl+Shift+P, Mac: ⇧+⌘+P).. If you already have launch configurations for the project (.vscode/launch.json), the ...
Metallurgicheskii Zavod Electrostal AO (Russia) In 1993 "Elektrostal" was transformed into an open joint stock company. The factory occupies a leading position among the manufacturers of high quality steel. The plant is a producer of high-temperature nickel alloys in a wide variety. It has a unique set of metallurgical equipment: open induction ...
#Sancharam #Siberia #SafariTV #Santhosh_George_Kulangara #Lal_JoseStay Tuned : https://www.safaritvchannel.com Enjoy & Stay Connected With Us !!---...
Ukrainian military had 64 combat engagements with Russian forces near Synkivka of Kharkiv region, south to Terny and Vesele of Donetsk region, Klischiyivka and Andriyivka of Donetsk region, near Novobakhmutivka, Avdiyivka, Syeverne, Pervomayske and Nevelske of Donetsk region, Heorhiyivka, Pobyeda and Novomykhaylivka of Donetsk region, Staromayorske of Donetsk region, at the east bank of Dnipro ...