.HAR File Extension
Http archive file, what is a har file.
A HAR file is an archive saved in the HTTP Archive (HAR) format, which is a JSON -formatted format used to save collected HTTP performance data. It contains information about webpages a web browser has loaded, which includes the tracked webpages, response times, and web browser version. HAR files also store metadata , such as the HAR format version and the creator of the file.

More Information
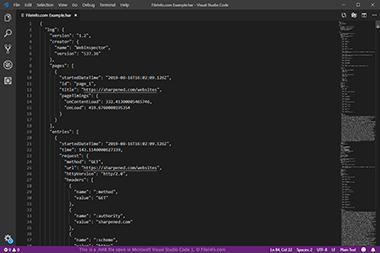
The purpose of the HAR format is to log the performance of web browsers, which allows developers to analyze how well the browsers are loading webpages. HAR files may be exported by various HTTP-related tools, such as Electron HAR, HttpWatch, HTTP Toolkit, but are typically exported by web browsers. Most browsers support the format, including Google Chrome, Mozilla Firefox, Apple Safari, and Microsoft Edge and Internet Explorer.
You can open HAR files with various programs, including the online HAR Viewer tool and the open source, cross-platform HTTP Toolkit. Since HAR files are saved in JSON format, you can also open them using a JSON editor or a plain text editor, such as Microsoft Notepad or Apple TextEdit.
If you open a HAR file in a text editor, you will see the contents in the JSON format organized into the following object types:
- log - Includes information about the HAR format version, log creator, browser version, and list of tracked webpages.
- creator - Includes information about the creator of the log.
- browser - Includes information about the browser.
- pages - Includes information about the list of exported webpages.
- pageTimings - Includes information about the events fired during the page load in milliseconds.
- entries - Includes information about all the HTTP requests.
- request - Includes information about performed requests, including the request method, cookie and header objects, and query parameter objects.
- response - Includes information about the response status, status description, HTTP version, and cookie and header objects.
- cookies - Includes information about all the cookies in the request and response objects.
- headers - Includes information about all the headers in the request and response objects.
- queryString - Includes information about the parameters and values parsed from a query string.
- postData - Includes information about any posted data in the request object.
- params - Includes information about any posted parameters in the postData object.
- content - Includes information about response content in the response object.
- cache - Includes information about a request from the browser cache.
- timings - Includes information about the request and response timings in milliseconds.
NOTE: The HAR format is developed by the Web Performance Working Group of the World Wide Web Consortium (W3C).
Programs that open HAR files
Verified by fileinfo.com.
The FileInfo.com team has independently researched the HTTP Archive FIle file format and Mac, Windows, and Linux apps listed on this page. Our goal is 100% accuracy and we only publish information about file types that we have verified.
If you would like to suggest any additions or updates to this page, please let us know .
PAGE CONTENTS
How to Generate a HAR File in Chrome, IE, Firefox, and Safari
This article shows how to Generate a HAR File in Chrome, IE, Firefox, and Safari. Microsoft Edge (Chromium) is almost the same as Google Chrome.
HAR files are used to gather performance data from the end-users' web browser. It will capture objects, and response calls that a webpage generates.
Additional metrics that can be gathered by HAR are:
- Length of time that it takes to connect to the server
- Length of time to gather DNS information
- Length of time that it takes to transfer assets from the server to the browser
- Length of time that an object takes to be requested
As various ways HAR files are used, Palo Alto Network's support engineers might require you to capture data for troubleshooting purposes.
How to generate a HAR and log file in Chrome
- Open Google Chrome.
- In Chrome, go to the webpage in question.
- Select the Chrome menu > More Tools > Developer Tools
- Select the Networks tab.
- Within the Networks tab , select Preserve log option.
- Record log by selecting the red circle at the top left of the Networks tab.
- Refresh the page and allow Chrome to record browser-website interaction.
- Go back to the Networks tab and right click element. Select " Save HAR with content ".
- Upload HAR and log files to the support ticket.
How to generate a HAR and log file in Firefox
- Open Firefox .
- In Firefox , go to the webpage in question.
- Select the Firefox menu > Web Developer > Network.
- In the center of the Networks tab select refresh .
- Refresh the page and allow Firefox to record the browser-website interaction.
- Once the page is loaded, right click and " Save All As HAR ".
- Select the Console tab and right-click on in the console box. Select all and Copy Message
- Copy log messages to the preferred text editor.
- Upload the HAR and log files to the support ticket.
How to generate a HAR and log file in Safari
- Open Safari .
- In Safari , go to the webpage in question.
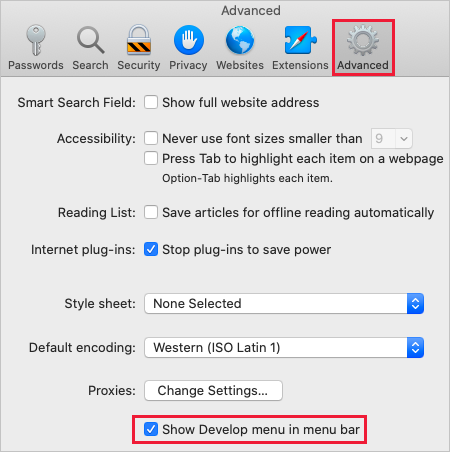
- Enable Developers Tool: Safari > Preferences > Advance > Click Show Develop menu in menu bar
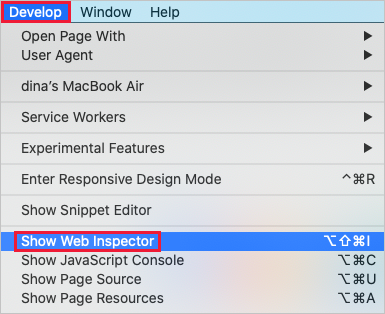
- Select Develop in menu > Show Web Inspector > Select Network tab
- Refresh the page and allow Safari to record the browser-website interaction.
- Once the page is loaded, click on Export on the top right in the window of the Network tab.
- Select the Console tab and screen capture the errors.
- Upload the HAR and console screenshot files to the support ticket.
How to generate a HAR and log file in Internet Explorer (IE)
- In IE , go to the webpage in question.
- To open Developers Tool, pr ess the F12 key on your keyboard, or you may find the Developers Tool in the menu.
- In the Developers Tool menu > Network panel and then deselect the Clear entries on navigate option. (Default)
- Select Start Profiling Session/Start Capture.
- Refresh the page and allow IE to record the browser-website interaction.
- Once the page is loaded, click on Export as HAR/Export capture traffic icon and save
- Click on the Console tab and look for any errors/warnings reported. If errors are shown, please right-click on the console errors and select Copy all.
- Upload the HAR and log files to the support ticket.
- Almost the same as Google Chrome.
Additional Information
Other users also viewed:.
https://knowledgebase.paloaltonetworks.com/KCSArticleDetail?id=kA10g000000CmCtCAK&refURL=http%3A%2F%2Fknowledgebase.paloaltonetworks.com%2FKCSArticleDetail
Documentation
Welcome to the Okta Community!
The Okta Community is not part of the Okta Service (as defined in your organization’s agreement with Okta). By continuing and accessing or using any part of the Okta Community, you agree to the terms and conditions , privacy policy , and community guidelines
Generate a HAR Capture on an iOS Device
Nov 20, 2023 • knowledge article, information.
- On the iOS Device, go to Settings > Safari > Advanced > Enable Web Inspector.
- Connect the iOS device to the Mac computer using a cable and make sure the iOS device is recognized.
- On the iOS device, launch Safari and reproduce the issue.
- Using the Mac computer, launch Safari, then click on Develop > Select the relevant iPad > Click on the session and that will open the developer tools.
- From here, export the HAR file.
- Upload the HAR file on the Support Portal to sanitize the HTTP traces automatically. Refer to How to Sanitize a HTTP Trace File Automatically .
Related References
- Safari Developer Tools
- How to Sanitize a HTTP Trace File Automatically
- Sanitizing HTTP Traces
How can we help?
For technical inquires, please include the name of the hmh platform (eg: ed, thinkcentral, sam, hrw), creating a har file in safari, har (http archive) is a file format used by several http session tools to export the captured data. this can be highly useful in troubleshooting complex issues by obtaining additional information about the network requests that are generated in the browser while an issue occurs. consult the remainder of this technical note for instructions on safari. mar 25, 2024 • knowledge, information.
- content of the pages you downloaded while recording
- your cookies, which will allow anyone with the HAR file to impersonate the account
- all the information that you submitted while recording
- Open Safari and navigate to the page where the issue is occurring. Note: This is tab and window dependent, so if the issue occurs in a new tab or window, the HAR recording needs to be done in that new tab or window.
- If the Develop menu does not display in the menu bar, click the Safari menu and click Preferences .
- Click Advanced , then select Show Develop Menu in the Menu Bar.
- Click the Network tab and reproduce the issue that was being experienced while the network requests are being recorded. Note: Do not close the Network tab. This will end recording and the needed HAR file will be lost.
- Once the issue has been reproduced, click the Export icon and save the file to the computer.
- Attach the HAR file to the email to send to Support. Note: It may be necessary to ZIP the HAR log first as it is possible the HAR log could be quite large.
How to generate HAR files in Chrome, Firefox & Safari?
- August 9, 2023
HAR , short for HTTP Archive, is a format for tracking information between web browsers and websites. A HAR file can identify performance issues, such as bottlenecks, slow load times, and page rendering problems.
HAR exporting is available in most modern web browsers. In this blog, we’ll explain how to generate a HAR file in popular browsers for debugging website issues.
Google Chrome
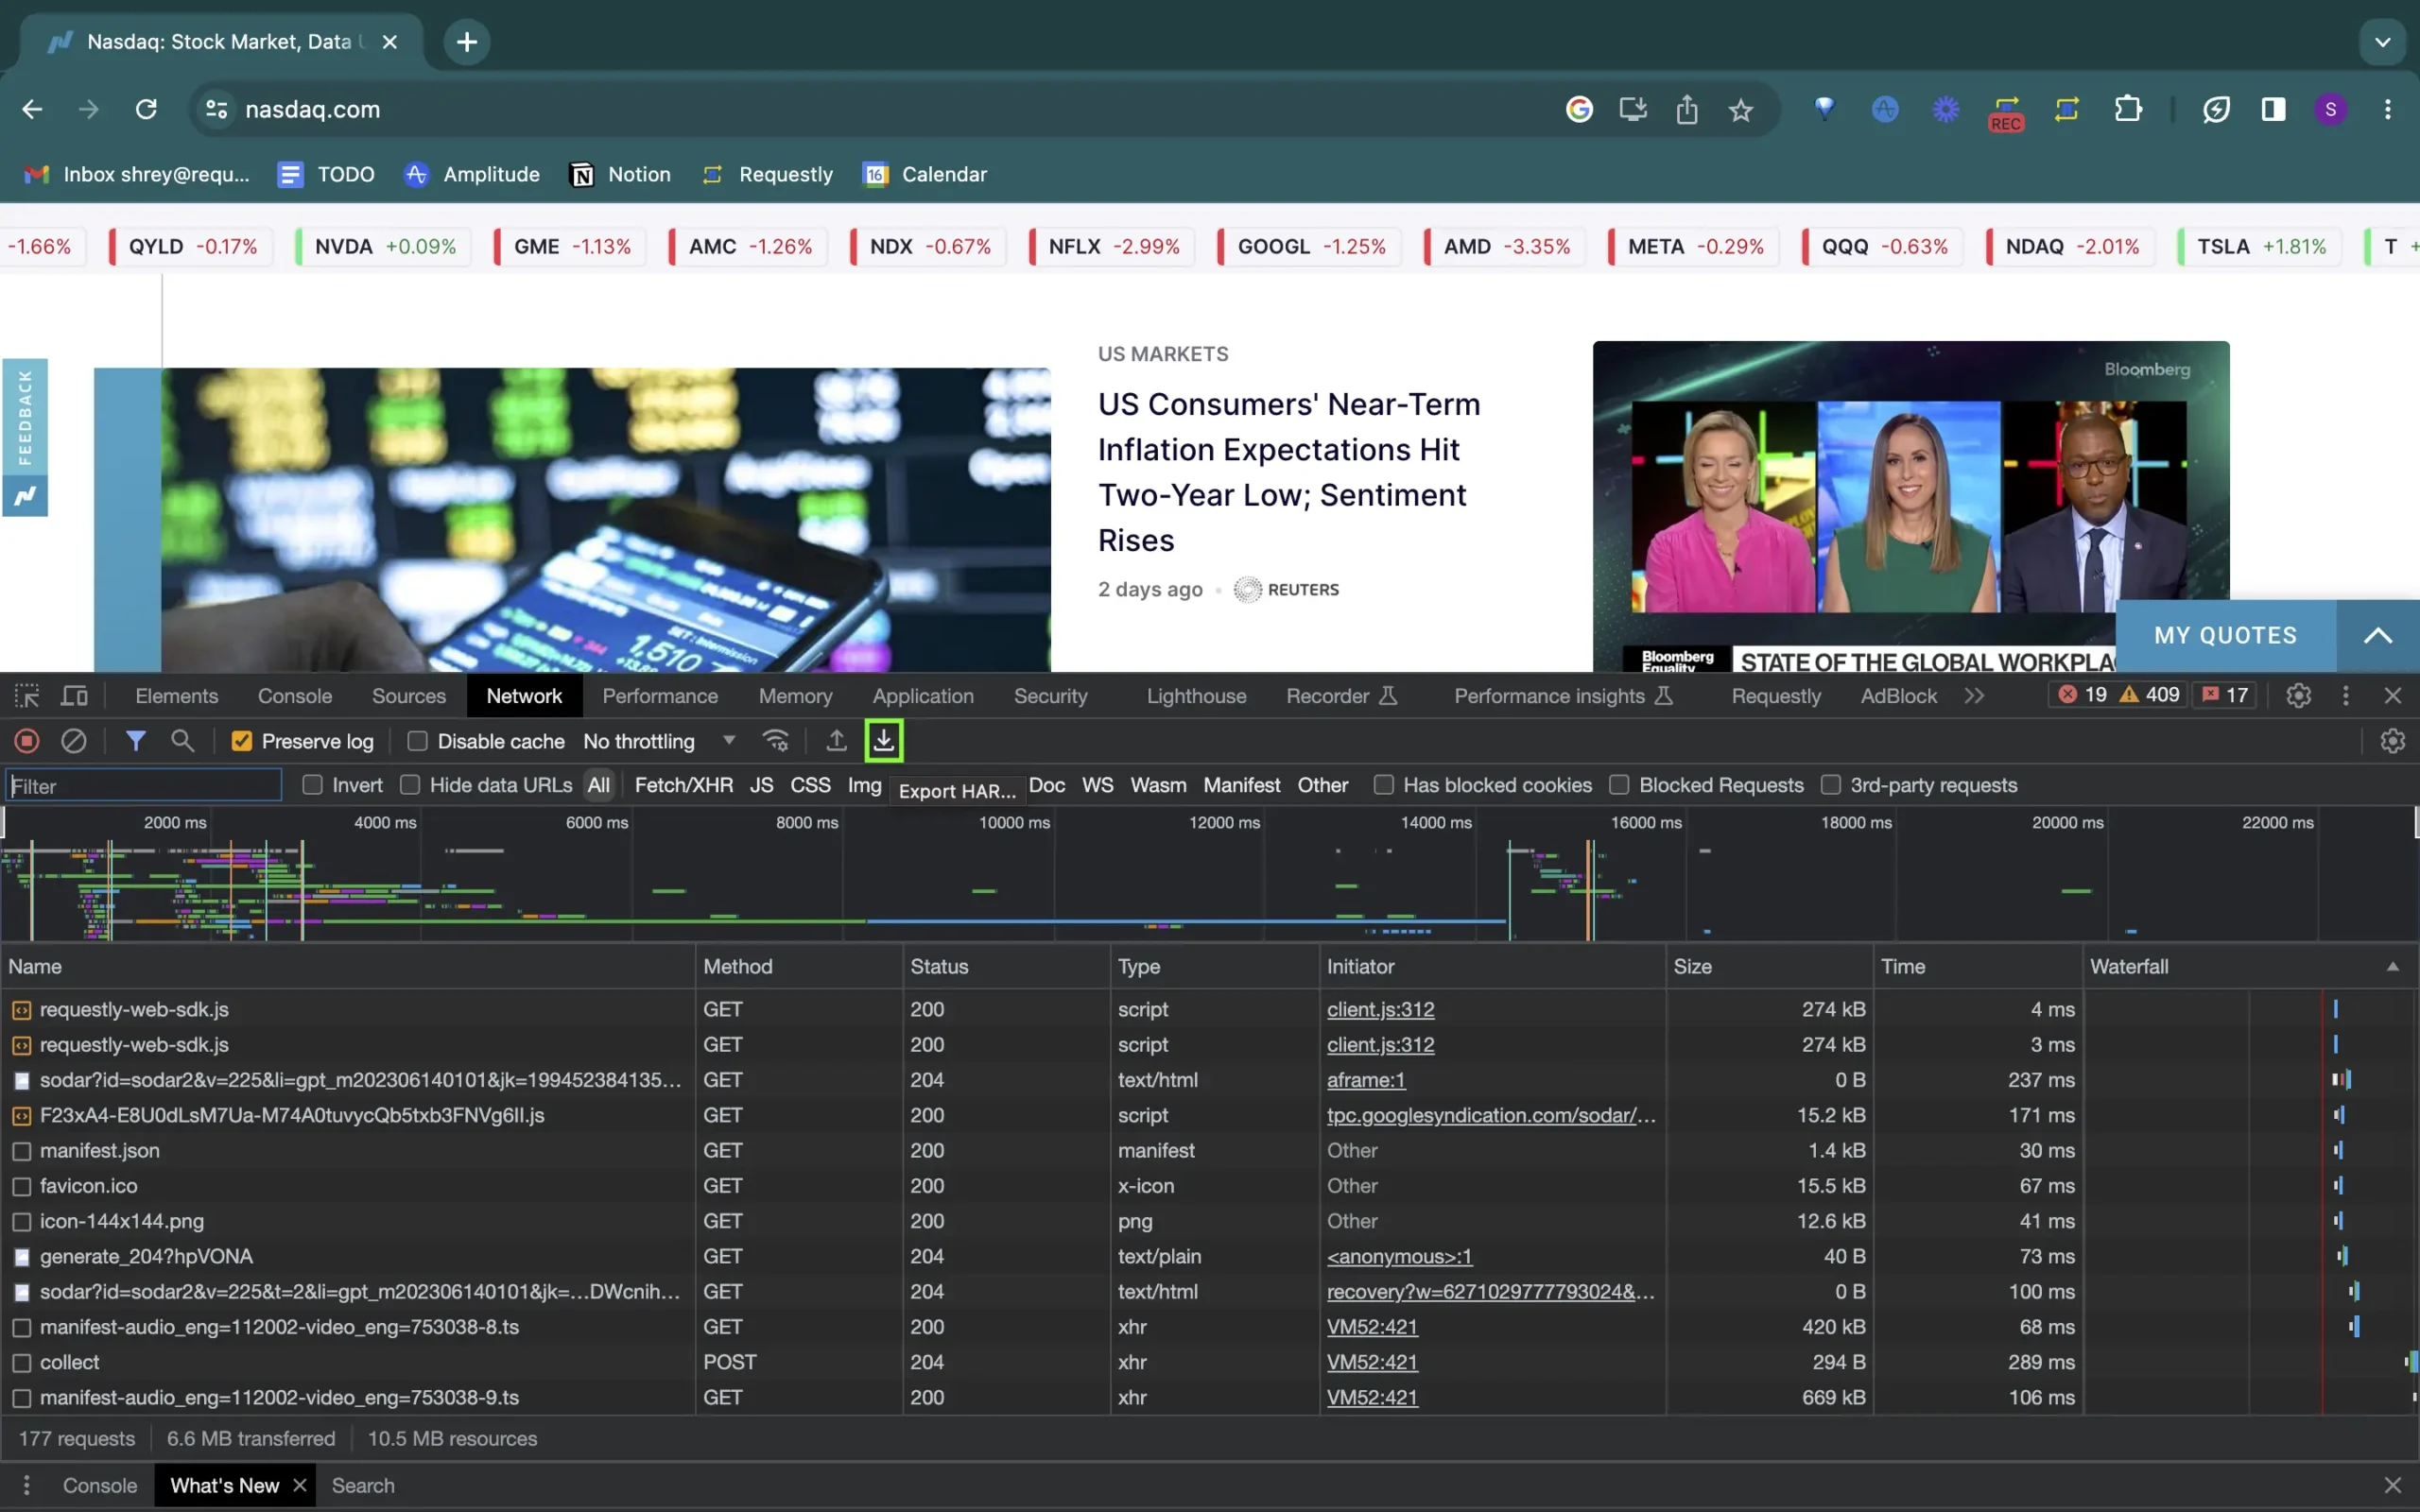
- To open the developer console in Google Chrome, open the Chrome Menu in the upper-right-hand corner of the browser window and select More Tools > Developer Tools.You can also use Shift + ⌘ + C (on macOS), or Shift + CTRL + C (on Windows/Linux).
- In the Developer Tools panel, choose the Network tab.
- Check the “Preserve Log” and Disable cache checkboxes to record all interactions.
- Refresh the page.
- Click the “Export HAR” (down arrow icon) to export the HAR file.
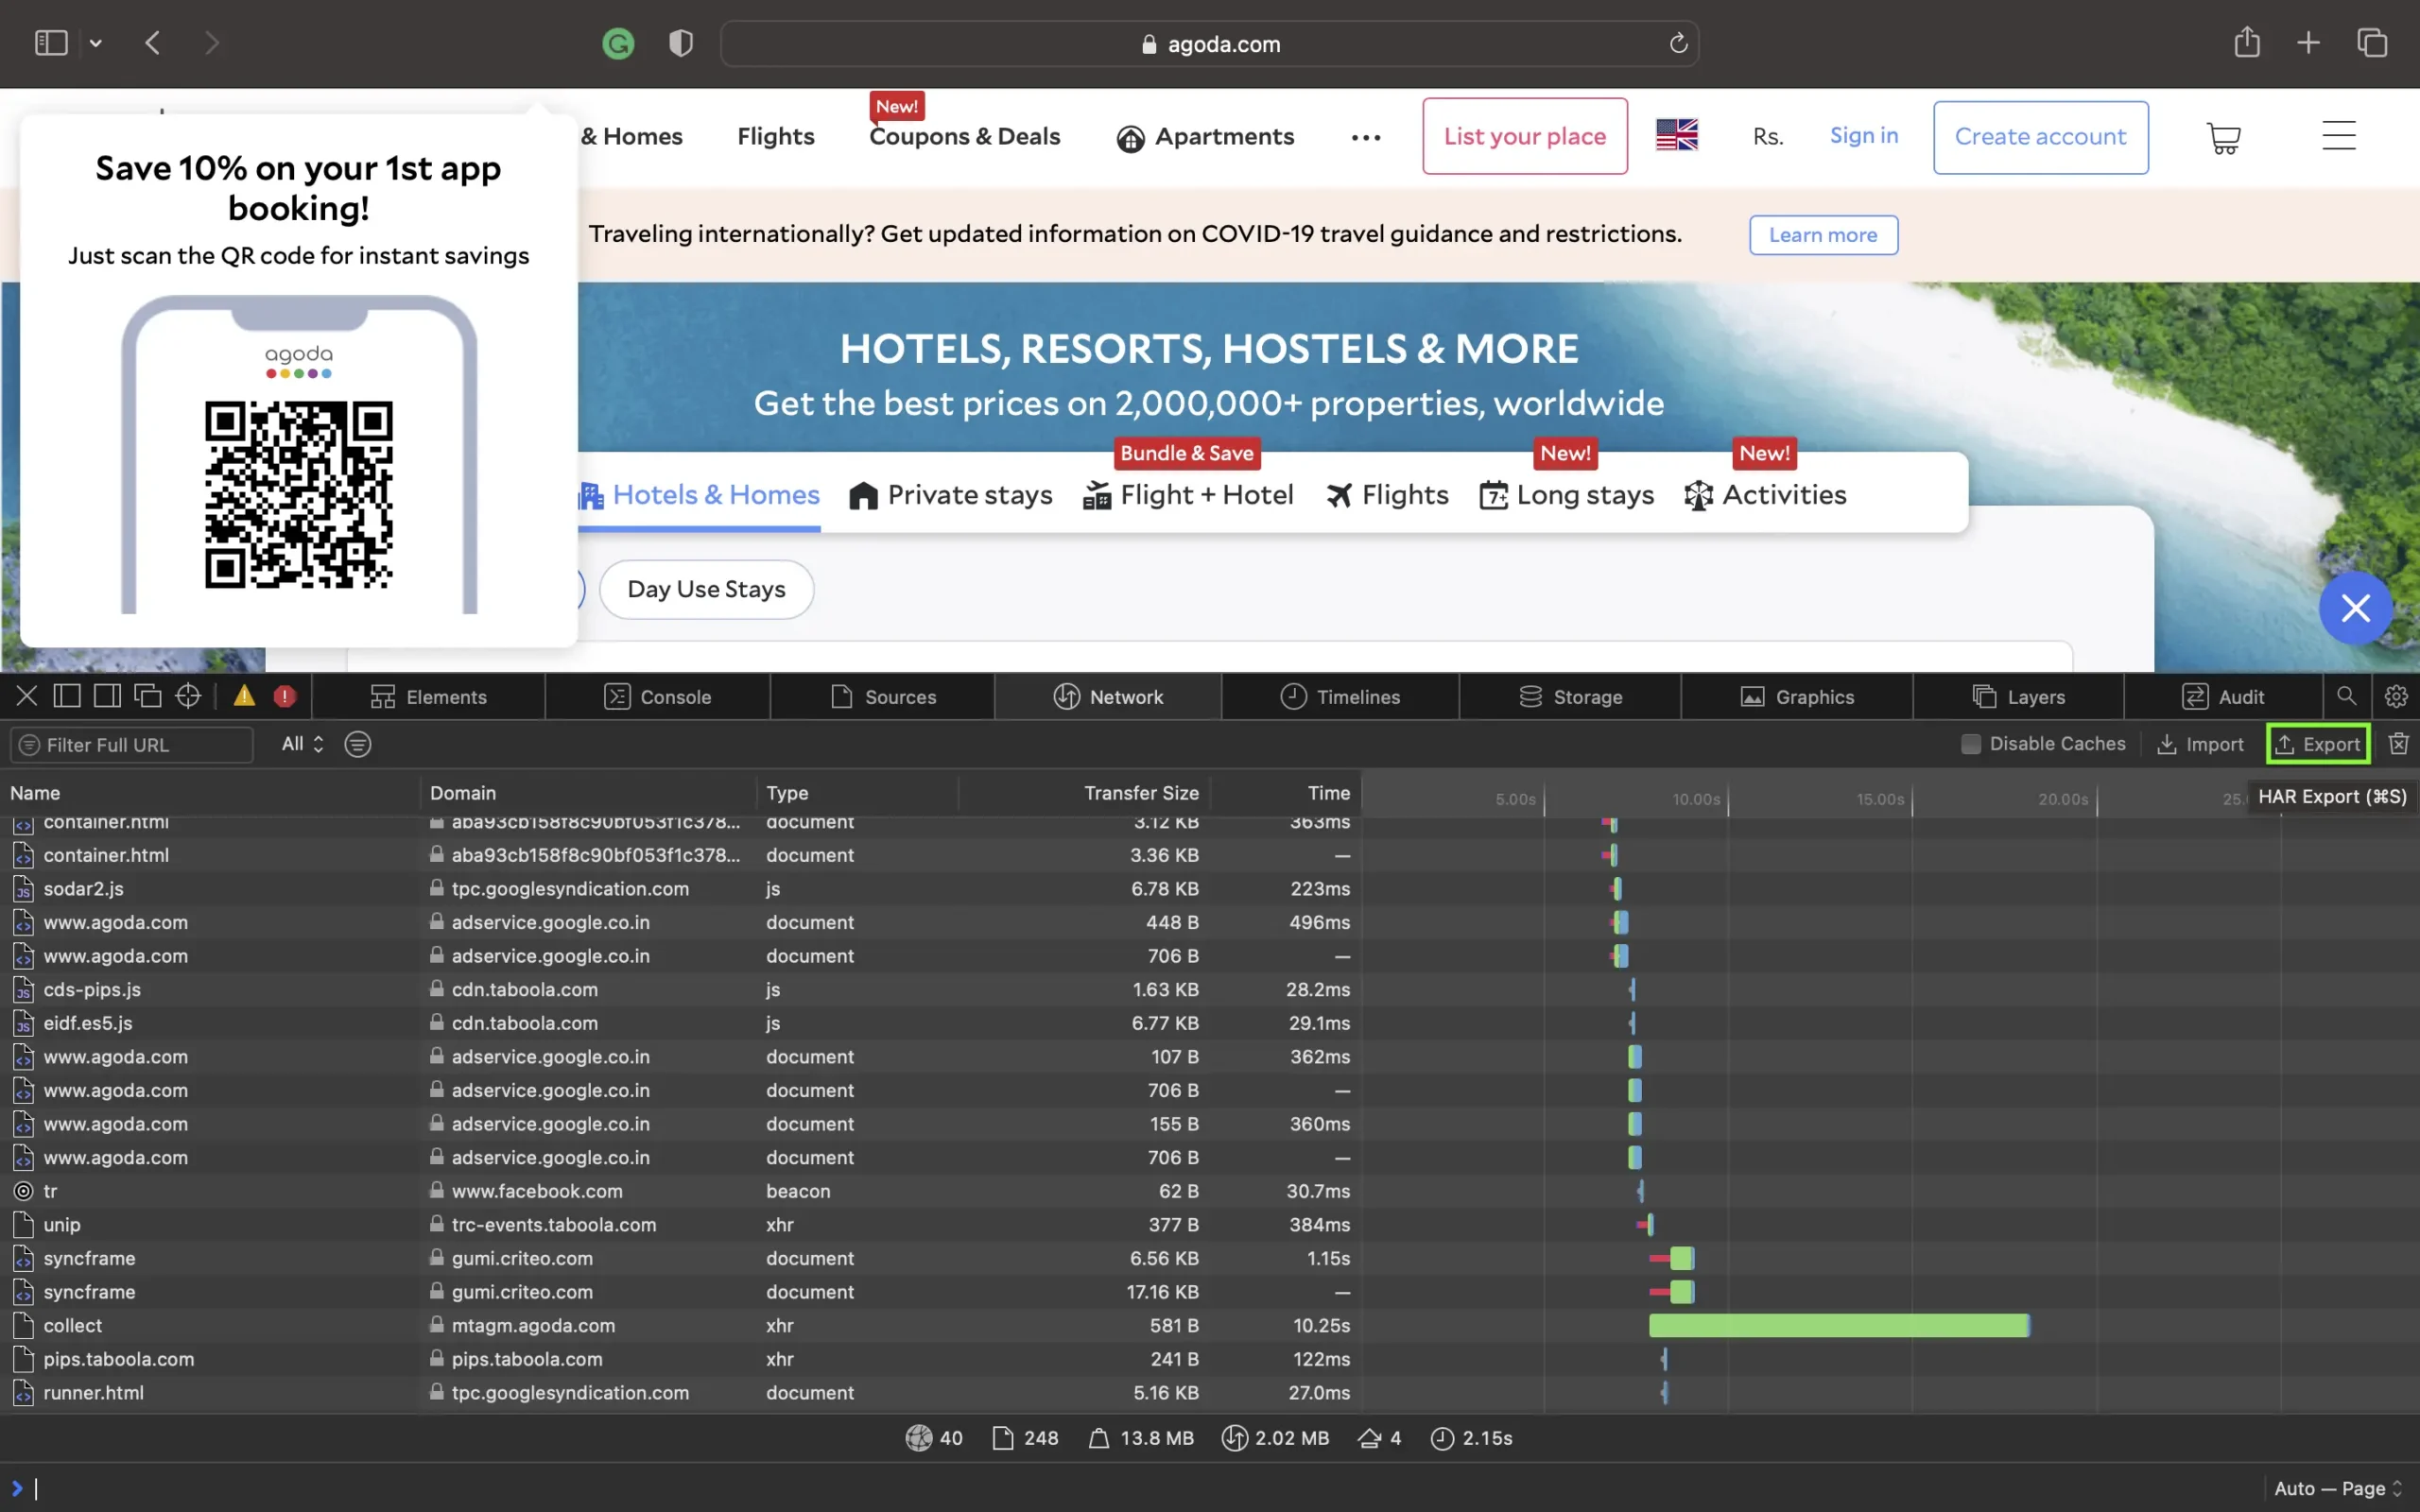
Ensure the ”Show Develop menu” in the menu bar is checked under Safari > Settings > Advanced tab.
- Visit the web page from where you want to export the traffic.
- Click Develop on the Menubar , then select Show Web Inspector . Refresh the page.
- Go to the Network tab and click Export on the upper right side of the pane.
- To open the developer console in Firefox, click on the Firefox Menu in the upper-right-hand corner of the browser and select More Tools > Browser Console. You can also use Option + ⌘ + E (on macOS) or Shift + CTRL + C (on Windows/Linux).
- Go to the Network tab and, click the settings icon (upper right side of the panel), choose Save All As Har .
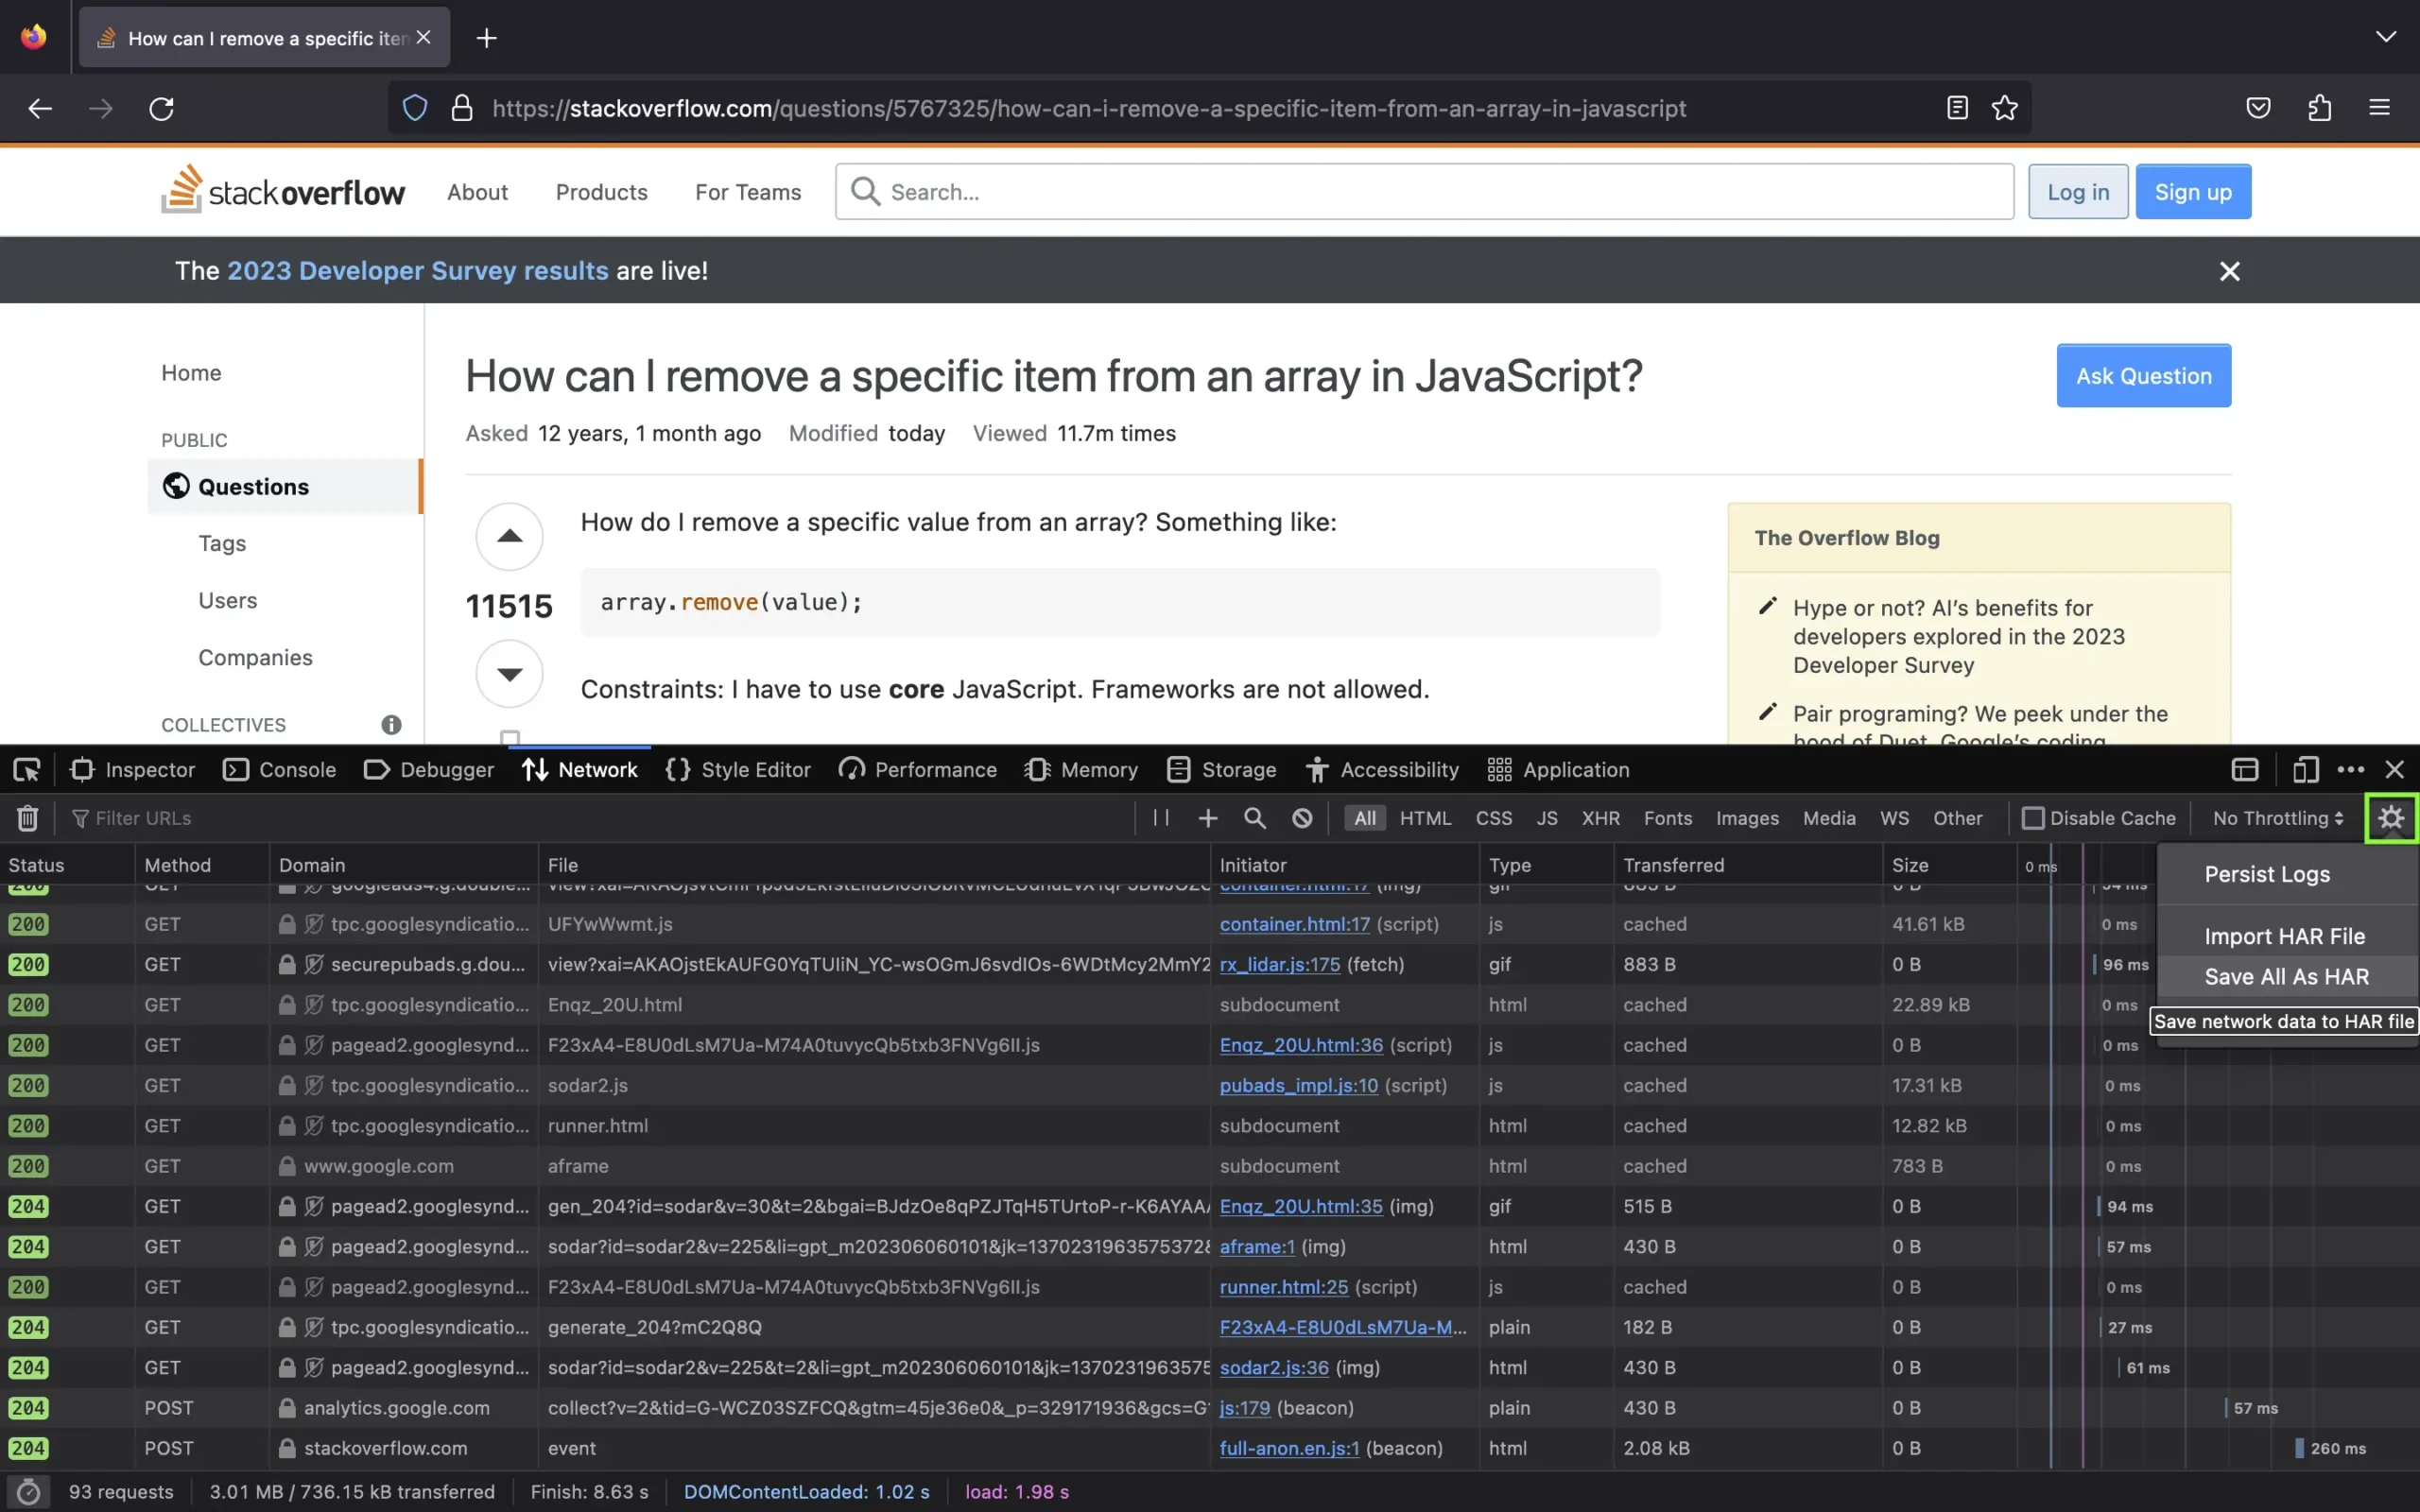
G enerating HAR file using Requestly
You can also use Requestly’s traffic inspector to inspect traffic and save or download a session as HAR for analysis and debugging to be done. Generating a HAR file in Requestly is very easy, just a one-click thing.
- Open Requestly Desktop App and connect an app to get started. Network interception will start automatically.
- Click Download to get the HAR file, which can further be shared with your teammates.
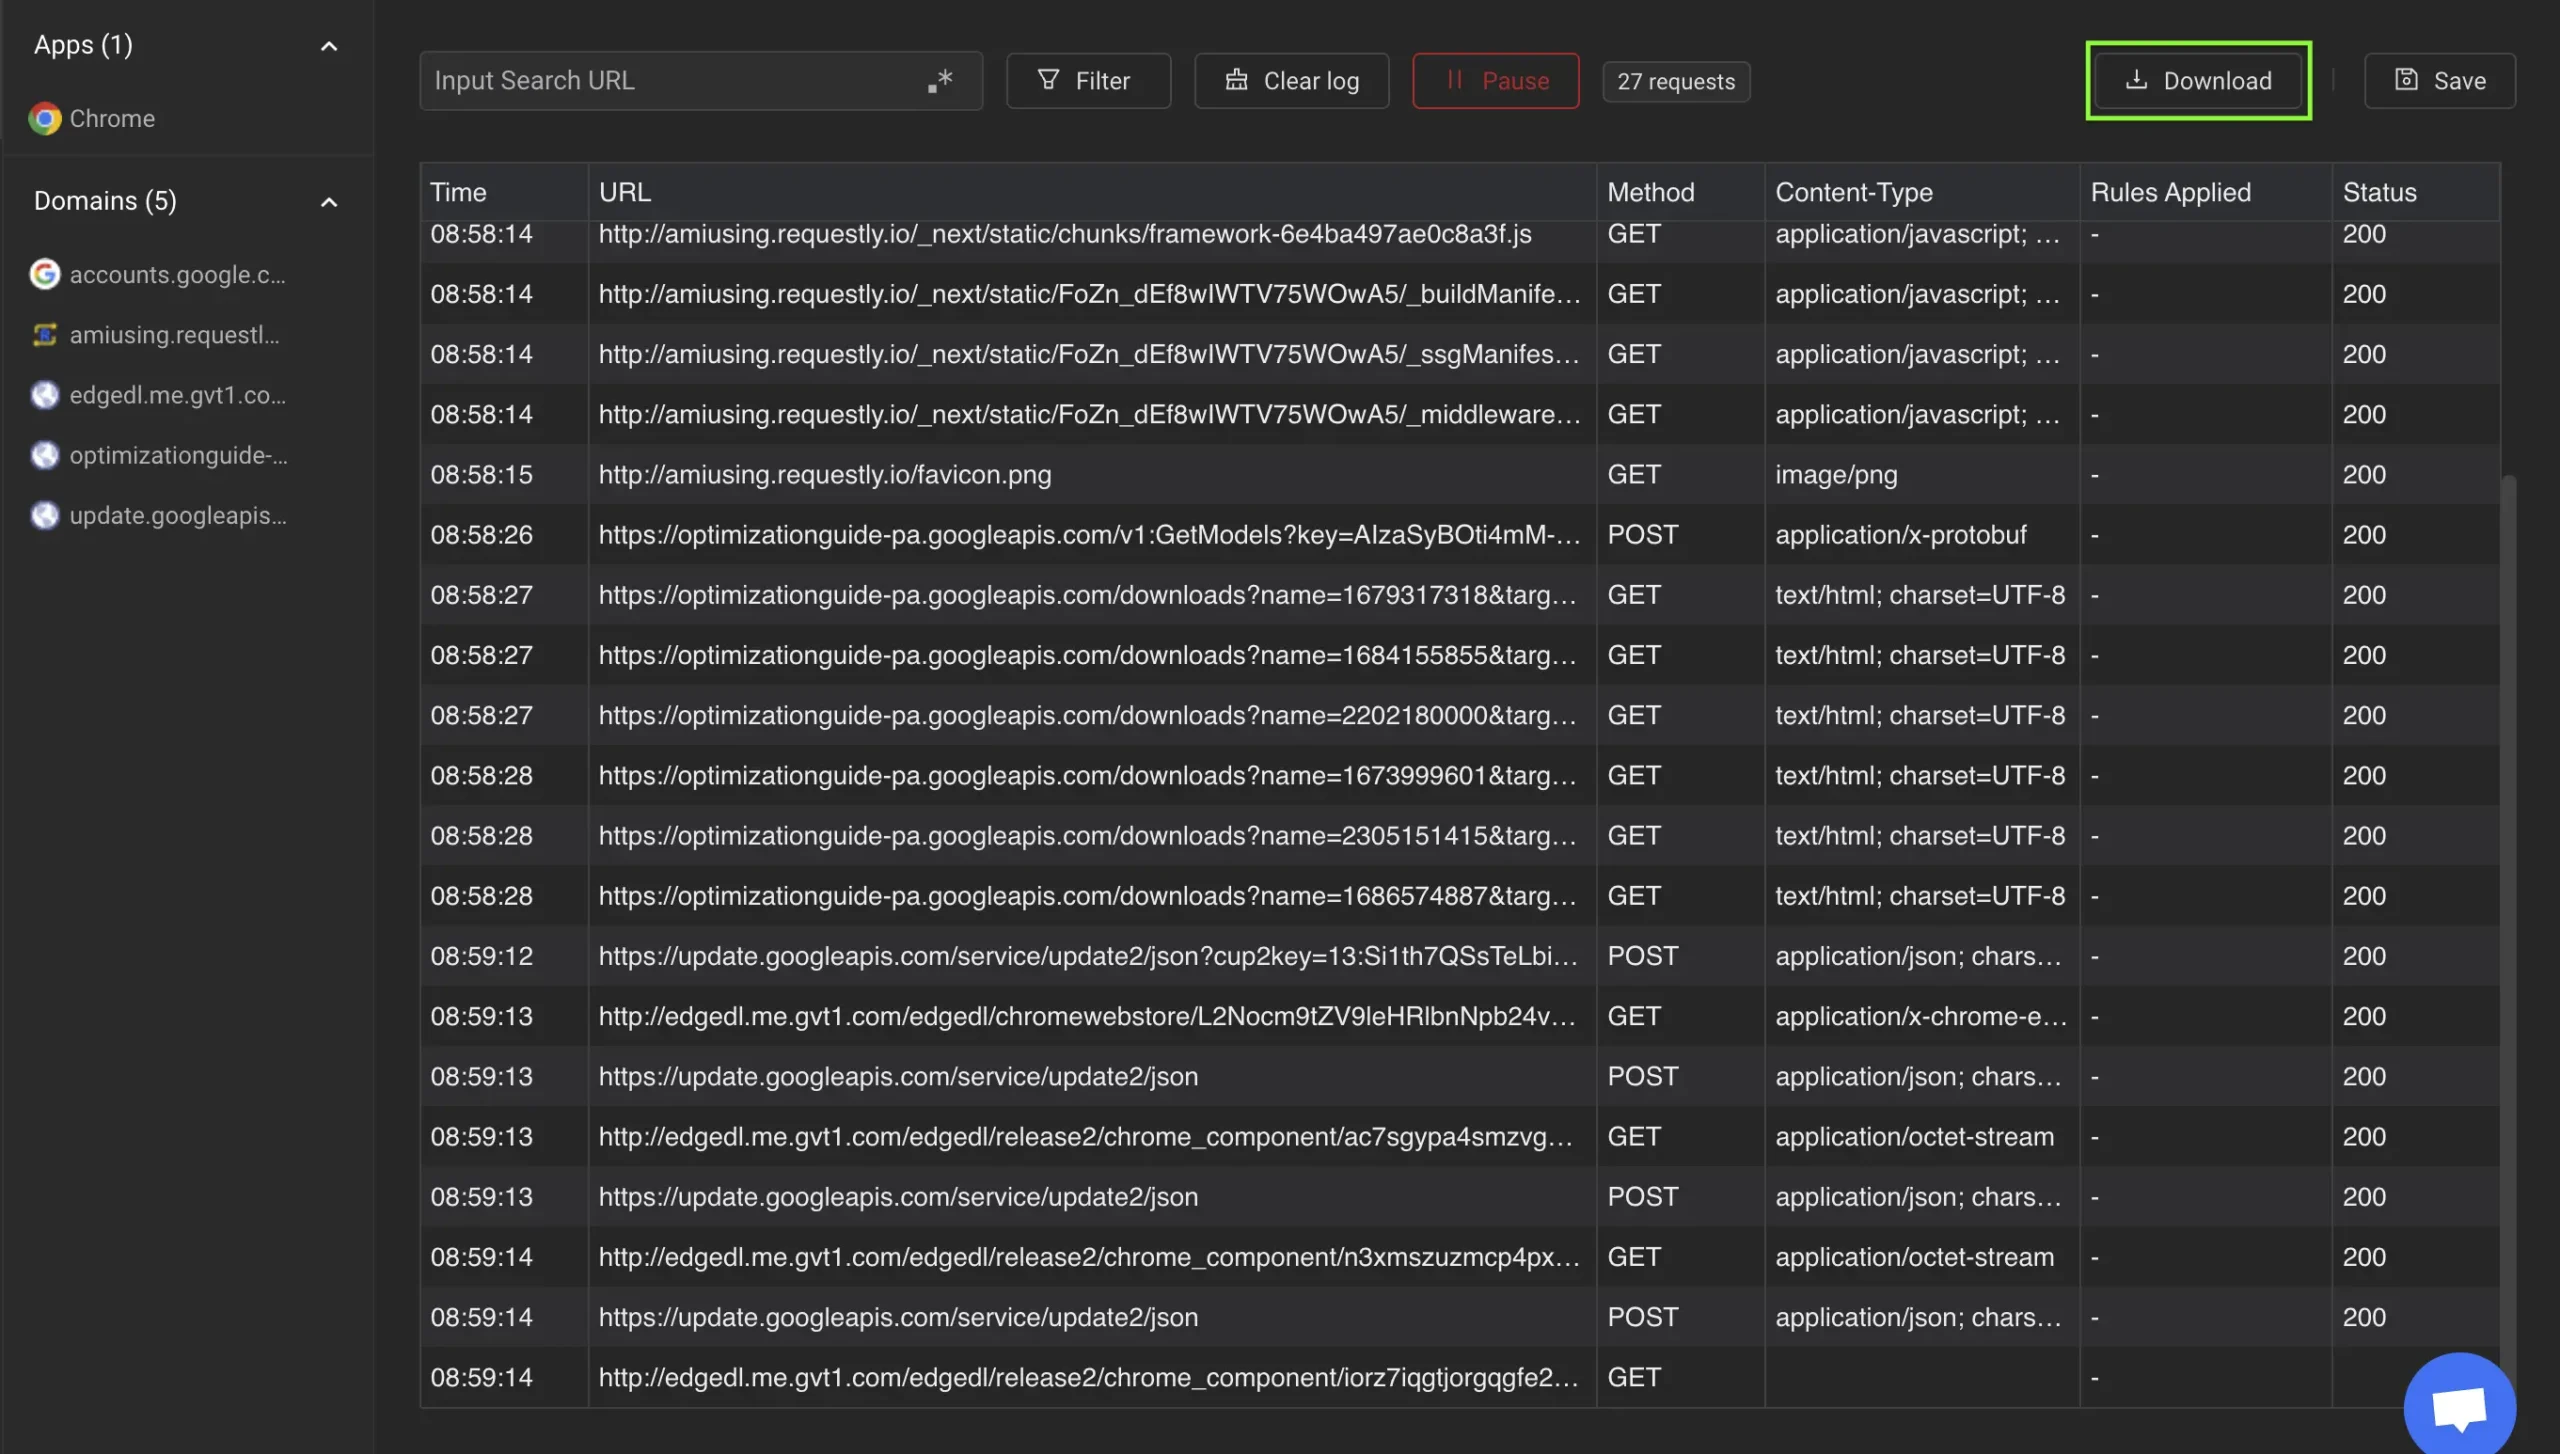
Additionally, you also have the option to save sessions directly in Requestly. These saved sessions will appear under the Sessions tab on the left side menu. You can use those saved sessions for debugging purposes.
This article was written by:
Share this article:
You may also like

Product Update – Feb, 2024

Requestly enables AdToniq, an AdTech company, test, deploy & demo their product on customer’s websites

Debug & Mock GraphQL APIs using Requestly
- HTTP Rules (Web Debugger) Intercept and modify requests, inject scripts, Map Local, Map Remote, etc.
- Mock Server Quickly create API Mocks.
- SessionBook Beta Capture, report and debug with screen recording, network logs and console logs.
- API Client A minimalistic API Client to test APIs.
- Case Studies
- Release Notes

- Knowledge Base
Access official resources from Carbon Black experts
- Carbon Black Community
- How to Collect a HAR File and HTTP Error Logs Usin...
How to Collect a HAR File and HTTP Error Logs Using Safari
- Article History
- Subscribe to RSS Feed
- Printer Friendly Page
- Report Inappropriate Content
- App Control
Carbon Black Cloud
- Endpoint Standard
- Enterprise EDR
- carbon black cloud

- Cookie Policy
- Your California Privacy Rights
Copyright © 2005-2023 Broadcom. All Rights Reserved. The term “Broadcom” refers to Broadcom Inc. and/or its subsidiaries.
Thank you for your feedback.
- English
- Deutsch
- Italiano
- Français
Your Questions About HAR Files Answered
HAR Files provide a snapshot of the interactions or calls made between a web browser and a web server. Here’s a closer look at what data they contain, why they’re useful, and how to use them.
- Unified Fast File and Object

Jun 12, 2023

In web development, there are a few tools that developers can use to troubleshoot, optimize, and debug sites. One of those is an HTTP Archive (HAR) File, a file that provides a snapshot of the interactions or calls made between a web browser and a web server. Here’s a closer look at what data they contain, why they’re useful, and how to use them.
What Is a HAR File?
Websites are hosted on web servers, which contain all the data for that website: data such as images, scripts, and code. When a user accesses a site via a browser, a series of calls are made with each command, and the server responds to each by returning the requested data, which is then displayed in the browser.
This “conversation” between the web browser and web server can contain valuable information about how a site is functioning. HTTP Archive Files, or HAR files, are files that provide a log of browser activities, or network requests, that occur while accessing a website—whether it’s Firefox, Chrome, Safari, etc.
What Are the Contents of a HAR File?
A HAR file uses a nested data structure that includes all of the elements of activity:
- Network traffic
- Cookies and cached data
- Request and response data, and any status codes
- Request and response times, such as the duration of a request, DNS and SSL times, time to initiate, and time to receive
- Site headers
- Content called up and its payload, such as images, text, web scripts, and video
- Any errors that occur, such as server errors
HTTP Archive (HAR) Files Are JSON Logs
In web development, different programming languages and syntaxes are used for different functions. JSON, or JavaScript Object Notation, is a data-interchange format used in front-end programming. JSON is the standard format for HTTP Archive Files, which makes it easy to open and view in any text editor application. It’s not just easy for computers to parse and read—it’s human-readable, too, although there are tools, mentioned below, that can simplify these files.
Why Do HAR Files Exist?
HAR files exist to analyze network traffic and site communications between a browser and web server. They exist because browsers allow users to record site activity, then export them for analysis. Once the “record” option is toggled on in the browser, all traffic and interactions will be saved in the file.
Why Are HAR Files Useful?
HAR files are useful for web developers, site analysts, security teams, and compliance audits. HTTP Archive files are beneficial because they enable fast, easy analysis of a site for a variety of functions and outputs.
Benefits of HAR Files in Development and Debugging
A few examples of the benefits of HAR files include:
- Analysis and optimization of a site’s performance. Being able to review and analyze an entire HTTP conversation with a website helps developers identify bottlenecks, diagnose errors, and improve page loading times.
- Security analysis, compliance, and auditing. The report makes it easy for web teams to provide evidence of security and compliance.
- Debugging and issue diagnosis
- Locating broken links, such as 404s; 4xx or 5xx status codes; and errors caused by misconfigurations
- Identifying large files that may be slowing load times that could be compressed to make the site more efficient
- Enabling collaboration or support teams to jump in and help on a site. Page structure and load order give developers new to a project a better sense of how a page is built, including any embedded stylesheets (CSS) or scripts.
Examples of Use
- Compliance. Say a healthcare organization has a patient portal which is subject to regulatory standards. HAR files can be used to record network activity to report out adherence to compliance standards.
- Penetration testing or white hat hacking. A web development agency may use a HAR file to examine network traffic for security analysis, identifying any suspicious activity or potential site vulnerabilities.
Who Accesses or Uses HAR Files?
How web developers use har files.
Web developers may use HAR files when they want a fast, behind-the-scenes snapshot of how a site is performing, or to quickly identify where something may be off or need fine-tuning for better performance.
HAR Files Help Quality Assurance Engineers
QA engineers can use HAR files to uplevel many aspects of their roles, such as performance testing, debugging, and narrowing down the causes of issues that may affect user experience or the integrity of a site. The file then helps them communicate those issues with developers for faster fixes.
How Cybersecurity Teams Use HAR Files
Whether it’s proactive, by identifying potential issues in anomalies, or reactive, like investigating malicious activity, HAR files are incredibly useful to cybersecurity teams. By thoroughly examining site requests and responses, cybersecurity professionals can spot unexpected activity or anomalies in them.
Generating and Accessing HAR Files in Different Browsers
In general, the steps for recording and generating a HAR file are consistent across browsers. It may vary depending on the browser, but typically it involves accessing developer tools through a right-click action.
How to View the Contents of a HAR File
Steps for analyzing har files in chrome.
- In Chrome, right-click on a page and select Inspect to access Developer Tools.
- Select Network and check the Preserve log box, and click Record . Interact with the site as needed.
- Right-click again and select Save all as HAR to save the file.
Steps for Analyzing in Safari
- In Safari, select Preferences , then Advanced , then Show Develop to access Developer Tools.
- Select the Network or Performance tab, turn on record, or the network capture feature, and interact with the site as needed.
- Stop the recording and save the HAR file.
Steps for Analyzing in Firefox
- In Firefox, right-click on a page and select Inspect Element to access Developer Tools.
- Select the Network tab, enable Persist Logs , and interact with the site.
- Right-click again and select Save All as HAR to save the file.
Tips and Tricks
Despite being human-readable and easy for computers to parse, the reality is that HAR files contain a lot of data. They can be complex, so having the right tools to visualize them can make faster work of analysis. You’re better off using a tool that provides a user interface, such as a browser extension or dedicated HAR tool.
Best Practices
A couple of best practices to make working with HAR files easy, collaborative, and secure include:
- Obfuscating sensitive data such as logins and passwords for security purposes
- Automating HAR file parsing and analysis. Speed up insights from these files with various tools or scripts to more easily incorporate HAR file analysis into web development workflows.
Free and Open Source HAR File Tools
HAR file tools can make a big difference in how quickly and easily you can analyze them. Tools can offer search, sorting, filtering, navigation, and other functions. Here are a few options:
- HAR Viewer : A free web-based tool
- HAR Extractor: A free tool with an API that allows you to extract key data
- HAR Analyzer: Another free tool with its own CLI and ability to generate reports
HAR files are an excellent addition to the toolbox and workflow of developers, QA analysts, and cybersecurity professionals. Knowing what you can glean from these files, how to access them, and the best tools to streamline analysis will help you incorporate these valuable resources into any web workflow, resulting in better performance, user experience, and security.
Written By: Pure Storage
Related Stories


Protected: Demystifying DirectFlash Modules vs. SSDs vs. HDDs vs. Hybrid
There is no excerpt because this is a protected post.

The Difference between LLMs and MLLMs
AI is transforming computing and revolutionizing industries. This article looks at two types of...

SQL vs. NoSQL Databases
Applications need a database for storage. There are two kinds of databases to choose...

Managing the Perils of Data Exfiltration
Cyberattacks that involve data exfiltration are on the rise. In this article, we explore...
Top Stories
Why nand flash is reliable for enterprise workloads, 4 data deduplication challenges (and how to solve them), san vs. nas vs. das: what’s the difference , qlc vs. mlc: which is the better ssd, mongodb vs. postgresql.

Generate HAR files
HTTP Archive (HAR) is a format used to track information that travels between web browsers and websites. Access Gateway primarily uses HAR files to replicate end user or administrator errors. The following sections describe how to generate HAR files using common browsers such as Chrome , Firefox , Safari , and Edge .
Before sending the HAR file to Okta, ensure that you remove or hide any sensitive information, such as any confidential or personally identifying information, or confidential application information, using a text editor. To learn more, see Sanitize HTTP Traces and How to Sanitize a HTTP Trace File Automatically .
Generate a HAR file in Chrome
- Close all incognito tabs and windows in Chrome.
- Open a new incognito window.
- Click the more actions menu (...) to the right of the toolbar and select More tools Developer Tools .
- Select the Network tab.
- Ensure that Chrome is recording. A red button indicates that a recording is already in progress. Otherwise, click Record network log .
- Select Preserve Log .

- Go to the page where the issue occurred and reproduce the issue.
- Click Export HAR (the down arrow icon) to export the file as HAR.
- Save the HAR file.
Generate a HAR file in Firefox
- Close all private tabs and windows in Firefox.
- Open a new private window.
- Go to the page to be recorded.

- In the developer tools docked tab select Network .
- Go to the page where the issue occurred and reproduce the issue. The page automatically starts recording as you navigate.
- When you're finished, click Pause/Resume recording network log .
- Right-click anywhere in the File column and select Save All as HAR .
Generate a HAR file in Safari
- If the Develop menu doesn't appear in the menu bar, go to Safari Settings .
- Click Advanced .
- Select Show Develop menu in menu bar .
- Close all private tabs and windows in Safari.
- From the Develop menu select Show Web Inspector .
- Click the Network tab.
- When you're finished, click Export .
- Save the file.
Generate a HAR file in Edge
- Close all InPrivate windows.
- Press Ctrl + Shift + N to open a new InPrivate window.
- Click the Settings and more menu (...) to the right of the toolbar and select More tools Developer tools .
- Click Network .
- Ensure that Edge is recording. A red button indicates that a recording is already in progress. Otherwise, click Record network log .
- Visit the page and complete the steps that trigger the issue.
- When you're finished, click Stop recording network log .
- Click Export HAR (the down arrow icon) or press Ctrl + S to export the file as HAR.
Related topics
Application process flow
Troubleshoot applications
Troubleshooting tips and techniques
© 2024 Okta, Inc . All Rights Reserved. Various trademarks held by their respective owners.
- Open or view cases
- Site feedback
- My Citrix account
- Citrix Cloud
- Citrix Cloud Government
- My support alerts
- Sign out Sign in
Customers who viewed this article also viewed
Identify changes in netscaler build files with, file integrity monitoring, create a har file for safari, instructions.
IMPORTANT: Please note that HAR files contain sensitive clear text data including content of pages while recording, such as user names, passwords, keys, etc, and should only be shared with trusted recipients via secure channels such as https://cis.citrix.com. Sharing files via email is not recommended. Remove any sensitive information from the file before you send it to Citrix Support. 1. Open the HAR file in a text editor 2. Identify and replace all sensitive information captured in the HAR file with a placeholder 3. Save HAR File
The following instructions provide the steps to generate a HAR file for troubleshooting.
- Open your browser.
- Press Option + Command + i to view the page.
- Select the Network tab.
- Reproduce the error
- Select Export as HAR File .
- Provide the saved HAR file to technical support.
Additional Resources
- CTX275204 - Creating a HAR file from your browser to share with support
- CTX275203 - Create a HAR file for Chrome
- CTX275208 - Create a HAR file for Edge
- CTX275207 - Create a HAR file for Firefox
- CTX275206 - Create a HAR file for Internet Explorer
Page feedback
Featured products.
Failed to load featured products content, Please try again .
{{ getHeading('digitalWorkspaces') }}
- {{ item.title }}
{{ getHeading('networking') }}
Generate and Analyze HAR Files
Troubleshoot
Get Support
- Sanitize HTTP Traces
- Debugging Best Practices
- Error Handling Best Practices
- Performance Best Practices
- General Usage and Operations Best Practices
Auth0 Product Lifecycle
A HAR (HTTP Archive) file shows the sequence of redirects that happen during a login transaction. It's an excellent tool for debugging authentication issues, as it can identify where things get stuck. A HAR file is a JSON formatted log of a web browser's interactions with a web server. If authentication isn't working as expected, you can generate and analyze HAR files to find issues. Including a HAR file in your support requests can help speed up the troubleshooting process.
Before sending the HAR file to Auth0, ensure that you remove or obfuscate any sensitive information (such as any confidential or personally identifying information as well as confidential application information) using a text editor. To learn more, read Sanitize HTTP Traces .
Generate HAR files with browsers
Google chrome.
Close all incognito windows in Google Chrome.
Open a new incognito window in Google Chrome.
Go to View > Developer > Developers Tools .
In the Developer Tools pane, choose the Network tab.
Check the Preserve Log checkbox to record all interactions.
Visit the page and complete the steps that trigger the issue.
Choose the Network tab.
Click the down arrow to export the HAR file.
Save the HAR file.
After you save the file, you must remove sensitive information from its contents before sharing it with Auth0 Support. For full details, review Sanitize HTTP Traces .
Ensure that Show Develop menu in menu bar checkbox is checked under Safari > Preferences > Advanced .
Choose File > Open New Private Window .
Choose Show Web Inspector in the Developer menu, then navigate to the Network tab.
To the right of All near the top-left of the Web Inspector, click the Filter button and choose Preserve Log.
Visit the web page where the issue occurs.
Choose Develop > Show Web Inspector . The Web Inspector window appears.
Complete the steps on the page that trigger the issue.
Select the Network tab.
Click Export on the upper right side of the pane.
Close all private windows in Firefox.
Open a new private window in Firefox.
Go to Tools > Developer > Network or ctrl-shift-E .
Click the Network tab and choose Persist Logs.
Choose the Network tab and right click and then select Save All As Har .
Microsoft Edge
Close all InPrivate windows in Microsoft Edge.
Open a new InPrivate window ( Ctrl + Shift + N ).
Go to Settings and more (the ... icon) then choose More Tools > Developer Tools .
Start a profiling session on the Network tab of the Developer Tools toolbar.
Select Export as HAR (Ctrl+S) and save the HAR file.
Internet Explorer
Close all InPrivate windows in Internet Explorer.
Open a new InPrivate window in Internet Explorer ( ctrl+shift+P .)
Go to Tools > F12 Developer Options > Network .
Ensure Clear entries on navigate is switched off.
Choose the Network tab and select Export as HAR (Ctrl+S) .
Analyze HAR files
To view the HAR file, use a tool such as Google's HAR Analyzer .
Analyze the list of web requests captured in the HAR file. In particular, check the sequence of redirects to see how far you get in the authentication process. This helps identify where the issue is happening.
Compare the sequence of redirects to the expected sequence for your authentication flow.
For example:
There should be a call to the /authorize endpoint to start the authentication flow.
There may be redirects to remote identity providers to prompt the user to log in.
Then there should be a redirect back to Auth0 /login/callback ( https://login.auth0.com/login/callback ).
Then there should be a redirect back to your application’s callback URL.
See the Monitoring page for more details on each of the log events that can help you troubleshoot issues.
- Customer Support
- Open and Manage Support Tickets
Was this article helpful?
How to generate a HAR file
Adobe teams and enterprise customers.
Generating a HAR file would be helpful if you need detailed information about network requests within the customer's browser for troubleshooting. This article helps you know how to generate a HAR file in Chrome, Firefox, Edge, and Safari.
The screenshots below show the DevTools in Focus Mode with a vertical Activity Bar. Depending on your settings, your configuration may look different. For more information, see Simplify DevTools using Focus Mode .
Google Chrome
The following steps show how to use the developer tools in Google Chrome. For more information, see Chrome DevTools .
In the Chrome browser, navigate to the step prior to where the issue occurs.
Press F12 to launch the developer tools. You can also launch the tools from the toolbar menu under More tools > Developer tools .
By default, the browser keeps trace information only for the page that's currently loaded. Set the following options so the browser keeps all trace information, even if your repro steps require going to more than one page:
Select the Console tab, select Console settings, then select Preserve Log.

Select the Network tab, then select Preserve log.

On the Network tab, select Stop Recording network log and Clear.

Select Record network log, then reproduce the issue in the browser.

You'll see a session output similar to the following image.

After you have reproduced the unexpected behavior, select Stop Recording network log, then select Export HAR and save the file.

Package the browser trace HAR file, and console output, in a compressed format such as .zip.
Attach the compressed file to the support ticket.
The following steps show how to use the developer tools in Apple Safari on Mac. For more information, see Safari Developer Tools overview .
Enable the developer tools in Safari:
Select Safari, then select Preferences.
Select the Advanced tab, then select Show Develop menu in the menu bar.
In the browser, navigate to the step prior to where the issue occurs.
Select Develop, then select Show Web Inspector.
Select the Console tab, then select Preserve Log.

Select the Network tab, then select Preserve Log.

On the Network tab, select Clear Network Items.

Reproduce the issue in the browser. You'll see a session output similar to the following image.

After you have reproduced the unexpected behavior, select Export and save the file.

Back in the browser developer tools pane, select the Console tab and expand the window. Place your cursor at the start of the console output then drag and select the entire contents of the output. Use Command-C to copy the output and save it to a text file.

Package the browser trace HAR file, console output, and screen recording files in a compressed format such as .zip.
The following steps show how to use the developer tools in Firefox. For more information, see Firefox Developer Tools .
Press F12 to launch the developer tools. You can also launch the tools from the toolbar menu under More tools > Web developer tools .
Select the Console tab, select the Settings icon, and then select Persist Logs.

Select the Network tab, select the Settings icon, and then select Persist Logs.

On the Network tab, select Clear.

Reproduce the issue in the browser. You'll see session output similar to the following image.

After you have reproduced the unexpected behavior, select Save All As HAR.

Microsoft Edge
The following steps show how to use the developer tools in Microsoft Edge. For more information, see Microsoft Edge DevTools .
Press F12 to launch Microsoft Edge DevTools. You can also launch the tools from the toolbar menu under More tools > Developer tools.
By default, the browser keeps trace information only for the page that's currently loaded. Set the following options so the browser keeps all trace information, even if your repro steps require going to more than one page.
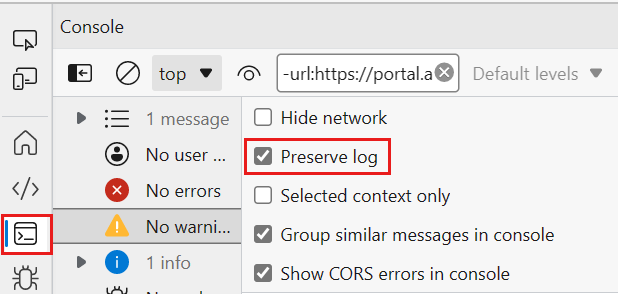
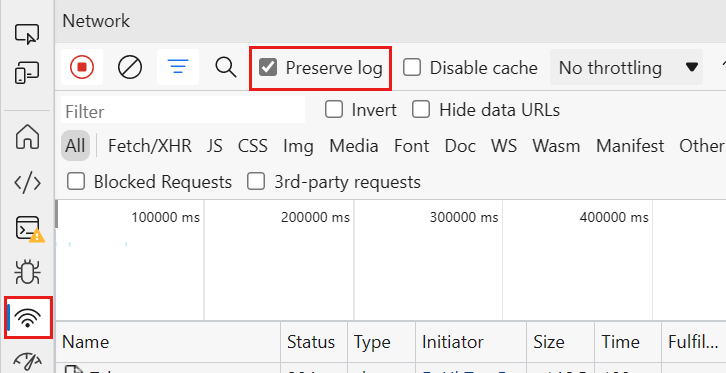
Select the Network tab. If that tab isn't visible, click the More tools (+) button and select Network. Then, from the Network tab, select Preserve log.
Select Record network log, then reproduce the issue in the portal.

You'll see session output similar to the following image.
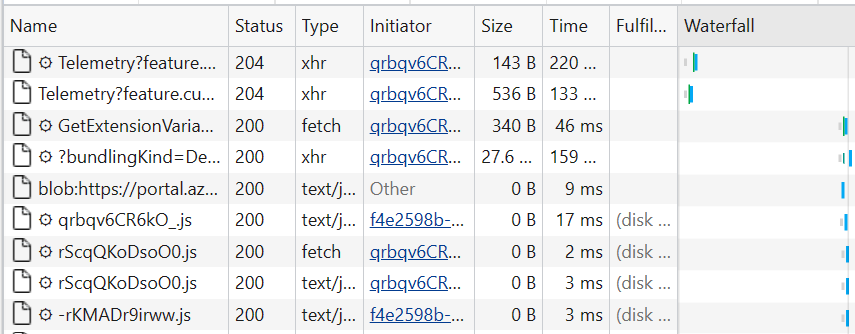
After you have reproduced the unexpected portal behavior, select Stop Recording network log, then select Export HAR and save the file.

Get help faster and easier
Quick links
On This Page
Legal Notices | Online Privacy Policy
Share this page
Language Navigation
How to generate HAR file
Article id: 205795, updated on:, issue/introduction.
This document intends to instruct how to generate a browser HAR file for:
- Internet Explorer
Environment
DX Platform
To generate the HAR file for Chrome:
- Open Google Chrome and go to the page where the issue is occurring.
- Look for the Vertical ellipsis button and select More Tools > Developer Tools.
- From the panel opened, select the Network tab.
- Look for a round Record button in the upper left corner of the tab, and make sure it is red. If it is grey, click it once to start recording.
- Check the box Preserve log.
- Click the Clear button to clear out any existing logs from the Network tab.
- Reproduce the issue that you were experiencing before, while the network requests are being recorded.
- Once you have reproduced the issue, right-click anywhere on the grid of network requests, select Save as HAR with Content , and save the file to your computer.
- Upload your HAR file to your ticket or attach it to your email so that our Support team can analyze it.
To generate the HAR file for Firefox:
- Open Firefox and go to the page where you are experiencing trouble.
- Select the Firefox menu (three horizontal parallel lines) at the top-right of your browser window, then select Web Developer > Network .
- The Developer Network Tools opens as a docked panel at the side or bottom of Firefox. Click the Network tab.
- The recording autostarts when you start performing actions in the browser.
- Once you have reproduced the issue and you see that all of the actions have been generated in the Developer Network Panel (should just take a few seconds), right-click anywhere under the File column, and click on Save all as Har .
- Save the HAR file somewhere convenient.
- Upload your HAR file to your ticket or attach it to your email so that we may analyze it.
To generate the HAR file for Internet Explorer:
- Open Internet Explorer and go to the page where the issue is occurring.
- Press F12 on your keyboard (or click the gear icon > F12 Developer Tools)
- Click the Network tab.
- Once done click the Save button.
- Give the trace a filename and click the Save button which will save it as a . har file or .xml file .
To generate the HAR file for Safari:
Before generating the HAR file, make sure you can see the Develop menu in Safari. If it is not there, follow the instructions online.
- Open the Develop menu and select Show Web Inspector .
- Click the Network tab and complete the activity that is causing issues.
- Click the Export icon on the far right of the network tab and save the HAR file.
- Send us the file via your support ticket.
To generate the HAR file for Edge:
Edge natively produces HAR files. For more instructions, see the instructions from the Microsoft website.
- Open the Network tool in F12 developer tools.
- Reproduce the issue.
- Export captured traffic as a HAR (CTRL + S).

- Open Q&A
- Automations
- Container platforms
- Cloud platforms
- Dashboarding
- Real User Monitoring
- Synthetic Monitoring
- Start with Dynatrace
- Dynatrace tips
- Troubleshooting
- Events and webinars
- Upgrade to SaaS
- Dynatrace API
- Dynatrace Managed Q&A
- Developer Q&A Forum
- Developer Blog
- Community user groups
- Community news
- Community challenges
- Community user guide
- Ask Moderators
- About the DynaMights
- Hall of fame
- Dynatrace Community
How to get HAR files for webviews?
- Subscribe to RSS Feed
- Mark as New
- Mark as Read
- Printer Friendly Page
- mobile monitoring

This browser is no longer supported.
Upgrade to Microsoft Edge to take advantage of the latest features, security updates, and technical support.
Capture a browser trace for troubleshooting
- 4 contributors
If you're troubleshooting an issue with the Azure portal, and you need to contact Microsoft support, you may want to first capture some additional information. For example, it can be helpful to share a browser trace, a step recording, and console output. This information can provide important details about what exactly is happening in the portal when your issue occurs.
Browser traces often contain sensitive information and might include authentication tokens linked to your identity. Please remove any sensitive information before sharing traces with others. Microsoft support uses these traces for troubleshooting purposes only.
You can capture this information any supported browser : Microsoft Edge, Google Chrome, Safari (on Mac), or Firefox. Steps for each browser are shown below.
Microsoft Edge
The following steps show how to use the developer tools in Microsoft Edge. For more information, see Microsoft Edge DevTools .
The screenshots below show the DevTools in Focus Mode with a vertical Activity Bar . Depending on your settings, your configuration may look different. For more information, see Simplify DevTools using Focus Mode .
Sign in to the Azure portal . It's important to sign in before you start the trace so that the trace doesn't contain sensitive information related to your account.
Start recording the steps you take in the portal, using Steps Recorder .
In the portal, navigate to the step prior to where the issue occurs.
Press F12 to launch Microsoft Edge DevTools. You can also launch the tools from the toolbar menu under More tools > Developer tools .
By default, the browser keeps trace information only for the page that's currently loaded. Set the following options so the browser keeps all trace information, even if your repro steps require going to more than one page.
Select the Console tab, select Console settings , then select Preserve Log .

Select the Network tab. If that tab isn't visible, click the More tools (+) button and select Network . Then, from the Network tab, select Preserve log .

On the Network tab, select Stop recording network log and Clear .

Select Record network log , then reproduce the issue in the portal.

You'll see session output similar to the following image.

After you have reproduced the unexpected portal behavior, select Stop recording network log , then select Export HAR and save the file.

Stop the Steps Recorder and save the recording.
Back in the browser developer tools pane, select the Console tab. Right-click one of the messages, then select Save as... , and save the console output to a text file.

Package the browser trace HAR file, console output, and screen recording files in a compressed format such as .zip.
Share the compressed file with Microsoft support by using the File upload option in your support request .
Google Chrome
The following steps show how to use the developer tools in Google Chrome. For more information, see Chrome DevTools .
Press F12 to launch the developer tools. You can also launch the tools from the toolbar menu under More tools > Developer tools .
By default, the browser keeps trace information only for the page that's currently loaded. Set the following options so the browser keeps all trace information, even if your repro steps require going to more than one page:

Select the Network tab, then select Preserve log .

The following steps show how to use the developer tools in Apple Safari on Mac. For more information, see Safari Developer Tools overview .
Enable the developer tools in Safari:
Select Safari , then select Preferences .
Select the Advanced tab, then select Show Develop menu in menu bar .

Start recording the steps you take in the portal. For more information, see How to record the screen on your Mac .
Select Develop , then select Show Web Inspector .

Select the Console tab, then select Preserve Log .

Select the Network tab, then select Preserve Log .

On the Network tab, select Clear Network Items .

Reproduce the issue in the portal. You'll see session output similar to the following image.

After you have reproduced the unexpected portal behavior, select Export and save the file.

Stop the screen recorder, and save the recording.
Back in the browser developer tools pane, select the Console tab, and expand the window. Place your cursor at the start of the console output then drag and select the entire contents of the output. Use Command-C to copy the output and save it to a text file.

The following steps show how to use the developer tools in Firefox. For more information, see Firefox Developer Tools .
Start recording the steps you take in the portal. Use Steps Recorder on Windows, or see How to record the screen on your Mac .
Press F12 to launch the developer tools. You can also launch the tools from the toolbar menu under More tools > Web developer tools .
Select the Console tab, select the Settings icon, and then select Persist Logs .

Select the Network tab, select the Settings icon, and then select Persist Logs .

On the Network tab, select Clear .

After you have reproduced the unexpected portal behavior, select Save All As HAR .

Stop the Steps Recorder on Windows or the screen recording on Mac, and save the recording.
Back in the browser developer tools pane, select the Console tab. Right-click one of the messages, then select Save All Messages to File , and save the console output to a text file.

- Read more about the Azure portal .
- Learn how to open a support request in the Azure portal.
- Learn more about file upload requirements for support requests .
Coming soon: Throughout 2024 we will be phasing out GitHub Issues as the feedback mechanism for content and replacing it with a new feedback system. For more information see: https://aka.ms/ContentUserFeedback .
Submit and view feedback for
Additional resources

IMAGES
VIDEO
COMMENTS
HAR file open in Microsoft Visual Studio Code 1. The purpose of the HAR format is to log the performance of web browsers, which allows developers to analyze how well the browsers are loading webpages. HAR files may be exported by various HTTP-related tools, such as Electron HAR, HttpWatch, HTTP Toolkit, but are typically exported by web browsers.
Once the page is loaded, right click and "Save All As HAR". Select the Console tab and right-click on in the console box. Select all and Copy Message Copy log messages to the preferred text editor. Upload the HAR and log files to the support ticket. How to generate a HAR and log file in Safari. Open Safari.
13. When you have the "Web inspector" visible in Safari and you're viewing the "Network" tab, the "Export" button at the top right will export a HAR file of the last loaded page. One thing to note, when I try to do this using a localhost server, "Export" is greyed out most of the time so I can't actually download a HAR.
Connect the iOS device to the Mac computer using a cable and make sure the iOS device is recognized. On the iOS device, launch Safari and reproduce the issue. Using the Mac computer, launch Safari, then click on Develop > Select the relevant iPad > Click on the session and that will open the developer tools. From here, export the HAR file.
How to record and send a HAR file on Chrome. 1. First, you'll need to go to the webpage where you saw the bug you are working on troubleshooting. 2. Next, in the Chrome menu, choose "View" → "Developer" → click on "Developer Tools". 3. You'll need to switch tabs inside the developer tools panel to the "Network" tab. 4.
Open Safari and navigate to the page where the issue is occurring. Note: This is tab and window dependent, so if the issue occurs in a new tab or window, the HAR recording needs to be done in that new tab or window. Click the Develop menu and select Show Web Inspector . If the Develop menu does not display in the menu bar, click the Safari menu ...
To open the developer console in Google Chrome, open the Chrome Menu in the upper-right-hand corner of the browser window and select More Tools > Developer Tools.You can also use Shift + ⌘ + C (on macOS), or Shift + CTRL + C (on Windows/Linux). In the Developer Tools panel, choose the Network tab. Check the "Preserve Log" and Disable ...
Open Google Chrome. Open the website which has an issue. Select the Chrome menu > More tools > Developer Tools. Select the Network tab. Refresh the page and allow Chrome to record browser website interaction. Once the page has loaded, right-click within network elements. Select "save har with content". Add HAR file to the support ticket.
Open the Network tool in F12 developer tools; Reproduce the issue; Export captured traffic as a HAR (CTRL + S) Upload your HAR file to your ticket or attach it to your email so that our Support team can analyze it; To generate the HAR file for Safari. Before generating the HAR file, make sure you can see the Develop menu in Safari.
The "Show Web Inspector" option will not be available until the user browses beyond Safari's home page. All credentials and session cookies within a HAR file should be removed before sharing with Carbon Black The HAR file is a text file, it can be opened in a text editor and searched for the SESSION cookie value and replaced with <REDACTED>
Ensure that Show Develop menu in menu bar checkbox is checked under Safari > Preferences > Advanced.. Choose File > Open New Private Window.. Choose Show Web Inspector in the Developer menu, then navigate to the Network tab.. To the right of All near the top-left of the Web Inspector, click the Filter button and choose Preserve Log.. Visit the web page where the issue occurs.
Right-click again and select Save all as HAR to save the file. Steps for Analyzing in Safari. In Safari, select Preferences, then Advanced, ... Free and Open Source HAR File Tools. HAR file tools can make a big difference in how quickly and easily you can analyze them. Tools can offer search, sorting, filtering, navigation, and other functions. ...
The Most Reliable way to replay har file is using a free tool like Fiddler, the tool is always free and can be downloaded quickly. The sites for the opening har file are all buggy and cannot open large files. ... Chrome now supports loading HAR files. Open Chrome, Press F12, Click on the Network Tab. Drag and drop the .har file DONE ! Share ...
How to generate a HAR file. ⚠️ Before sending the HAR file to Ansarada, ensure to remove/censor any sensitive information using a text editor (i.e. remove passwords, etc). Open Safari. In Safari, go to the webpage in question. Enable Developers Tool: Safari > Settings > Advance > Click Show Develop menu in menu bar (Afterwards close the window)
Generate a HAR file in Safari. If the Develop menu doesn't appear in the menu bar, go to SafariSettings. Click Advanced. Select Show Develop menu in menu bar. Close all private tabs and windows in Safari. Open a new private window. From the Develop menu select Show Web Inspector. Click the Network tab. Go to the page where the issue occurred ...
2. Identify and replace all sensitive information captured in the HAR file with a placeholder 3. Save HAR File . The following instructions provide the steps to generate a HAR file for troubleshooting. Open your browser. Press Option + Command + i to view the page. Select the Network tab. Reproduce the error; Select Export as HAR File.
Close all private windows in Firefox.. Open a new private window in Firefox.. Go to Tools > Developer > Network or ctrl-shift-E.. Click the Network tab and choose Persist Logs.. Visit the page and complete the steps that trigger the issue. Choose the Network tab and right click and then select Save All As Har.. Save the HAR file. After you save the file, you must remove sensitive information ...
Back in the browser developer tools pane, select the Console tab. Right-click one of the messages, then select Save All Messages to File, and save the console output to a text file. Package the browser trace HAR file, console output, and screen recording files in a compressed format such as .zip.
Safari To create a HAR file in Safari, follow these steps: Check the Safari menu bar at the top of the screen for a Develop menu. If not visible, turn it on by going to Safari → Settings → Advanced. Check the checkbox at the bottom next to Show Develop menu in menu bar. Go to the URL where the issue occurs. Do not reproduce the issue yet.
To generate the HAR file for Safari: Before generating the HAR file, make sure you can see the Develop menu in Safari. If it is not there, follow the instructions online. Open the Develop menu and select Show Web Inspector. Click the Network tab and complete the activity that is causing issues. Click the Export icon on the far right of the ...
Get the HAR file. Open Safari. From the top menu go to Safari > Develop. From there you should be able to select your device and your apps. Then you should be able to see your webrequest traffic for export. Use Inspect. The Inspect tool can be used for Android or iOS. You can follow the instructions from their website.
Right-click one of the messages, then select Save All Messages to File, and save the console output to a text file. Package the browser trace HAR file, console output, and screen recording files in a compressed format such as .zip. Share the compressed file with Microsoft support by using the File upload option in your support request. Next steps