Here's How You Traveled in 2023
By Matt Ortile

If you've traveled at all in the past year or so, you've likely noticed a fascinating collective energy moving through airports, on board trains, and across the ocean: excited, antsy, even a little bit frenzied. The anxious rebound from the travel restrictions of the pandemic were obvious everywhere you looked. Social media feeds were bursting with photographs of everyone in some faraway destination (most often Positano or Lake Como). In nearly every major publication, there were trend pieces about “revenge travel.” Even last year’s aviation fiascos like the meltdowns at Southwest Airlines and Amsterdam’s Schiphol Airport served to underscore the point: Everyone is traveling again.
All of the above was verified by the results of Condé Nast Traveler’s Readers’ Choice Awards 2023 , with one pleasant caveat: As frantic as our traveling in the past year appeared to be, most trips were actually about leisure, taking our time, finding relaxation, and using our vacation days. And bucket-list trips. A lot of you went on bucket-list trips. (What do you know that we don’t?)
For more of the highlights and takeaways from this year’s survey, read on. May they invite you to reflect on your own year in travel—and get excited for what’s to come next .

Nearly all of you are traveling for leisure again
After so many years defined by constraints and travel limitations, everyone had many different reasons over the past year to book a trip: about 69% of readers said they went to new-to-them places, and 47% said they returned to a familiar or favorite destination; 61% said they traveled internationally, and 39% said they took local trips. About 43% of respondents said they took trips to see family, but also—trend alert!—23% said they took solo trips, up from 14% in our 2021 survey , making good on their promises to hit the road on their own .
These days, you’re seeking rest and restoration
Speaking of rest, 75% of survey respondents used all of their vacation days in 2022. (Most Americans don't take enough of their vacation days , so this is nice to see.) Among our readers, 70% said they took trips with the goals of relaxation in mind; 28% specified that wellness was part of their travel intentions.
At the same time, many travelers hit the road (or the air, or sea) to celebrate the excitement of life. Adventure travel was big with 63% of our readers; 38% went on trips to commemorate birthdays, honeymoons, and other celebrations; and group trips among friends took up 38% of your travel. It’s true—there’s nothing like the euphoria of actually getting the entire group chat to Tuscany .
You’re traveling for longer periods of time—and more slowly
In 2022, survey respondents said that they wanted to maximize their future trips, whether by going to places they’d never been before or taking a long, long, long trip. According to this year’s results, that’s exactly what they did. Nearly two in three (65%) took a trip that lasted a week or longer, while 41% traveled for 11 days or more. Roughly one in four took trips lasting over two weeks.
Traveling for longer also meant you had more room for multi-destination itineraries (39% of respondents took such trips) or you prioritized traveling slowly. When asked about slow travel —that is to say, staying in a place for more days than usual with a focus on learning more about the people, culture, music, and food of that place—about 38% of respondents said they planned to take such a trip. Roughly half said they were intrigued by the idea, but had no plans to do it just yet.
You’re sneaking in travel however you can
Though you’re all traveling for longer, a great many of you are also sneaking in a cheeky little trip here and there however you can. Getaways were big with many of you in 2022: 51% of readers said they took weekend getaways , while 28% said they managed short, mid-week getaways. And 9% said they took remote work trips, fusing travel with the ability to work wherever they are.
You’re taking the bucket-list trips of your dreams
In 2022, 22% of survey respondents said they plan to take a once-in-a-lifetime trip. So many of you had great follow-through: about 36% of this year’s respondents said they took a bucket-list trip . After all we’ve been through since 2020, it’s plain to see that savvy travelers know that the present is a gift, that we should seize joy—and see the world—while we can.
What’s in store for 2024 (and beyond)
In the future, more and more of you may be hitting the high seas. Though only 27% of respondents took a cruise in 2022, many are cruise-curious and willing to book a ticket under certain circumstances. For more than half of respondents, the key factors will be about finding the right itineraries, schedules, and prices; 47% said they were interested in sailing on smaller ships—perhaps with Emerald Cruises, voted the best cruise line in our small ships category .
The intersection of travel and sustainability is a growing area of interest for 29% of those who took the survey. Those travelers say that they want to support local businesses (75% of respondents), eat at places that locally source food (60%), conserve water wherever possible (54%), and avoid single-use plastics (54%).
As for the rest of the year and beyond? At the time of the survey, three in four respondents said they have two or more trips booked for the rest of 2023; 10% even said they had seven or more already planned. And though their travel calendars for 2024 were relatively open—only 34% said they have one, two, or three trips booked for next year—there's still plenty of time to book.
Need some inspiration? Review the winners of our Readers’ Choice Awards in 2023: pick one of the best cities in the world to visit; the best spa resorts , if you need a wellness retreat; or the best islands if you need a sunny and sandy getaway—and start planning how you’ll get there. And remember: Use your vacation days.
For more of our Readers’ Choice Awards, see all the survey results here .
By signing up you agree to our User Agreement (including the class action waiver and arbitration provisions ), our Privacy Policy & Cookie Statement and to receive marketing and account-related emails from Traveller. You can unsubscribe at any time. This site is protected by reCAPTCHA and the Google Privacy Policy and Terms of Service apply.

Welcome to the FTA research library. We are happy to have you visit.
Fta members have free access to all fta research reports. log in to download research below ., nyu-fta 2023 annual us family travel survey.
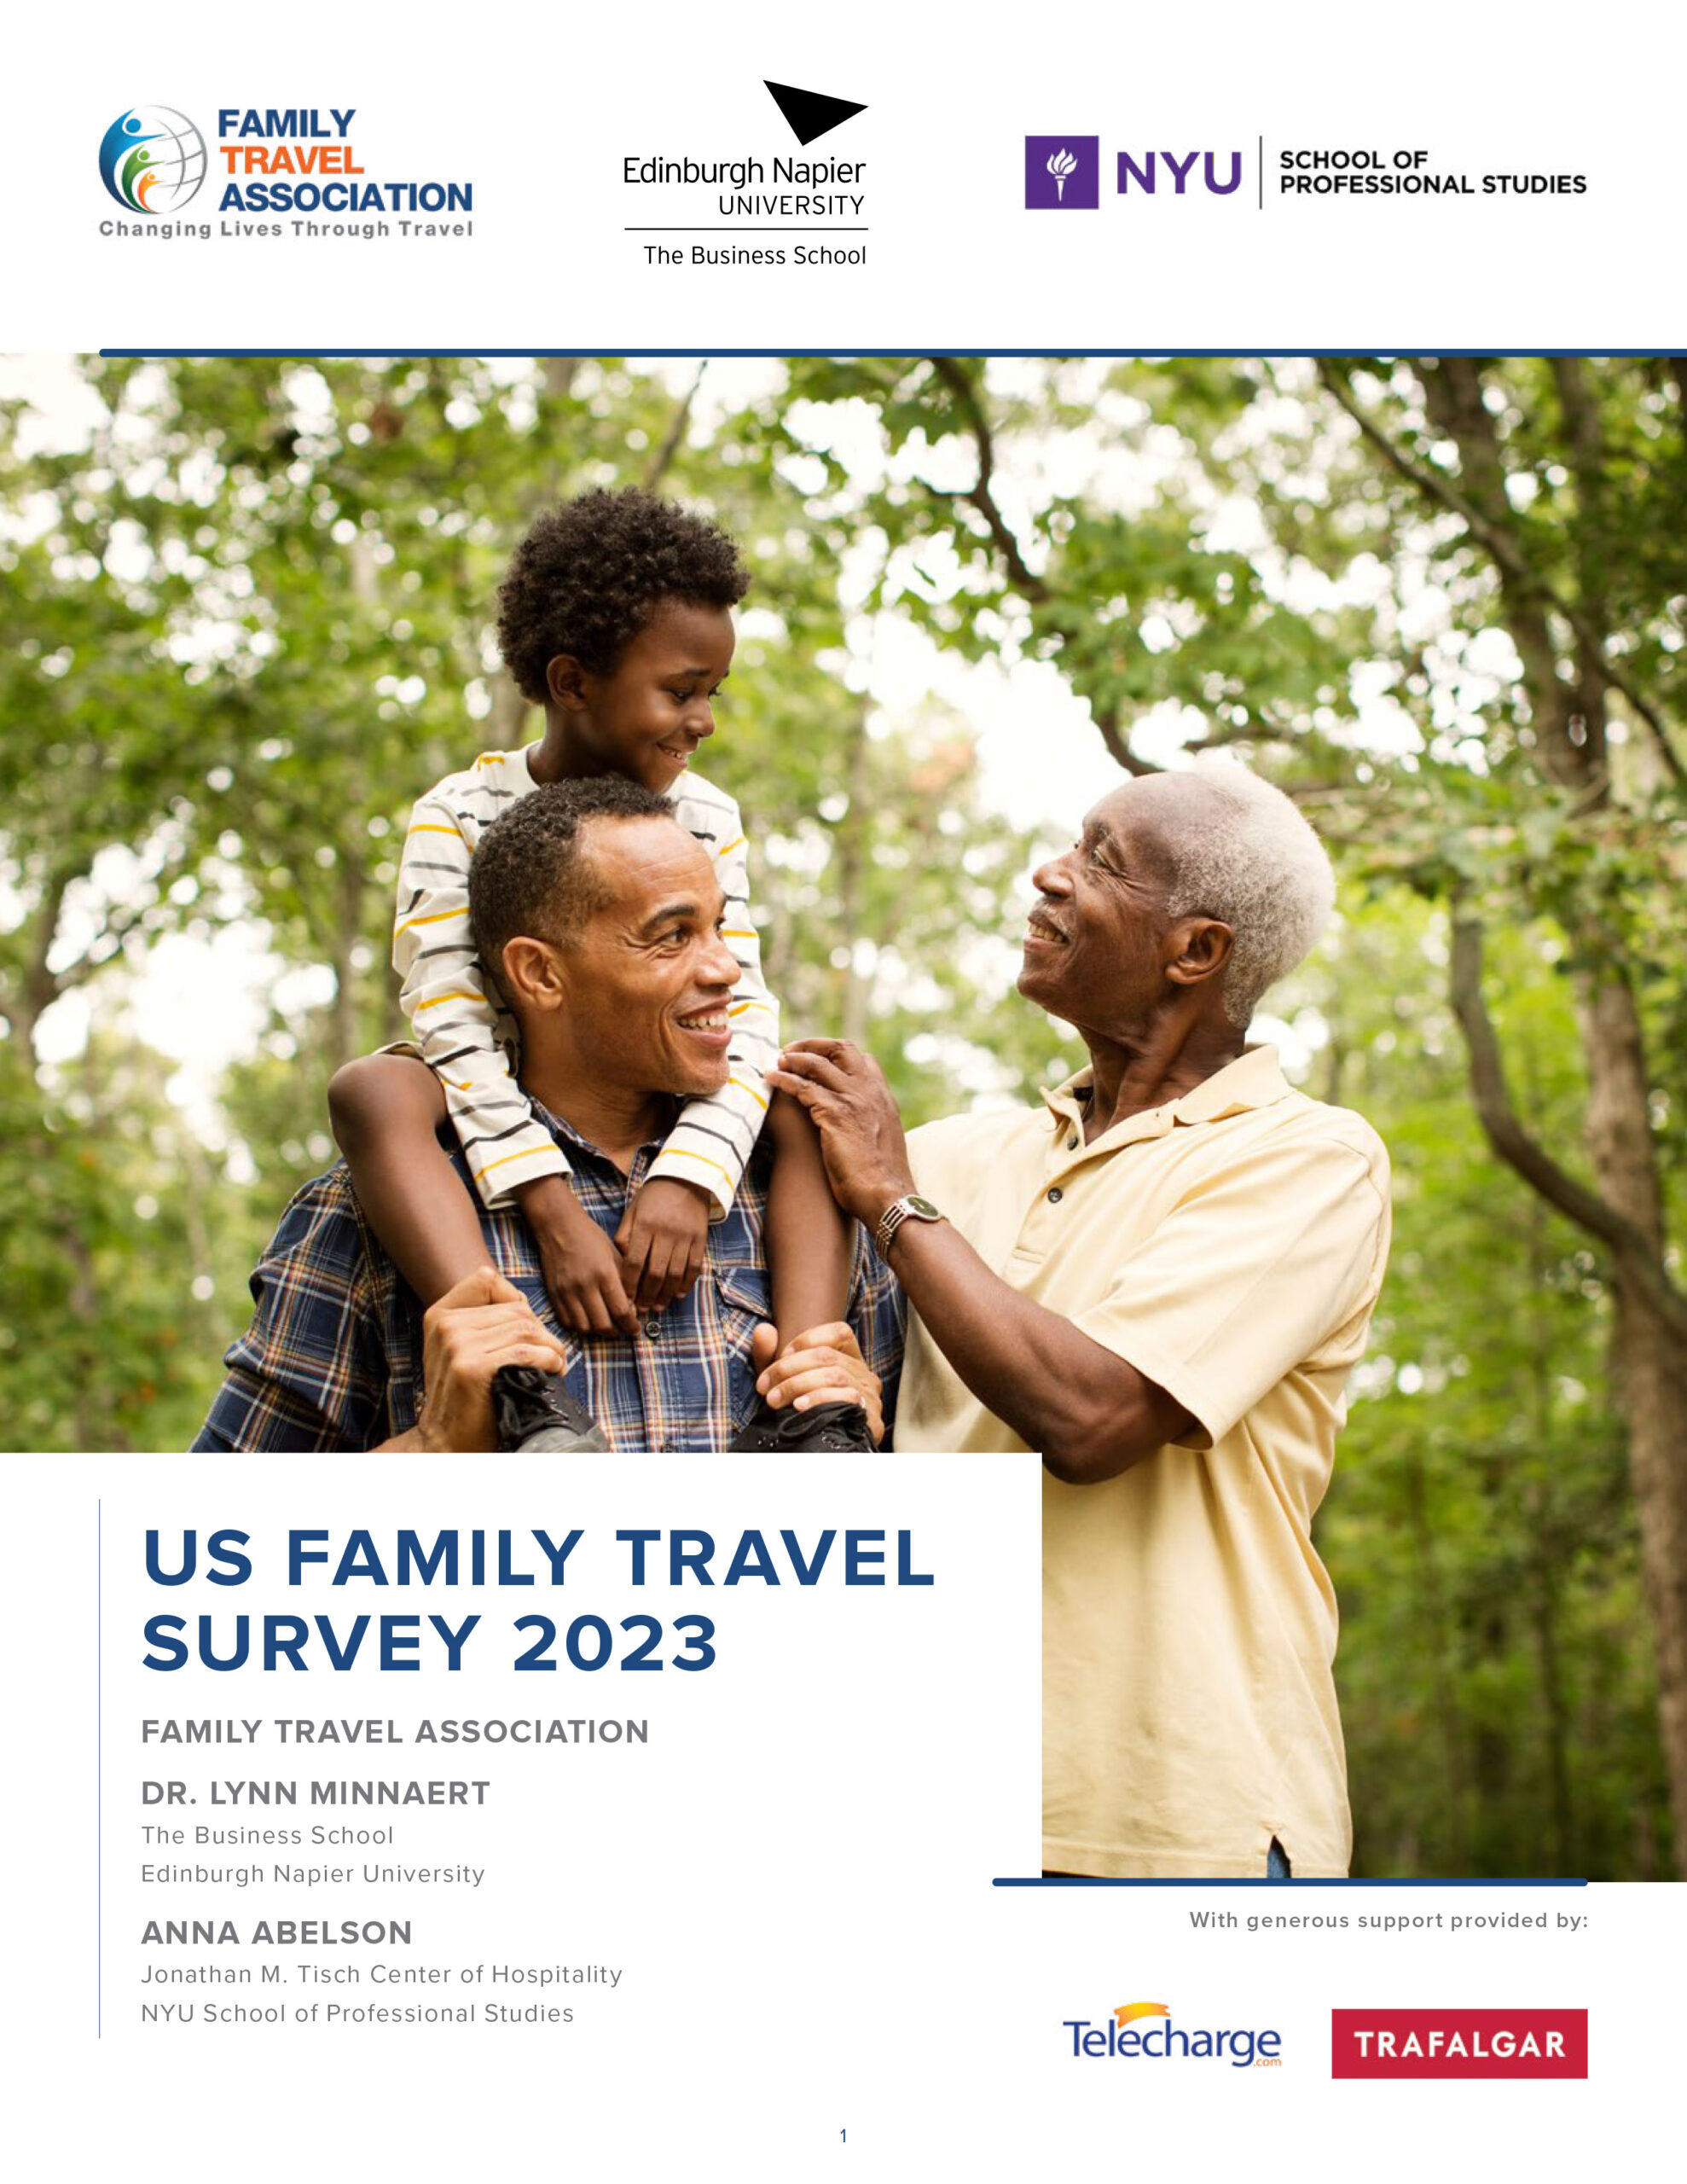
Become an FTA member to download the 2023 survey results free of charge. Otherwise, email us to purchase the report for $250.
Industry Membership Media Membership Travel Advisor Membership
Members Download Free
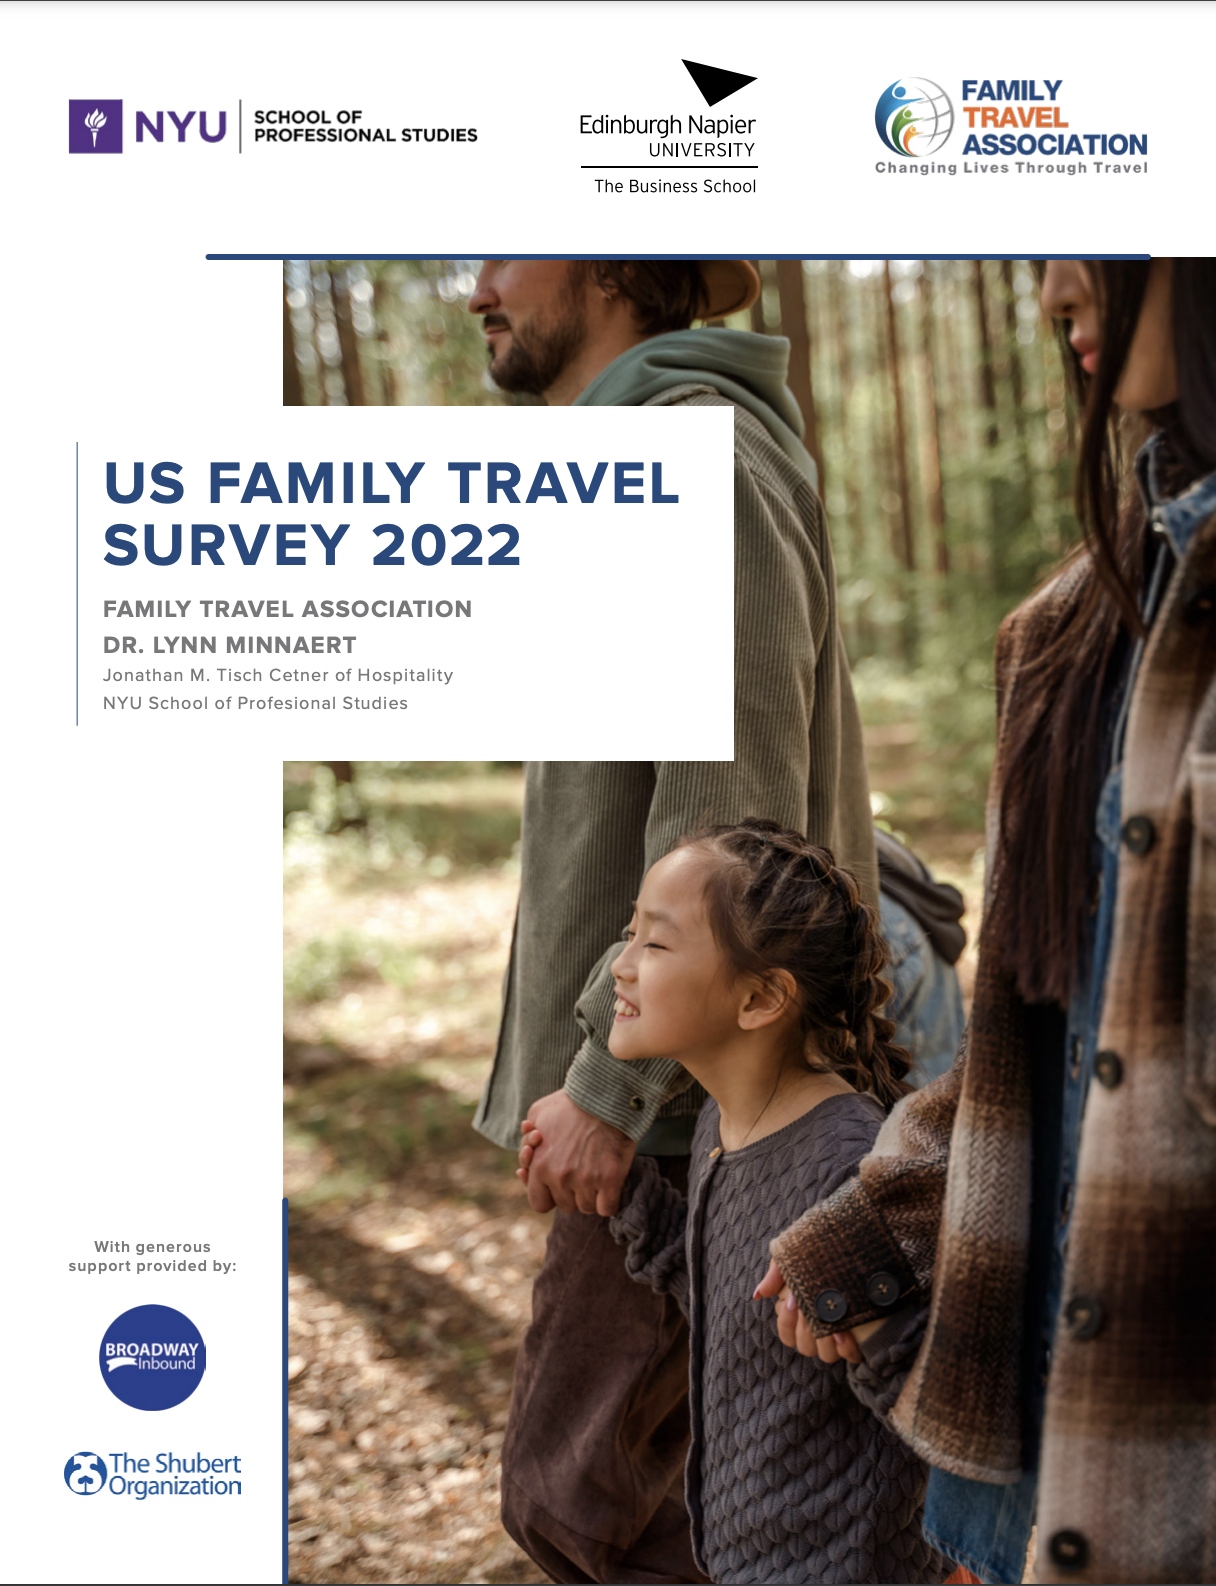
Become an FTA member to download the 2022 survey results free of charge. Otherwise, email us to purchase the report for $250.
NYU-FTA 2021 Annual Consumer Family Travel Survey Report
2020 Family Travel Planning Survey: Chase Marriott Bonvoy Bold

NYU-FTA Annual Consumer Family Travel Studies
Meet the Board: Jenn Lee
Jenn Lee, Travel Planners International’s VP of Industry Engagement and Support, isn’t shy about her obsession for guiding and leading today’s entrepreneurial-minded travel advisor community. So, it was a natural fit for her to join the board o

Meet the Board: Stephanie Lee
Stephanie Lee is the founder of Host Agency Reviews (HAR), a website that connects over 70k visitors a month to travel industry resources. HAR helps people looking to join the travel industry the roadmap to successfully start and grow their travel ag

Meet the Board: Tamara Gruber
A former marketing executive, Tamara Gruber launched We3Travel.com in 2013 to share her passion for family travel. Now a travel writer and podcaster based in New England, Gruber works to make it easier for others to plan vacations by providing de

Trends in the Family Market Recap
Recently, the Family Travel Association presented an hour-long Lunch & Learn webinar covering the latest Trends in the Family Market, hosted by three experts in the industry. Here are just a few key highlights from the full discussion, which is a

Meet the Board: Karlene Angus-Smith
Karlene Angus-Smith has been with Sandals’ Unique Vacations since September 2002, working her way up over the years to her current role as Associate Director of Industry Affairs. Her new position allows her to work along with the Director of Indust

FTA Member Spotlight: Family Travels and Adventures
Kristin Luz has been traveling her entire adult life, so it only made sense to help others do the same. From trekking the Inca Trail to sailing on a 50-foot yacht in Greece and visiting village markets in Morocco, Luz and her family have done and see

2023 US Family Travel Survey Results
The 2023 Family Travel Association annual family travel survey highlights post-pandemic trends, positive attitudes and opportunities for growth. Today, the Family Travel Association released findings from its 2023 U.S. Family Travel Survey on family

Why Cruise Lines Make For the Perfect Family Trip
There are a lot of benefits to working with the largest cruise line in the world, especially for families. As of May 2023, Carnival Cruise Line operates a fleet of 25 ships, with another in the works, across 15 different home ports spread across the

FTA Member Spotlight: Il Viaggio Travel
Sustainability, accessibility, education—Il Viaggio Travel does it all. While based in Costa Rica, “Il Viaggio” is actually Italian for “travel,” inspired by co-founder Stephanie Sheehy’s family and heritage. The initial hope was to draw

Welcome to the Family: Discover DeKalb
Just outside of Atlanta, Georgia lies a haven for family travel. North of the downtown area, Discover DeKalb—a new FTA member—represents a group of cities and towns with a hugely diverse selection of travel offerings. Michael Vescio, Director of

Lunch & Learn Recap: Cowboy-Cations
Every few weeks, the Family Travel Association is hosting a 30-minute virtual Lunch & Learn with suppliers, industry experts and panel discussions. Being an FTA member, you can not just attend these webinars, but also access the recordings at any
safetravelRX: 24/7 Peace of Mind
Would you know how to call for an emergency responder in Italy? Could you find a pharmacist in Egypt that speaks English? What about the latest health guidelines in Costa Rica? Even if you’re a seasoned traveler, you can’t account for every situa
- Skift Research
- Airline Weekly
- Skift Meetings
- Daily Lodging Report
2022 Travelers: A Multi-Country Survey Report
Haixia Wang + Skift Team
Report Overview
The disruption of the pandemic means not only less travel, but also different travel. How have people traveled in the past two years? What are the changes? Will the changes last when the pandemic is over? And what are the new inspirations for people when they can finally travel freely again?
We conducted our 2022 Traveler Survey to understand these crucial questions as we prepare for a full travel recovery. We surveyed travelers from five major tourism markets —the U.S., UK, Australia, China and India—to get a global perspective, especially given the varying levels of travel restrictions and governmental and individual responses during the past two years.
This data-intensive report presents and analyzes the findings from this survey, delving into all major components of the global tourism industry—outbound travel, accommodation, transportation, destination, and tourism activities. For each component, we reveal key trends pre-, during-pandemic and explore potential changes and shifts post-pandemic, from both global and country-specific perspectives.
What You'll Learn From This Report
- Economic Outlook
- Travel Rate, Frequency and Purpose
- Outbound Travel Trends and Shifts
- Accommodation Types and Shifts
- Transportation Types and Shifts
- Destination Considerations and Shifts
- Activity and Inspiration Trends and Shifts
Related Reports
- Tying the Knot Abroad: Market Sizing Indian Wedding Tourism April 2024
- Navigating Q4 2023: Analysing the Value of Travel Credit Cards in the U.S. February 2024
- Skift Research Global Travel Outlook 2024 January 2024
- Exploring Gen Z and Millennial Travel Habits January 2024
Want to read this report?
Get access to this report when you subscribe.
- 3+ new reports per month
- Access to 200+ reports
- Analyst Q&As through email
- 25% off tickets to Skift Forum events
- Quarterly analyst report review calls
- High resolution PDFs of new reports as they're released
- Hotels & Resorts
- Travel Guides
- Credit Cards
- Airplane Seat Switch Etiquette
- American Airlines Baggage Fees & Allowance
- Amex Centurion Lounges
- Best & Worst Days to Fly
- Best & Worst Days to Fly & Travel for Christmas & New Year's 2024
- Best & Worst Times to Fly
- Best Days & Times to Book Flights
- Best Seats On a Plane
- Best Websites to Book Cheap Flights
- Capital One Lounges
- Chase Sapphire Lounges
- Delayed, Lost, or Damaged Luggage (Steps to Take)
- Delta Baggage Fees & Allowance
- How to Avoid Airline Flight Delays & Cancellations in 2024
- How to Cancel an American Airlines Flight
- How to Cancel a Delta Air Lines Flight
- How to Earn Delta SkyMiles
- How to Earn United MileagePlus Miles
- How to Find Cheap Flight Deals
- How to Find Cheaper Summer Flights for 2024
- How to Get Through TSA Airport Security Faster
- How to Use Google Flights
- When to Book Christmas Flights - Best Travel Days for 2024
- When to Book Thanksgiving Flights - Best Travel Days for 2024
- United Airlines Baggage Fees & Allowance
- What to Do if Your Airline Cancels or Delays Your Flight
- Worst Seats on a Plane
- Best Atlanta Airport Car Rental Companies
- Best Denver Airport Car Rental Companies
- Best Los Angeles Airport (LAX) Car rental Companies
- Best Miami Airport Car Rental Companies
- Best Orlando Airport Car Rental Companies
- Best Phoenix Airport Car Rental Companies
- Best Websites to Book Cheap Car Rentals
- How to Find Cheap Car Rentals
- Best All-Inclusive Cruise Lines
- Can You Bring Food, Alcohol, & Snacks on a Cruise Ship?
- Best Websites to Book Cheap Cruises
- Where Can I Cruise Without a Passport?
- What is Cruise Ship Tendering?
- What is Port Side on a Cruise Ship?
- Best Economy & Budget-Friendly Hotel Brands
- Best Mid-Tier Hotel Brands
- Best Websites to Book Cheap Hotels
- Choice Privileges Loyalty Program Review
- Hilton Honors Loyalty Program Review
- Hostel Booking Tips
- Hotels.com Booking Guide
- How to Find Cheap Hotel Deals
- IHG One Rewards Loyalty Program Review
- Marriott Bonvoy Loyalty Program Review
- World of Hyatt Loyalty Program Review
- Wyndham Rewards Loyalty Program Review
- Best Travel Products
- Destinations
- Family Travel
- Beach Vacation Packing List
- Best Beaches in Florida
- Best Ticket Websites for Tours & Activities
- Best Travel Tips
- Global Entry Program Guide
- How to Check Your Passport Application Status
- How to Make a Travel Budget
- How to Take Your Own Passport Photo at Home
- Passport Processing Times - Current Wait in 2024
- Summer Travel Survey & Trends 2024
- Sustainable Travel Survey 2023
- TSA PreCheck Program Guide
- Travel Insurance Buying Guide
- Ultimate Travel Packing List
- Travel Credit Card Reviews
- Travel Credit Card Strategies & Tips
- Amex Platinum Card Benefits
- Amex Gold Card Benefits
- Best Starter Travel Credit Cards for Beginners
- Capital One Venture Card Benefits
- Capital One Venture X Card Benefits
- Chase Sapphire Preferred Card Benefits
- Chase Sapphire Reserve Card Benefits
- How to Use CardMatch
- Ink Business Unlimited Card Benefits
Get The Vacationer Newsletter
Get highlights of the most important news delivered to your email inbox
Advertiser Disclosure
Amazon Affiliate Disclosure : Jones-Dengler Marketing, LLC via The Vacationer is a participant in the Amazon Services LLC Associates Program, an affiliate advertising program designed to provide a means for us to earn fees by linking to Amazon.com and affiliated sites. As an Amazon Associate we earn from qualifying purchases. Amazon and the Amazon logo are trademarks of Amazon.com, Inc. or its affiliates.
The Vacationer • Travel Guides • Travel Surveys
Sustainable Travel Survey 2022 — 87% Say It’s Important, 82% to Make More Eco-Friendly Travel Decisions, 78% Pay More to Lower Carbon Footprint

Update – See our new 2023 Sustainable Travel Survey and compare the results to this article’s 2022 results.
We are now less than a month away from Earth Day 2022. Our Summer 2022 Travel Survey revealed 81% plan to travel this summer. And, nearly 51% intend to fly on a plane. 42% of American adults even say they will travel more than last year. With COVID restrictions fading and more people eager to vacation, we wanted to turn our focus back to sustainable travel.
Since Earth Day is around the corner, we conducted this 2022 Sustainable Travel Survey to gauge Americans’ sentiment to lowering their carbon footprint with travel. We wanted to know if more people are worried about sustainable vacation measures than when we conducted our 2021 survey . How important is sustainable travel to Americans? Would people be willing to spend more money to reduce their carbon footprint when they take a trip? How much thought do Americans put into sustainable travel? Please read below to find out answers to these questions and more.
Table of Contents
How important is sustainable travel (environmentally friendly) to you?
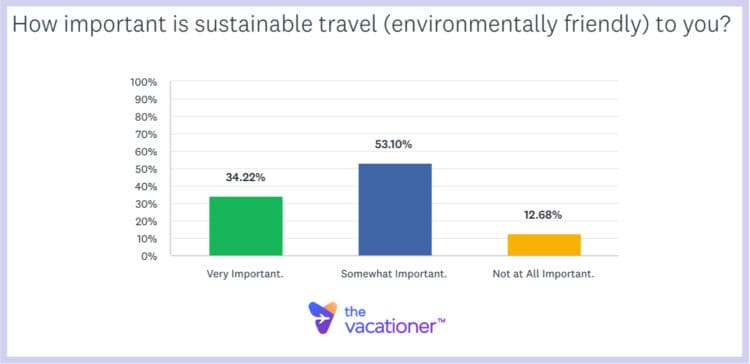
Photo: Eric Jones screenshot via SurveyMonkey
Let’s take a look at the survey results:
- Very Important. — 34.22%
- Somewhat Important. — 53.10%
- Not at All Important. — 12.68%
Interesting Demographic Comparison — American adults in the Middle Atlantic region are the most likely to say sustainable travel has at least some importance to them. 93.06% of people in this region said environmentally friendly travel is somewhat important or very important to them. The Middle Atlantic region contains the states of New York, New Jersey, and Pennsylvania.
Key Takeaway — More than 87% of American adults say sustainable travel is either Somewhat Important or Very Important to them. The 87.32% represents nearly 225 million people based on the current census . This is 4.65% more people than in our 2021 sustainable travel survey. 4.65% may not seem like a lot, but it represents nearly 12 million which is quite substantial. Many more people are becoming aware of sustainable travel methods and find it important to them. Additionally, 34.22% of people say sustainable travel is very important to them this year. Last year only 26.10% said it was very important to them which equates to a nearly 24% increase in people saying sustainable travel is very important.
The Vacationer Tip
Don’t forget to leverage your credit card to save money when buying sustainable travel for Earth Day. If you do not have a travel-rewards credit card, our highest recommendations are the Chase Sapphire Preferred® Card , the Capital One Venture X Rewards Credit Card , and the Citi Premier® Card . If you would like to see other offers, Click to See All of Our Recommended Travel Credit Cards .
Do you intend to make more sustainable (eco-friendly) decisions when planning travel?
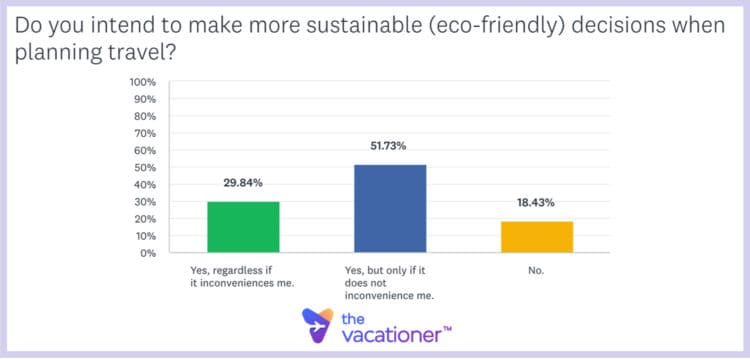
- Yes, regardless if it inconveniences me. — 29.84%
- Yes, but only if it does not inconvenience me. — 51.73%
- No. — 18.43%
Interesting Demographic Comparison — The youngest generation of American adults aged 18-29 is most likely to make more sustainable decisions when planning travel. 92.31% of people in this age group said that. On the other hand, the oldest generation of American adults over 60 is the least likely to make more sustainable decisions when planning travel. Only 76.3% of those over 60 intend to do this.
Key Takeaway — Nearly 82% of American adults say they intend to make more eco-friendly decisions when planning travel. The 81.57% includes the 29.84% that says they will do it regardless if it inconveniences them. Also, it includes the 51.73% of American adults that say they will do it only if it does not inconvenience them. In total, the 81.57% represents 210 million people. It is also 6.72% or over 17 million more people than said they intend to make more sustainable travel choices last year.
Which factor is most important to you when booking travel?
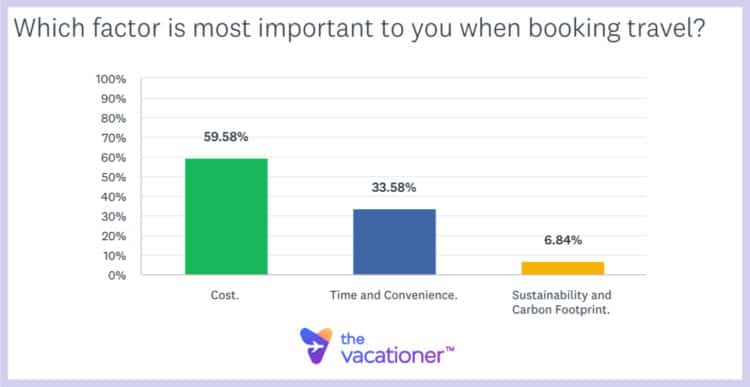
- Cost. — 59.58%
- Time and Convenience. — 33.58%
- Sustainability and Carbon Footprint. — 6.84%
Interesting Demographic Comparison — Women are more likely than men to say cost is the most important factor when they book travel. 64.84% of women said cost was most important while only 53.82% of men did. On the other hand, men are more likely to say time and convenience are most important to them when booking travel. 39.14% of men said this while only 28.47% of women did. Men and women have a similar importance opinion on sustainability and carbon footprint.
Key Takeaway — Nearly 7% of American adults say sustainability and carbon footprint is the most important factor when booking travel . The 6.84% may seem like a small figure, but it still represents nearly 18 million people. Additionally, the 6.84% is a 36% increase from 2021 when only 4.38% of American adults said sustainability and carbon footprint was the most important factor.
How much more would you be willing to spend on your vacation in order to lower your carbon footprint from the trip?
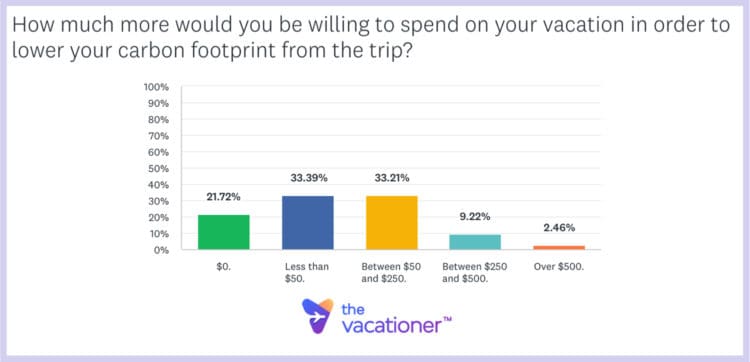
- $0. — 21.72%
- Less than $50. — 33.39%
- Between $50 and $250. — 33.21%
- Between $250 and $500. — 9.22%
- Over $500. — 2.46%
Interesting Demographic Comparison — People in the Middle Atlantic region of New York, New Jersey, and Pennsylvania are most likely to say they will pay more for a vacation to lower their carbon footprint. 84.39% of people in the Middle Atlantic region said this. This shouldn’t be surprising as the Middle Atlantic region also was the one that was most likely to say sustainable travel was important to them. The East South Central region contains the Americans least likely to spend more money to reduce their carbon footprint when traveling. Only 72.06% of people in this region said they would. The East South Central region is made up of the states Kentucky, Tennessee, Alabama, and Mississippi.
Key Takeaway — Over 78% of American adults would pay more for a vacation to lower their carbon footprint. The 78.28% represents 202 million people. It also is more than the 71.37%, or 184 million people, that said they would pay more for a vacation last year. Additionally, 11.68% of American adults or 30 million people said they would spend $250 or more to lower their carbon footprint when traveling. Also, 2.46% or more than 6 million Americans said they would spend over $500! Earth day is going to be more important than ever as more and more people are prepared to fight climate change.
Do you think there are enough sustainable travel options when it comes to flights, hotels, and rental cars?
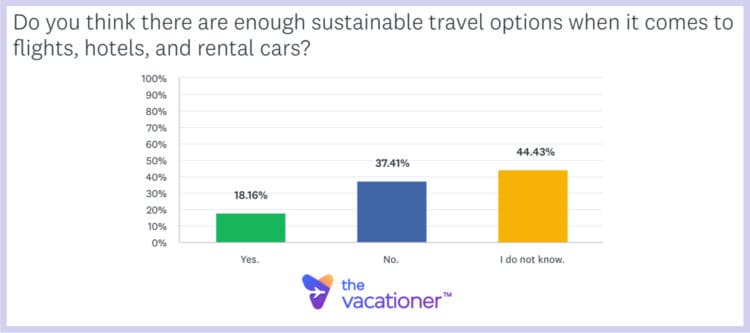
- Yes. — 18.16%
- No. — 37.41%
- I do not know. — 44.43%
Interesting Demographic Comparison — Women are less likely than men to think that there are enough sustainable travel options. Only 15.95% of women think there is enough while 20.55% of men think there are enough sustainable travel options for flights, hotels, and rental cars. Women are also more likely to say they simply do not know. 47.68% of women said they do not know while only 40.70% of men did.
Key Takeaway — More than 37% of people do not think there are enough sustainable travel options when it comes to flights, hotels, and rental cars. Another 44.43% of people do not know. This means 81.84% either think there are not enough sustainable travel options or simply do not know. The 81.84% represents 210 million people. This is a large portion of people thinking there are not enough sustainable options or not knowing if there is. As Earth Day approaches, it’s time for us as a society to continue to produce more sustainable options and to educate the public.
Do you go out of your way to find sustainable travel options by using filters like “low emissions” when searching for flights or other similar filters for hotels and rental cars?
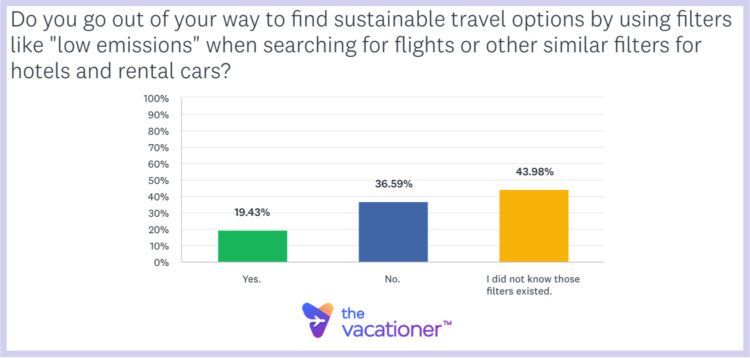
- Yes. — 19.43%
- No. — 36.59%
- I did not know those filters existed. — 43.98%
Interesting Demographic Comparison — The younger generations are more likely to go out of their way to find sustainable travel options. 23.08% of American adults aged 18-29 say they do this. And, 25.94% of American adults aged 30-44 say they do. On the other hand, only 18.02% of those aged 45-60 do. And, only 10.37% of American adults over age 60 say they go out of their way to find sustainable travel options.
Key Takeaway — Nearly 2 out of every 10 American adults say they go out of their way to find sustainable travel options . The 19.43% equates to 50 million people. 50 million people intentionally using filters to find sustainable travel options is a substantial amount. 43.98% of Americans also do not even know these filters exist. If the public were more educated about these filters and sustainable travel options, we would likely see a very large increase in people using them.
How careful are you with water and energy usage while in a hotel or Airbnb compared to at home? (e.g. Do you turn off lights and fans when not using them?)
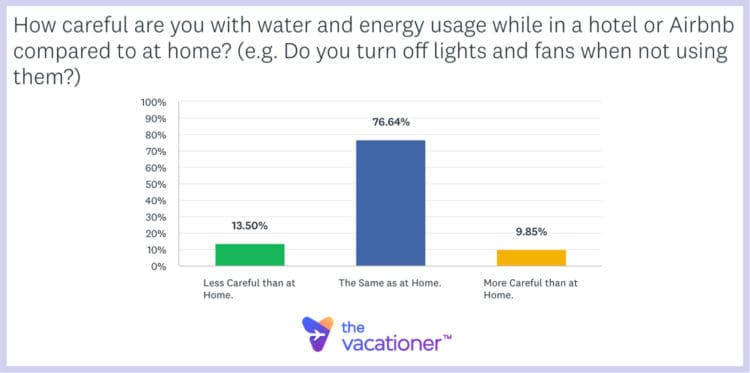
- Less Careful than at Home. — 13.50%
- The Same as at Home. — 76.64%
- More Careful than at Home. — 9.85%
Interesting Demographic Comparison — The youngest generation of American adults aged 18-29 are more likely to be less careful than at home with energy usage in a hotel or Airbnb. 18.55% of Americans in this age group said this which is much higher than the average. On the other hand, American adults over 60 are the least likely to be less careful than at home. This makes sense as the older generations tend to be much more respectful of others’ belongings.
Key Takeaway — 13.50% of American adults or 35 million people say they are less careful than at home when it comes to energy usage at a hotel or Airbnb. On the other hand, 9.85% or 25 million people say they are more careful than at home. It is upsetting to see that more Americans are less respectful of other peoples’ property and energy.
Survey Methodology
This 2022 Sustainable Travel Survey was conducted by SurveyMonkey on behalf of The Vacationer. In total, 1,096 Americans over the age of 18 were polled on March 1. Of those surveyed, 46.71% were male and 53.29% were female. The age breakdown of participants included in this survey was 20.20% in the range 18-29, 29.25% in the range 30-44, 25.87% in the range 45-60, and 24.68% over 60. This survey has a confidence level of 95% and a margin of error of ±3.026%. You can learn more about SurveyMonkey’s sampling method by clicking here .
The questions were chosen and the results were analyzed by the post author, Eric Jones, who is a Mathematics and Statistics Professor at Rowan College South Jersey .
Editorial Disclosure: Opinions expressed here are the author’s alone, not those of any bank, credit card issuer, hotel, airline, or other entity. This content has not been reviewed, approved, or otherwise endorsed by any of the entities included within the post.

By Eric Jones
Eric Jones is the co-founder and head of operations of The Vacationer. He uses his background in mathematics as a professor at Rowan College South Jersey to conduct statistical studies and surveys on traveling and vacations. Having traveled to all 50 states and over 30 countries, Eric is well-equipped to recommend travel destinations and new adventures to those seeking lifetime experiences.

Summer Travel Survey 2022 — Nearly 81% to Travel, 42% to Travel More than Last Summer, Nearly 51% to Fly on a Plane, 80% to Road Trip

Russia-Ukraine Conflict Travel Survey — 40% to Reconsider 2022 Travel Plans, 36% of Americans Feel Less Safe Traveling Since Russia’s Invasion

Sustainable Travel Survey 2021 – Importance & Sentiment to Fight Climate Change When Booking Travel
What you need to know about coronavirus. Stay informed.
Coronavirus updates
Personal Memberships
- Travel Services Rescue, medevac, advisory & security
- TotalCare Telehealth Travel services membership plus telehealth
- Business Travel Risk Mitigation For businesses, universities & associations
- Duty of Care Intelligence, medical & security management
- New GRID 2.0 Travel intelligence & tracking platform
Partners & Affiliates
- Become a Partner For outfitters, guides and other travel associations
- Become An Affiliate For bloggers, educators and other content creators
- Partner Login
- Blog Travel tales + tips
- Travel Intelligence Center Advisories + alerts
- News & PR Global Rescue news
Categories:
August 26, 2022
Share This:

Survey Says: Travel No Matter What
Global Rescue members — the world’s most experienced travelers — have definite ideas about their travel and are forging ahead with their plans. Here’s a roundup of the results from the Global Rescue Summer 2022…
Global Rescue members — the world’s most experienced travelers — have definite ideas about their travel and are forging ahead with their plans. Here’s a roundup of the results from the Global Rescue Summer 2022 Traveler Safety and Sentiment Survey.
The return to the travel world has been a roller coaster. There are the ups of more countries welcoming visitors, fewer COVID protocols and fewer hospitalizations – and the downs of the BA.5 variant, airline disruptions and the rising cost of travel.
But Global Rescue members — the world’s most experienced travelers — have definite ideas about their 2022-2023 travel and are moving ahead and forging plans to overcome travel barriers. Here’s a roundup of 2,100 responses from the world’s most experienced travelers who shared their answers about travel in the Global Rescue Summer 2022 Traveler Safety and Sentiment Survey.
Travel Inflation
Inflation is having a minimal impact on travel: 79% report inflation won’t cause them to cancel their travel plans.
In fact, 21% plan to spend more time and money on trips to make up for curtailed travel due to the pandemic.
“Travelers are sending a clear message. They are eager to return to family vacations, adventure travels and business trips,” said Dan Richards, CEO of Global Rescue and a member of the U.S. Travel and Tourism Advisory Board at the U.S. Department of Commerce. “By overwhelming margins, they are pressing forward with international and domestic travel despite rising costs and airline staff shortages. They are confident they’ll be able to travel and return home.”
[Related Reading: How to Beat Travel Inflation ]
Travel Is Happening
Sixty-eight percent of survey respondents have already traveled internationally since the pandemic. The balance expects to travel abroad by the end of the year (16%) or in the first three months of 2023 (9%).
The numbers have been rising consistently for more than a year. The Spring 2022 Global Rescue Traveler Safety and Sentiment Survey found more than half of the respondents (56%) have traveled internationally since the pandemic, a 33% increase compared to the Winter 2021 survey.
Global Rescue member Nate Bennett and his wife made multiple international trips; two to Costa Rica in the summer of 2021 and another trip to Botswana in 2022.
“We are vaccinated and happy to wear a mask,” he said. “Costa Rica is very careful, especially in the tourist industry, and you live basically 24×7 outdoors. It felt safe there — which is why we went back a second time just two months later.”
Industry Challenges
Staff shortages among pilots, flight attendants, gate agents and ground crews — a new challenge disrupting summer travel — are affecting travel schedules, but the majority of our survey respondents (58%) have not been touched by it.
Cruising Returns
Cruises are back on the travel list, too. Forty percent of respondents have already taken a cruise since the pandemic started or, if they haven’t, they plan to this year. Nearly a quarter (23%) of respondents feel much safer or safe enough to cruise compared to only 19% of respondents earlier this year.
COVID Concerns
After two years of pandemic-related travel restrictions, a third of survey respondents continue to experience “re-entry” to travel anxiety with worries about where to go, or when to get back to travel.
The biggest international travel fear is testing positive for COVID and being stranded away from home. The good news is that fear is declining. A third of respondents (33%) listed this fear as the most concerning but it represents a 37% decrease from early 2022.
“‘ What if I get COVID? ’ is a top question we get when fielding inquiries,” said Jenna Chase, director of operations for Ubuntu Travel , a travel agency specializing in luxury, bespoke African safari tours. “Travelers want to know what to expect and what they need to do if it happens to them.”
But fear isn’t cancelling travel plans. Despite reports of the latest COVID-19 variant, BA.5, generating waves of reinfections and single-digit increases in U.S. hospitalizations, nearly 80% say the threat of a new COVID variant is unlikely to make them cancel or postpone international travel this year.
“Whether it is revenge travel or responsible travel following vaccination — or a combination of both —travelers feel safe enough to plan trips and vacations because they’re vaccinated, borders are open and they have confidence they’ll be able to get home if the worst happens,” Richards said.
Impact of the Russia-Ukraine Conflict
Other travel concerns include:
- Having an accident (24%)
- Trip cancellation (21%)
- Civil unrest/terrorism (8%)
- Being robbed, war, natural disasters and difficulty finding a COVID-19 testing facility (2% each)
The majority of travelers (60%) report some level of concern about international travel since the beginning of the Russia-Ukraine war. While 90% have not changed their travel plans due to the war, more than a third are buying security evacuation protection as an additional precaution.
But for trips to Eastern Europe, the opposite is happening. More than half of travelers (58%) who planned or were planning a trip to Russia, Ukraine or any other country in Eastern Europe report the Russia-Ukraine conflict caused them to cancel or postpone travel to those areas. The data represents a 28% jump in the share of travelers canceling or postponing trips to the region compared to survey responses collected early this year.
[Related Reading: Is It Safe to Travel to Europe Now? ]
Making Travel Possible
The pandemic has generated a tectonic shift in the traveler mindset. The majority of travelers (64%) say medical evacuation services are more important than Cancel For Any Reason (18%) insurance or traditional travel insurance (15%).
“Travelers learned emergency rescue and evacuation services are essential, whether it’s due to COVID, a natural disaster, civil unrest or simply needing emergency help when you’re traveling. Travel protection for emergency medical services and evacuation is no longer optional; it’s obligatory,” Richards said.
Related Posts

Apr 24, 2024 8 mins read
Are More Women Traveling Without Men?

Apr 18, 2024 2 mins read
Rescue Experts in Action: Saving High-Altitude Climbers

Apr 16, 2024 4 mins read
Mission Briefs: Global Rescue In Action – April

Apr 03, 2024 6 mins read
A Pedestrian’s Painful Misstep in Portugal

Mar 27, 2024 6 mins read
Shirts On, Heels Off: Unique Laws International Travelers Should Know Before They Go

Mar 21, 2024 4 mins read
Mission Briefs: Global Rescue In Action – March

Mar 13, 2024 7 mins read
Beyond the Road: Adventure Motorcycle Touring Surges

Mar 06, 2024 5 mins read
Expertise in Action: Global Rescue’s Role in the Aconcagua Climbing Season
General TotalCare Disclaimer:
- ©2024 Global Rescue LLC. TotalCare and the TotalCare logo are service marks of Global Rescue LLC. All Rights Reserved. Global Rescue LLC provides technical and administrative services to Elite Medical Group, P.C. (“Elite Medical”), a professional corporation owned by licensed physicians that employs or contracts with physicians licensed to practice medicine where medical services are provided. It is not guaranteed that a prescription will be written, nor will any DEA controlled substances, non-therapeutic drugs and certain other drugs which may be harmful because of their potential for abuse, as a result of a TotalCare consultation. Elite Medical physicians reserve the right to deny care for potential or actual misuse of services. The Global Rescue Mobile App is designed for operation on the current versions of Android and iOS operating systems. Availability of services is subject to your equipment compatibility, connectivity and signal in your location. There is no guarantee that all features and functionality will be available in your location. Use and availability of the Mobile App is subject to your service provider’s plan and may be subject to additional fees from your provider.
Extended Plan TotalCare SM :
- For individuals 85+, medical transport is not included in membership. Members 85+ may purchase medical transport on a fee for service basis.
Mobile Apps:
- Global Rescue Mobile Apps are designed for operation on the current versions of Android and iOS operating systems. Availability of services is subject to your equipment compatibility, connectivity and signal in your location. There is no guarantee that all features and functionality will be available in your location. Use and availability of the Mobile Apps are subject to your service provider’s plan and may be subject to additional fees from your provider. The download and use of a Global Rescue Mobile App is subject to the terms of your Member Services Agreement and the applicable End User License Agreement (EULA).
Already an Active Member? Login for Full Access
- Vacation Rentals
- Restaurants
- Things to do
- Things to Do
- Travel Stories
- Rental Cars
- Add a Place
- Travel Forum
- Travelers' Choice
- Help Center
- About Applause
- Life at Applause
- Diversity, Equity & Inclusion
- Leadership Team
- Partnerships
- Job Openings
- Join Our Community
- Customer Login
The comprehensive platform you need to deliver exceptional digital experiences
A wide range of testing solutions to cover all aspects of digital quality
Deep domain experience and expertise in the industries and use cases you need
Enabling digital quality and product excellence as the pioneer of crowdtesting
The world's largest community of digital experts – vetted, trained, fast, available

See how Applause delivers authentic, real-world feedback on the quality of your digital experiences – so you can release with confidence.
Manual Functional Testing
Automated Functional Testing
Accessibility Testing
Payment Testing
Customer Journey Testing
Generative AI
AR & VR
Voice & AI
Amazon Alexa
Learn the what, where, why and brief history of Applause
Get immersed in our culture, values, departments and perks
Learn how DEI is ingrained in Applause and see our stats
Meet our executive and board team and check out their backgrounds
Check out the latest press mentions and articles from Applause

Are you passionate about helping the world’s most innovative brands deliver the best digital experiences? Find the right opportunity for you.
Read the latest industry news on remote testing and digital quality
See our latest sessions focused on digital products and technology
Listen to the latest episodes of the Ready, Test, Go. podcast
Read and view our resources for the latest testing best practices
Register today for our upcoming webinars on digital quality
We help brands just like you launch uncommonly great digital assets with confidence

Learn how to improve your digital quality processes and ensure exceptional customer experiences with special reports for your industry or region.


What Travelers Want from Apps: Convenience and Control
The pandemic hit the travel and hospitality industry hard. Over the last year, as lockdowns lifted and the COVID crisis subsided, the industry began to rebound. Expectations have changed, however. While changing mandates, requirements, and restrictions due to the pandemic are no longer in play, both travelers and hospitality companies still face stressors such as flight cancellations, staff shortages, overbookings and unexpected closures.
In August, we surveyed the uTest community to determine how people are using travel and hospitality apps, assess their satisfaction with the apps they use, and identify the most common flaws they encounter. Out of more than 5,000 global respondents to Applause’s August 2022 survey on travel and hospitality app use and user satisfaction, 82% had traveled at least once in the past year; 92% said they have at least one travel or hospitality app installed on their mobile devices.
How satisfied are users with the apps they’re using? More than two-thirds reported they were somewhat or extremely satisfied with the apps they used for planning travel details. In addition, 63% of the respondents said the apps they use have been helpful in managing recent travel challenges such as cancellations, delays, or closures.
However, not all journeys flowed smoothly. Of the group, 20% noted that they were either somewhat or very dissatisfied with their app experiences. The most notable problems they reported with apps were:
being unable to find the information they were looking for (18%)
very slow response times (13%)
localization problems (12%)
difficulty using payment sources (11%).
Those who were dissatisfied often couldn’t complete their desired tasks through the app. Respondents shared, “The app didn’t allow me to cancel a reservation” and “I had a problem filtering results, so I had to start the search again from the beginning.” Another reported that when flights were changed they could not rebook online and had to call customer service, where they encountered a four-hour hold before resolving the problem.
When plans change and travelers need to adjust mid-trip, it’s crucial that apps help them efficiently and quickly manage those changes.
What makes a great travel app
We asked survey respondents to share what they saw as the most important features of a travel and hospitality app. Of 16,274 responses (participants could choose multiple options), these emerged as the top five criteria:
Helps keep all information in one place: 18%
Connects well to payment devices: 16%
Sends texts for reminders, updates or changes (travel times, cancellations, reservation times): 15%
Provides a seamless, intuitive experience: 14%
Feels secure; info is protected: 14%
People report using apps to coordinate various aspects of travel – everything from booking flights and accommodations to making meal reservations and entertainment purchases, such as tickets and tours.
Travel and hospitality organizations are doing a good job personalizing customer experiences. Most survey respondents said they felt like travel apps understand their preferences at least sometimes and are personalized to their needs. Only 6% reported that the apps they use do not understand their needs or offer any personalization at all.
While things seem to be looking up for travel and hospitality companies, seamless digital experiences will remain key as the industry continues to recover. Thorough testing that ensures customers who veer off the happy path can use apps to maintain – or regain – control over their trips will set leaders apart. Learn more about how to meet and exceed customer expectations in the recent State of Digital Quality in Travel & Hospitality report.
State of Digital Quality in Travel & Hospitality
Ever-increasing customer expectations and fierce competition mean travel & hospitality organizations can’t afford mistakes.
Share this:

4 Emerging Customer Journey Trends to Test
3 keys to a successful digital launch in africa, how gen ai is transforming software development, maintaining high quality while replatforming, credit card rewards demystified: give the people what they want, software testing basics: manual functional testing faqs.

- Suggested Resorts
Current Available Points
- Buzzworthy News Owner Testimonials Pride of Ownership Tour the Club Using My Ownership VIP by Wyndham Presidential Reserve
- Search Resorts Featured Destinations Travel Inspiration Resort News Vacation Planner Explore Destinations
- New Owner Quick Start Dig into Club Life Education Webinars Resources
- Non-Owner Travel Deals Owner Exclusives Club Wyndham Travel Travel Up by Travel + Leisure Owner Travel Deals Partner Offers VIP Exclusives
- Make A Payment Ask and Answer Glossary Contact Us
- Sign In Register
- Skip to Main Content
- Buzzworthy News
- Owner Testimonials
- Pride of Ownership
- Tour the Club
- Using My Ownership
- VIP by Wyndham
- Presidential Reserve
- Search Resorts
- Travel Inspiration
- Resort News
- Vacation Planner
- Explore Destinations
- Dig into Club Life
- Education Webinars
- Non-Owner Travel Deals
- Club Wyndham Travel Travel Up by Travel + Leisure
- Owner Travel Deals
- Partner Offers
- VIP Exclusives
- Make A Payment
- Ask and Answer
- Current Available Points >

CLUB NEWS | APRIL 23, 2024
How do you vacation.
As a Club Wyndham owner, you’re used to living your bucket list each and every day — with the space and flexibility to make it possible. But how do your fellow travelers’ vacations compare? A recent survey of 2,000 American travelers proved that vacation is a necessity, with 86% of respondents saying they consider vacation as a form of self-care. An even more illuminating finding? 46% of respondents hope “traveler” is on their calling card, wanting to be known for their wanderlust by the people in their lives.
It’s clear you know travel because you do travel. Here’s what else was learned.
- The average person spent 11 days on vacation in 2023.
- Looking ahead, the average American wants to spend 15 days on vacation in 2024 and, if they had unlimited PTO, they’d want to spend 18 days.
- A quarter of respondents said they travel more than the average person they know.
- One in five Americans are “always” thinking about planning their next vacation while on vacation, according to new research.
- One in five adults who travel long to be on vacation again the day they get back (21%) and another 27% said this feeling sets in within a week.
- More than 70% of potential travelers count down to their vacation, and a majority long to travel again just one week after returning home.
- Eight in 10 travelers would be interested in a “do-nothing” vacation where they sit by the pool, beach, or inside reading a book or relaxing.
- Nearly a third of respondents (29%) spend most or all their time at their hotel or resort while on vacation.
- Nearly a quarter of travelers said sharing a hotel room isn’t ideal and the same percentage said small hotel rooms were a dealbreaker (23%, each).
- Most Americans surveyed said that when on vacation with others, they prefer having their own or extra space to spread out (79%), including 82% of parents.
- Respondents want to steer clear of discomforts like sharing a bathroom with others (27%) and want to avoid situations where they would have difficulty sleeping (27%).
- If they had their dream hotel room, respondents would make sure there was Wi-Fi (55%), a private balcony or outdoor area (41%), a large bedroom (37%), a large bathroom (33%), and a full-sized kitchen or kitchenette (32%).
- Pride of Ownership Using My Ownership Owner Testimonials How To Use a Club Wyndham Timeshare Buying a Club Wyndham Timeshare Buzzworthy News
- Explore Resorts Featured Destinations Resort News Traveler's Pledge
- New Owner Quick Start Resources
- Owner Exclusives Partner Offers Wyndham Vacation Packages Wyndham Sweeps
- Publications
- Wyndham Cares
- Terms of Use
- Privacy Notice
- Cookie Settings
- Do Not Sell Or Share My Personal Information - Consumers
- Do Not Sell Or Share My Personal Information - Former Employees (California)
- Weird But True
- Sex & Relationships
- Viral Trends
- Human Interest
- Fashion & Beauty
- Food & Drink
trending now in Lifestyle

I dropped 160 pounds in 2 years — these 11 foods made weight...

Tattooed applicant claims she was denied TJ Maxx job over her...

I'm too hot to date but don't call me arrogant — haters are...

8 bad habits that you need to break -- unless you want to age...

Top 25 US beaches revealed — 2 surprising NYC spots made the...

I'm a fitness coach — here are the 3 foods I eat every day

Anti-aging guru shares unique ingredient he uses daily that helps...

I'm a plastic surgeon — here's what I do daily to look younger
Breaking news, the majority of us travelers plan to do a road trip this summer: survey.
- View Author Archive
- Get author RSS feed
Thanks for contacting us. We've received your submission.
Travel experts at The Vacationer released their 2024 summer travel survey results this week, giving an overview of what travelers can expect this summer season beginning on Memorial Day weekend.
The anonymous survey asked more than 1,000 American adults if and how they plan to travel this summer. Mathematics professor Eric Jones of Rowan College, South Jersey, analyzed the results.
According to the survey, nearly 82% of Americans plan to travel this summer, which could be more than 212 million adults throughout the season.
This number is down from summer 2023, with 3% fewer people intending to travel at least once this summer.
While nearly 52%, or 132 million Americans, said they would fly this summer, air travelers are down compared to last summer, when 54% intended to fly at least once.
According to The Points Guy, airline passengers could be in for another busy summer travel season in the U.S. and internationally. Experts also don’t expect fairs to drop significantly compared to last summer.

The average domestic airfare for June will cost about $303, with round-trip routes trending lower for July and August, according to The Points Guy.
According to The Vacationer survey, the most popular method of travel is by road. Seventy-five percent of Americans intend to take at least one road trip this summer, most driving somewhere within 100 miles of their home.
Keep up with today's most important news
Stay up on the very latest with Evening Update.
Thanks for signing up!
Please provide a valid email address.
By clicking above you agree to the Terms of Use and Privacy Policy .
Never miss a story.
Less than 21% will stick to a destination within 250 miles from home, and 5.8% will drive more than 1,000 miles from home.
How much road trip travelers pay at the gas pump this summer remains to be seen.
According to AAA, the increasing gas prices may be about to stall – at least for a little while. The national average for a gallon of gas is $3.67, about two months ahead of Memorial Day weekend, when the summer travel season begins.
“The situation overseas with war in both the Middle East and Ukraine has the oil market on edge,” AAA Andrew Gross spokesperson said. “But this is also the time of year we may see a bit of a lull in gasoline demand between the end of spring breaks and ahead of Memorial Day. So the national average for gas may waffle a bit with small increases, some flat days, and even some price dips.”
Share this article:
Numbers, Facts and Trends Shaping Your World
Read our research on:
Full Topic List
Regions & Countries
- Publications
- Our Methods
- Short Reads
- Tools & Resources
Read Our Research On:
Americans who have traveled internationally stand out in their views and knowledge of foreign affairs
Do people who travel think differently about the world? A new Pew Research Center survey suggests they do.
Americans who have traveled internationally are more interested in and knowledgeable about foreign affairs, feel closer to others around the world, and favor a more active foreign policy, according to the survey of 3,576 U.S. adults conducted in spring 2023. We also surveyed people in 23 other countries about their international travel habits.
This analysis examines international travel with a focus on Americans’ travel, including which Americans travel abroad and how their interest in the world and views of international affairs differ from others.
For this analysis, we surveyed 3,576 U.S. adults from March 20 to March 26, 2023; 3,581 U.S. adults from March 21 to March 27, 2022; and 10,606 U.S. adults from June 14 to June 27, 2021. Everyone who took part in these surveys is a member of the Center’s American Trends Panel (ATP), an online survey panel that is recruited through national, random sampling of residential addresses. This way nearly all U.S. adults have a chance of selection. The survey is weighted to be representative of the U.S. adult population by gender, race, ethnicity, partisan affiliation, education and other categories. Read more about the ATP’s methodology .
For non-U.S. data, this report draws on nationally representative surveys of 27,285 adults conducted from Feb. 20 to May 22, 2023. All surveys were conducted over the phone with adults in Canada, France, Germany, Greece, Italy, Japan, the Netherlands, South Korea, Spain, Sweden and the United Kingdom. Surveys were conducted face-to-face in Hungary, Poland, India, Indonesia, Israel, Kenya, Nigeria, South Africa, Argentina, Brazil and Mexico. In Australia, we used a mixed-mode probability-based online panel.
Here are the June 2021 survey questions and responses used in this analysis. Those for the March 2022 survey may be found here , as well as those for the March 2023 survey .
How many Americans have traveled internationally?
Roughly three-quarters of Americans (76%) have visited at least one other country, including 26% who have been to five or more. About a quarter (23%) have not traveled internationally, though most in this group say they would if they had the opportunity.
Related: How experience with international travel varies across 24 countries
To analyze how Americans’ travel experiences relate to their attitudes on other questions, we placed people into three categories:
- Globe-trotters have traveled to at least five other countries. About a quarter of the U.S. public (26%) falls into this category.
- Casual travelers have traveled to between one and four other countries. Half of Americans fall into this category.
- Nontravelers have never left the United States. This category includes 23% of Americans.
Compared with Americans, people in many European nations are more likely to have traveled to five or more other countries. For instance, 88% of Swedes have done so.
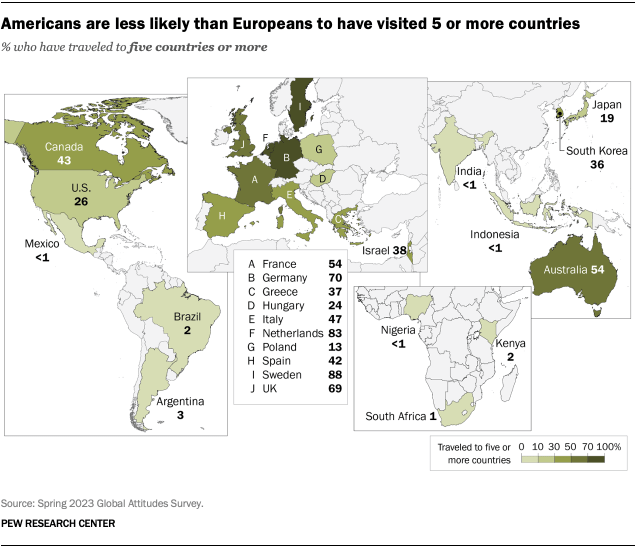
However, international travel is much less common in many middle-income nations. It is strongly correlated with a nation’s gross domestic product per capita. (For more on international travel and views about global engagement, read “Attitudes on an Interconnected World.” )
Who travels internationally?

Perhaps unsurprisingly, older people are more likely than younger people to have traveled internationally. Americans ages 65 and older are more than twice as likely as adults under 30 to fall into our globe-trotter category (37% vs. 17%).
Income is even more strongly related to travel than age. Two-thirds of upper-income Americans have traveled to at least five countries, compared with 9% of Americans with lower incomes.
Similarly, Americans with a postgraduate degree are far more likely to be globe-trotters than those with a high school education or less (59% vs. 10%).
Residents of suburban and urban areas generally have more international travel experience than people who live in rural areas.
There are no significant partisan differences when it comes to international travel: 26% of Democrats and Democratic-leaning independents qualify as globe-trotters, as do 28% of Republicans and GOP leaners.
Do travelers know more about the world?
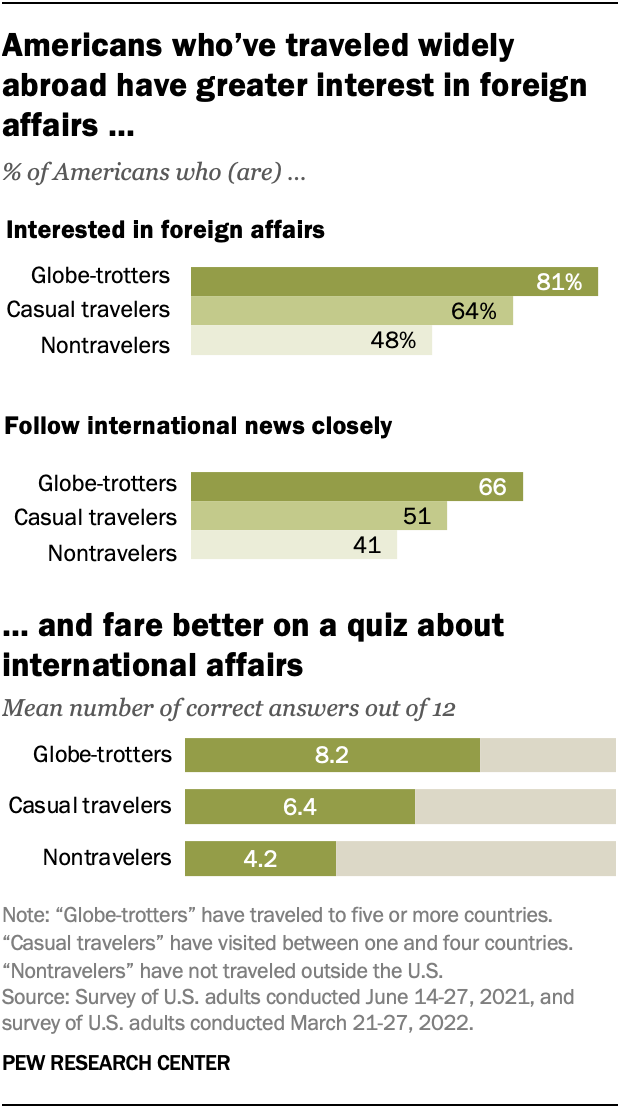
Globe-trotters are especially likely to say they are interested in foreign affairs and follow international news. Casual travelers, in turn, are more likely than nontravelers to do so.
Globe-trotters are also the most knowledgeable about international affairs. In 2022, we conducted an international affairs quiz , asking Americans 12 questions related to international news. On average, globe-trotters got 8.2 of the 12 questions correct, compared with 6.4 for casual travelers and 4.2 for nontravelers.
Is international travel related to views of global engagement?

International travel experience is also linked to Americans’ views about international affairs and their feelings of connection to other people around the world.
When asked which comes closest to their view, 57% of globe-trotters say the U.S. should be active in world affairs, while 43% say the U.S. should pay less attention to problems in other countries and concentrate on problems at home. In contrast, most casual travelers and nontravelers say the U.S. should focus on problems at home.
In all three groups, at least half of respondents say that when the U.S. is making foreign policy, it should take other countries’ interests into account – even if that means making compromises. But globe-trotters are especially likely to hold that view.
Globe-trotters are also particularly likely to say they feel close to people around the world, with 42% saying so. By comparison, 34% of casual travelers and 30% of nontravelers say this.
- International Affairs

Richard Wike is director of global attitudes research at Pew Research Center

Janell Fetterolf is a senior researcher focusing on global attitudes at Pew Research Center
Fewer Americans view the United Nations favorably than in 2023
What are americans’ top foreign policy priorities, rising numbers of americans say jews and muslims face a lot of discrimination, younger americans stand out in their views of the israel-hamas war, how u.s. muslims are experiencing the israel-hamas war, most popular.
1615 L St. NW, Suite 800 Washington, DC 20036 USA (+1) 202-419-4300 | Main (+1) 202-857-8562 | Fax (+1) 202-419-4372 | Media Inquiries
Research Topics
- Age & Generations
- Coronavirus (COVID-19)
- Economy & Work
- Family & Relationships
- Gender & LGBTQ
- Immigration & Migration
- Internet & Technology
- Methodological Research
- News Habits & Media
- Non-U.S. Governments
- Other Topics
- Politics & Policy
- Race & Ethnicity
- Email Newsletters
ABOUT PEW RESEARCH CENTER Pew Research Center is a nonpartisan fact tank that informs the public about the issues, attitudes and trends shaping the world. It conducts public opinion polling, demographic research, media content analysis and other empirical social science research. Pew Research Center does not take policy positions. It is a subsidiary of The Pew Charitable Trusts .
Copyright 2024 Pew Research Center
Terms & Conditions
Privacy Policy
Cookie Settings
Reprints, Permissions & Use Policy
Cookies on GOV.UK
We use some essential cookies to make this website work.
We’d like to set additional cookies to understand how you use GOV.UK, remember your settings and improve government services.
We also use cookies set by other sites to help us deliver content from their services.
You have accepted additional cookies. You can change your cookie settings at any time.
You have rejected additional cookies. You can change your cookie settings at any time.
- Driving and road transport
- Cycling and walking
National Travel Survey
Statistics and data about the National Travel Survey, based on a household survey to monitor trends in personal travel.
National Travel Survey Statistics 2022 User Engagement Exercise
The National Travel Survey (NTS) statistics team carried out a review of NTS publication tables, guided by the focus on the different types of NTS statistics users. This was to better understand how NTS data are used, whether some publication tables can be discontinued and whether other information collected within the NTS questionnaire or travel diary would be useful to have regularly published. This exercise has resulted in some NTS publication tables being discontinued (data is still collected), some modified and new ones added.
For more information on the NTS statistics 2022 User Engagement Exercise including details of which tables have been discontinued and which new tables have been added, please see Future developments for the National Travel Survey .
National Travel Survey Statistics Table Finder
Use the Transport Statistics finder to explore and discover the latest statistics and report published by the National Travel Survey statistics team, and the rest of the Department for Transport (DfT).
You can use the search functions in the finder to explore, download and view all the statistical content the department has published.
Latest National Travel Survey statistics
National Travel Survey (NTS) is a household survey designed to monitor long-term trends in personal travel and to inform the development of policy. It is the primary source of data on personal travel patterns by residents of England within Great Britain.
The survey collects information on how, why, when and where people travel as well as factors affecting travel (for example, car availability and driving licence holding).
Guidance on current and previous National Travel Survey statistics are available.
- 25 April 2024
- Official Statistics
- 14 December 2023
- National statistics
National Travel Survey data tables
A range of new ad-hoc pieces of analysis have also been published which can be found on Ad-hoc National Travel Survey analysis .
- Statistical data set
- 30 August 2023
About the National Travel Survey data and reports
National Travel Survey data collection consists of a face-to-face interview and a 7 day self-completed written travel diary, allowing travel patterns to be linked with individual characteristics. The survey covers travel by people in all age groups, including children. Approximately 16,000 individuals in 7,000 households in England, participate in the survey each year.
- 5 August 2020
- 29 March 2018
Mid-year estimates for the year ending June 2023 added.
National Travel Survey for the year 2022 added.
National Travel Survey 2021 added.
National Travel Survey 2020 added to the collection.
National Travel Survey 2019, National Statistics designation and pre-release access pages added to collection.
Updated for NTS 2018 publication.
New release published.
Request for feedback for NTS questionnaire changes added to the page.
New release published and text updated.
First published.
Related content
Is this page useful.
- Yes this page is useful
- No this page is not useful
Help us improve GOV.UK
Don’t include personal or financial information like your National Insurance number or credit card details.
To help us improve GOV.UK, we’d like to know more about your visit today. We’ll send you a link to a feedback form. It will take only 2 minutes to fill in. Don’t worry we won’t send you spam or share your email address with anyone.
Alaska Airlines, Hilton hotels top travel Customer Satisfaction Index

While most travel-related news recently has centered on incidents related to Boeing jets, that’s not doing much to change people’s enthusiasm for getting away from it all.
The American Customer Satisfaction Index’s annual Travel Survey for 2023–2024 is out, and for airlines at least, customer satisfaction has never been this high. That might not be surprising, given the ongoing trends of revenge travel and overall wanderlust, but some of the specifics might raise eyebrows.
Alaska Airlines, for instance, was ranked as the top airline for the second year in a row in the study. That came despite the widely reported in-flight loss of a door in January 2024. That incident was blamed on Boeing, which made the plane, rather than Alaska, but it resulted in the grounding of much of the carrier’s fleet, causing inconveniences for travelers.
In the survey, however (which interviewed 16,352 customers between April 2023 and March 2024), Alaska saw its overall customer service score increase by 1% over the previous year to 82. American Airlines came in second, with a score of 79.
United was the only carrier to see its score lower, losing three points.
Among hotels, Hilton led the list, topping IHG and Hyatt. Wyndham was the lowest-ranked chain. Hotels, in general, are on an upswing with consumers. After hitting a 15-year low in 2022, consumer sentiment began to rise last year and was up another 3% this year. As with airlines, the increase is said to be due to an increase in staffing levels and a return to normal operations.
National was the top-rated car rental chain, followed by Alamo (which led last year’s list) and Avis, which tied for second. Lyft and Uber were tied among customer satisfaction in ride-sharing.
Latest in Lifestyle
- 0 minutes ago

David Beckham is suing Mark Wahlberg’s fitness company for $14 million—making him the third former pro athlete to do so

Bird flu fragments are in pasteurized milk now, but the FDA—and many other government agencies—still considers it safe

Chocolate prices have exploded—as has the wealth of Mars and Ferrero family empires, outsizing two of the world’s top cocoa-producing countries

After Cirque du Soleil’s daring, high-wire comeback, its CEO is aiming for new heights

A celebration of diversity, national pride, and the power of pop and glitter – here’s a guide to all things Eurovision

Japanese ‘sugar baby’ sent to prison for swindling men out of $1 million and selling a guide on how to do it: ‘She took advantage of feelings for her’
Most popular.

On a crucial earnings call, Musk reminds the world Tesla is a tech company. ‘Even if I’m kidnapped by aliens tomorrow, Tesla will solve autonomy’

Spotify CEO Daniel Ek surprised by how much laying off 1,500 employees negatively affected the streaming giant’s operations

The outlook for home prices has changed drastically in just the past month as Fed rate cuts look more and more distant

A 60-year-old worker in Texas says she’s dependent on apps that let her get paid early: ‘They get you hooked on having that money’

Three top executives at Tesla have resigned in two weeks, with the latest departure at the end of its earnings call

Your reusable water bottle may be a breeding ground for strep and fecal bacteria. Here’s how to keep it clean

Ohio News | NOACA conducts Northeast Ohio travel survey to…
Share this:.
- Click to share on Facebook (Opens in new window)
- Click to share on X (Opens in new window)
- Lorain County
- Cuyahoga County
- Opioid Epidemic
Ohio News | NOACA conducts Northeast Ohio travel survey to determine regional transportation priorities

The Northeast Ohio Areawide Coordinating Agency (NOACA) recently launched a major survey designed to learn more details about travel trends and patterns in Northeast Ohio.
About 550,000 households throughout five counties (Cuyahoga, Geauga, Lake, Lorain, and Medina) will be randomly selected to complete the survey.
The survey data will help set transportation priorities within the region and prioritize local transportation projects. The survey will also help transportation planners determine how to improve mobility, roads, and public transportation; reduce traffic congestion; and enhance walking and bicycling opportunities.
The survey will be sent to a random sample of Northeast Ohio residents. Households are initially contacted by mail and asked to respond to a brief survey about their daily travel, including the places they go and details about the type of transportation they use to get there.
Responses will be used to understand where people are trying to go in their daily lives, how they get there, and how much time and effort it takes them.
The survey results create a snapshot of how the transportation system in the region is used.
Transportation planners will use that snapshot to plan and develop improvements.
Residents can help by participating in the survey if they receive an invitation in the mail.
Each household invited to the survey represents thousands of other households, with similar demands and needs in nearby neighborhoods that were not selected, according to the release.
For more information. call the hotline at 1-877-378-2749 or visit the website at NEOTravelSurvey.com .
Households can also email the team at [email protected] to answer more questions about the survey.
More in Ohio News

Crime and Public Safety | 74-year-old Ohio woman charged in armed robbery of credit union was scam victim, family says

SUBSCRIBER ONLY
Crime and public safety | fatal shooting of ohio officer during training exercise probed as possible homicide.

Ohio News | Fire in truck carrying lithium ion batteries leads to 3-hour evacuation in Columbus
![SOUTH CHARLESTON, Ohio (AP) — An Ohio man who authorities say fatally shot an Uber driver who he thought was trying to rob him after scam phone calls deceived them both has been indicted on a murder charge. William Brock, 81, also faces counts of kidnapping and felonious assault in the indictment handed up Monday […] SOUTH CHARLESTON, Ohio (AP) — An Ohio man who authorities say fatally shot an Uber driver who he thought was trying to rob him after scam phone calls deceived them both has been indicted on a murder charge. William Brock, 81, also faces counts of kidnapping and felonious assault in the indictment handed up Monday […]](https://www.morningjournal.com/wp-content/uploads/2024/04/Scam_Caller_Uber_Driver_Killed_69376.jpg?w=525)
Crime and Public Safety | Ohio man fatally shot Uber driver after scam phone calls targeted both of them, authorities say
Home Toggle navigation FR Toggle Search Search the site Search About us About us Head office Regional offices History Archives Background materials Photos and videos Accessibility Contact us Corporate governance Board of Directors Governing Council and Senior Management Governance documents Educational resources The Economy, Plain and Simple Explainers Financial education resources Careers Take a central role at the Bank of Canada with our current opportunities and scholarships.
Market Participants Survey—First Quarter of 2024
Results of the first-quarter 2024 survey conducted from March 7 to 15, 2024.
The Market Participants Survey results are based on questionnaire responses from about 30 financial market participants. You can view the latest quarterly data here.
Economic scenario
1.1 what is your forecast for real gdp growth (year-over-year percentage change) in canada.
Note: Respondents were asked to calculate the four-quarter (year-over-year) growth rate based on the end of Q4. GDP is gross domestic product.
1.2 What is the probability of real GDP growth in Canada being in each of the following ranges at the end of 2024 and 2025?
Note: GDP is gross domestic product.
1.3 Please identify up to three upside risks to your growth outlook for Canada.
* Share of respondents who selected each risk
1.4 Please identify up to three downside risks to your growth outlook for Canada.
1.5 how would you characterize the current level of canadian gdp relative to potential output.
Note: GDP is gross domestic product. The output gap is the difference between the current level of Canadian GDP and the level of potential output.
1.6 What is the probability of the Canadian economy being in a recession in each of the following individual time frames?*
* A recession is defined as two consecutive quarters of negative economic growth, as measured by real gross domestic product.
1.7 What is your forecast for annual total CPI inflation in Canada?
Note: Respondents were asked to estimate, based on the end of Q4, the four-quarter (year-over-year) consumer price index (CPI) inflation in Canada.
1.8 What is the probability of annual total CPI inflation in Canada being in each of the following ranges at the end of 2024 and 2025?
Note: CPI is the consumer price index.
Monetary policy
2.1 what is your forecast for the bank of canada’s policy interest rate, 2.2 how would you describe the balance of risks around your forecast for the bank of canada’s policy interest rate, 2.3 at what level do you expect the policy rate to peak in the current cycle in canada, 2.4 what is your estimate of the long-term nominal neutral rate in canada, financial assets, 3. according to your economic scenario, what is your point estimate for the following, on this page table of contents.
We use cookies to help us keep improving this website.

IMAGES
COMMENTS
At the time of the survey, three in four respondents said they have two or more trips booked for the rest of 2023; 10% even said they had seven or more already planned. And though their travel ...
The 2023 Family Travel Association annual family travel survey highlights post-pandemic trends, positive attitudes and opportunities for growth. Today, the Family Travel Association released findings from its 2023 U.S. Family Travel Survey on family travel trends. Produced in partnership with the NYU School of Professional Studies, Jonathan M. Tisch Center of Hospitality and Edinburgh Napier […]
REPORT October 04, 2023. In an effort to provide a holistic analysis on consumer travel, each quarter we'll bring together results from our Ipsos Consumer Survey and Business Travel Tracker. These quarterly insights provide a more in-depth look at consumer priorities, travel expectations, behavior and shifts in traveler trends, all within the ...
The 2022 National Household Travel Survey (NHTS) provides an inventory of daily personal travel in the United States. It is the only source of national-level multimodal statistics on personal travel in the United States. The survey series (conducted since 1969) includes demographic data on households, people, and vehicles as well as detailed
National Household Travel Survey. Conducted by the Federal Highway Administration, the NHTS is the authoritative source on the travel behavior of the American public. It is the only source of national data that allows one to analyze trends in personal and household travel. It includes daily non-commercial travel by all modes, including ...
2023 US Family Travel Survey Results. The 2023 Family Travel Association annual family travel survey highlights post-pandemic trends, positive attitudes and opportunities for growth. Today, the Family Travel Association released findings from its 2023 U.S. Family Travel Survey on family. Continue Reading Story.
We surveyed travelers from five major tourism markets —the U.S., UK, Australia, China and India—to get a global perspective, especially given the varying levels of travel restrictions and governmental and individual responses during the past two years. This data-intensive report presents and analyzes the findings from this survey, delving ...
Update - See our new 2023 Sustainable Travel Survey and compare the results to this article's 2022 results.. We are now less than a month away from Earth Day 2022. Our Summer 2022 Travel Survey revealed 81% plan to travel this summer. And, nearly 51% intend to fly on a plane. 42% of American adults even say they will travel more than last year.
Sixty-eight percent of survey respondents have already traveled internationally since the pandemic. The balance expects to travel abroad by the end of the year (16%) or in the first three months of 2023 (9%). The numbers have been rising consistently for more than a year. The Spring 2022 Global Rescue Traveler Safety and Sentiment Survey found ...
The 2022 National Household Travel Survey (NHTS) provides an inventory of daily personal travel in the United States. It is the only source of national-level multimodal statistics on personal travel in the United States. ... While survey methods affect final results, efforts to minimize differences resulting from method changes have been ...
A pioneer in the use of big data, artificial intelligence (AI) and algorithmic modeling capabilities to understand consumer behavior, J.D. Power has been delivering incisive industry intelligence on consumer interactions with brands and products for more than 50 years. ANNEX: BUSINESS TRAVEL INDEX. 18.
When inspecting the survey results from each of the five markets individually, for some, the potential rebound appears even stronger. In the United States for example, intent for leisure travel abroad is up 6pp compared to 2019, while domestic leisure travel plans for 2022 are up 8pp against 2019. ... For Japan and Singapore, the picture seems ...
Navigating Airfare: Survey Results. Posted on September 22nd, 2023 by Britton Frost in Deck Plans. We recently wrote about how we were observing a downward trend in airfare prices (at least seasonally). For example, September roundtrip economy flights between Asheville, North Carolina (where we live) and Paris, France (where we wish we lived ...
Out of more than 5,000 global respondents to Applause's August 2022 survey on travel and hospitality app use and user satisfaction, 82% had traveled at least once in the past year; 92% said they have at least one travel or hospitality app installed on their mobile devices. How satisfied are users with the apps they're using?
This random survey of 2,000 Americans who travel was commissioned by Club Wyndham in March 2024 in partnership with market research company OnePoll, whose team members are members of the Market Research Society and have corporate membership to the American Association for Public Opinion Research and the European Society for Opinion and Marketing Research ().
The third parameter is a form of funding using a variety of sources from partners. Fig. 2 depicts funding opportunities where surveying effort partners buy add-on samples similar to the National Household Travel Survey (NHTS) program. PSRC used this structure, inviting local jurisdictions to join in the deployment (e.g., the City of Tacoma, the City of Seattle, the City of Bellevue).
The anonymous survey asked more than 1,000 American adults if and how they plan to travel this summer. Mathematics professor Eric Jones of Rowan College, South Jersey, analyzed the results.
A new Pew Research Center survey suggests they do. Americans who have traveled internationally are more interested in and knowledgeable about foreign affairs, feel closer to others around the world, and favor a more active foreign policy, according to the survey of 3,576 U.S. adults conducted in spring 2023. ... International travel experience ...
The National Travel Survey mid-year estimates, year ending June 2023 results showed: people in England made 882 trips on average in the year ending June 2023, about 17 trips per week.
Vacation travel survey. SurveyMonkey is rated 4.5 out of 5 from 18,000+ reviews on G2.com. If you're a travel planner or researcher, get the competitive edge by learning about people's vacation preferences. Our expert-certified vacation travel template lets you get to know your target audience better and see what factors go into planning a ...
Active surveys. Disclaimer: By clicking on any of the active survey links, you are now leaving TxDOT's site to a third-party data collection site.Any rewards offered on such a site are the sole responsibility of the third-party data collection contractor. TxDOT is not affiliated with any reward programs and is not responsibile for the distribution of any such rewards.
The results of a new survey indicate that people are placing a higher priority on travel experiences now than pre-pandemic and also consider them to be more important than tangible belongings. ... The survey underscores current optimism surrounding the future of travel, with nearly half of respondents (48 percent) anticipating continued growth ...
National Travel Survey data collection consists of a face-to-face interview and a 7 day self-completed written travel diary, allowing travel patterns to be linked with individual characteristics ...
Results of the 2018-19 Campus Travel Survey Cite CITE Title : Results of the 2018-19 Campus Travel Survey Creator(s) : Lee, Amy Corporate Creator(s) : National Center for Sustainable Transportation (NCST);University of California, Davis, Institute of Transportation Studies; Corporate Contributor(s) : United States.
The American Customer Satisfaction Index's annual Travel Survey for 2023-2024 is out and, for airlines at least, customer satisfaction has never been this high.
The Northeast Ohio Areawide Coordinating Agency (NOACA) recently launched a major survey designed to learn more details about travel trends and patterns in Northeast Ohio. About 550,000 households ...
Survey feedback came from 265 corporate travel decision makers and 151 business travelers around the world. Other issues in the paper include reformed travel and expenses (T&E) policies and ...
The survey results showed that cultural, travel, and social motives led to the construction of the overall destination image. The overall image also affects SNS intention in a positive and significant regard. We also examined the mediating effect of overall image on the relationship between motives and SNS intention.
Results of the first-quarter 2024 survey conducted from March 7 to 15, 2024. The Market Participants Survey results are based on questionnaire responses from about 30 financial market participants. You can view the latest quarterly data here. 25th percentile of responses 0.5 1.9 Median of responses ...