

Walt Disney World Statistics
With the initial success of Disneyland in the mid to late 1950s, Walt Disney set his sights on building another theme park, only this time on a much grander scale. After years in development, Walt’s vision became a reality when Disney World opened the gates of Magic Kingdom on October 1st, 1971. However, this momentous day came five years after Walt Disney succumbed to lung cancer, and thus, he was not able to witness the early and later successes of the park.
Although some elements of Disney World have slightly different outcomes than what Walt originally envisioned, we think he’d be pleased with how the park has evolved over the years, the giant it is today, the positive influence Disney World has had on society and culture along the way. The eye-popping Disney World statistics we discuss in this article really tell the story of Walt’s vision becoming a reality.
With an average annual attendance of over 58 million visitors, Walt Disney World is the most visited vacation resort in the world . The amount of manpower, creativity, machinery, and technology involved in keeping Disney World humming and innovating is simply astounding. Hidden beneath the attractions, resorts, restaurants, and shops are some eye-opening statistics that only an operation as grand as Walt Disney World could lay claim to. Let’s look at some of these fascinating Walt Disney World statistics.
Park Overview – Disney World Statistics
Walt Disney World covers 27, 258 acres (43 square miles) – about the same area as all of San Francisco and two times the size of Manhattan. The Florida swampland which is now home to Disney World was purchased by Walt Disney during the mid-1960s for only $5 million dollars.
Disney World’s Opening Day Statistics
- Walt Disney World was officially announced on November 15, 1965
- To keep his intentions a secret, Walt Disney originally called his plans for Disney World “The Florida Project”
- Walt Disney World Resort’s opening day was October 1, 1971
- Disney World had 10,422 visitors on its opening day
- There were 26 attractions on Disney’s opening day
- It originally cost $400 million – and took 52 months – to build Disney World
- William Windsor, Jr was the first guest of Walt Disney World
- There were approximately 5,000 Cast Members when Disney World opened
- Disney World had welcomed nearly 400,000 visitors by the end of 1971
Opening Dates for Disney World Theme Parks / Water Parks
Disney’s theme parks.
- Magic Kingdom : October 1, 1971
- Epcot : October 1, 1982
- Disney’s Hollywood Studios : May 1, 1989
- Disney’s Animal Kingdom : April 22, 1998
Disney’s Water Parks
- Disney’s Typhoon Lagoon : June 1, 1989
- Disney’s Blizzard Beach : April 1, 1995
Disney World Attendance Statistics
Daily visitors / annual visitors, magic kingdom attendance.
Average Daily Visitors: 57,000 (2021)
Annual Visitors: 21,170,000 (2021) – [This is up from 20,859,000 in 2018 and 20,960,000 in 2019]
Epcot Attendance
Average Daily Visitors: 34,000 (2021)
Annual Visitors: 12,410,000 (2021) – [This is down from 12,444,000 in 2018 and 12,440,000 in 2019]
Hollywood Studios Attendance
Average Daily Visitors: 31,000 (2021)
Annual Visitors: 11,315,000 (2021) – [This is up from 11,258,000 in 2018 and down from 11,480,000 in 2019]
Animal Kingdom Attendance
Average Daily Visitors: 38,000 (2021)
Annual Visitors: 13,870,000 (2021) – [This is up from 13,750,000 in 2018 and down from 13,890,000 in 2019]
Typhoon Lagoon Attendance
Annual Visitors: 2,248,000 (2019)
Blizzard Beach Attendance
Annual Visitors: 1,983,000 (2019)
Disney Cast Member/Employee Statistics
- There are 77,000 Cast Members throughout the Disney World resort, which makes it the biggest single-site employer in the United States.
- Among the Cast Members at WDW, 2,500 work in costume design. Nearly 13,000 clothing items are manufactured every year, with a total of 1.8 million items in Disney’s enormous wardrobe. Minnie Mouse alone has more than 200 different outfits, while Mickey has nearly 300.
- Each year, WDW horticulturalists maintain over 2 million shrubs, 13,000 roses, and train 200 perennial shrubs on the property. With 2,000 acres of turf to maintain, WDW grounds crews log 450,000 mowing miles every year!
- PhotoPass photographers take between 100,000 to 200,000 photographs of guests on any given day.
- 285,000 pounds of laundry is cleaned by WDW employees every day.
Disney World Resort (Hotel) Statistics
- There are currently 36 resorts at WDW, including nine Disney Vacation Club properties.
- 26 of the resort hotels on Disney World property are actually owned and operated by WDW Resort itself
- In total, Disney World has over 30,000 hotel rooms, 409 wilderness cabins, 799 campsites, and 3,293 DVC units
- Disney’s Pop Century Resort has the most guest rooms of any Disney World Resort (2,880 rooms)
Number of Rooms at Disney World Resorts
- Disney’s Value Resorts are Disney’s Art of Animation Resort (864 rooms /1,120 suites), Disney’s All-Star Movies Resort (1,920 rooms), Disney’s All-Star Music Resort (1,704 rooms/215 suites), Disney’s All-Star Sports Resort (1,920 rooms), Disney’s Art of Animation Resort (864 rooms /1,120 suites), and Disney’s Pop Century Resort (2,880 rooms).
- Disney’s Moderate Resorts are Disney’s Caribbean Beach Resort (2,112 rooms), Disney’s Coronado Springs Resort (1,917 rooms), Disney’s Port Orleans Resort-French Quarter (1,008 rooms), and Disney’s Port Orleans Resort-Riverside (2,048 rooms).
- Disney’s Deluxe Resorts are Disney’s Animal Kingdom Lodge (972 rooms), Disney’s Beach Club Resort (576 rooms), Disney’s BoardWalk Inn (372 rooms), Disney’s Contemporary Resort (655 rooms), Disney’s Grand Floridian Resort & Spa (867 rooms), Disney’s Polynesian Village Resort (484 rooms), Disney’s Wilderness Lodge (727 rooms) and Disney’s Yacht Club Resort (621 rooms).
- Disney’s Deluxe Villa Resorts are Bay Lake Tower at Disney’s Contemporary Resort (295 units), Disney’s Beach Club Villas (177 units), Disney’s BoardWalk Villas (282 units), Copper Creek Villas & Cabins at Disney’s Wilderness Lodge (26 cabins and 158 villas), Disney’s Polynesian Villas and Bungalows (20 bungalows and 360 deluxe studio villas), Disney’s Old Key West Resort (558 units), Disney’s Saratoga Springs Resort & Spa (924 units), The Villas at Disney’s Animal Kingdom Lodge (449 units), The Villas at Disney’s Grand Floridian Resort & Spa (106 units), and The Villas at Disney’s Wilderness Lodge (114 units).
Official Walt Disney World Hotels
- Official Walt Disney World Hotels are B Resort & Spa (394 rooms), Buena Vista Palace (1,013 rooms), Walt Disney World Dolphin (1,509 rooms), Doubletree Guest Suites Resort (229 rooms), Drury Plaza Hotel Orlando Lake Buena Vista (604 rooms), The Hilton (814 rooms), Holiday Inn (323 rooms), Shades of Green on Walt Disney World Resort (586 rooms), Walt Disney World Swan (756 rooms), and Wyndham Lake Buena Vista (626 rooms).
Camping at Walt Disney World
- The camping areas at Disney’s Fort Wilderness Resort and Campground include 409 Wilderness Cabins and 799 Campsites.
Disney World Dining Statistics
- WDW has over 300 dining outlets with a staff of 350 chefs.
- Every year, Disney World serves 10 million hamburgers, 6 million hot dogs, 9 million pounds of French fries, 300,000 pounds of popcorn, and 1.6 million turkey drumsticks.
- 13 million bottles of water and 75 million Coca-Colas are sold each year at WDW.
Disney Transportation Statistics
- An average of 250,000 guests travel daily to and from various WDW properties via the 400+ buses, 12 monorail trains, and the fleet of water taxis and boats owned by Disney.
- The monorail alone has an average of 150,000 daily riders
- Since its opening in 1971, WDW monorail trains have registered enough miles to make 30 round trips to the moon.
Magic Kingdom Statistics
- Over 250 million people have ridden the “ It’s a Small World ” attraction at Magic Kingdom.
- Cinderella Castle is 189 feet tall, has 27 towers, and took 18 months to build.
- Over 500 oak trees growing at WDW have come from the acorns of the Liberty Oak in Liberty Square.
See our Magic Kingdom Secrets , Best Magic Kingdom Rides , and Best Magic Kingdom Restaurants pages for more interesting insights on this iconic Disney theme park.
Epcot Statistics
- Epcot opened on Oct. 1st, 1982, and covers 305 acres.
- The outer skin of Epcot’s Spaceship Earth is constructed with 11,324 aluminum and plastic-alloy triangles. The structure weighs an astounding 16 million pounds!
- Over one million pizzas have been served at Epcot’s Via Napoli .
- There were over 225 million food dishes are served at last year’s Epcot Food & Wine Festival.
- Epcot’s The Land Pavilion grows more than 30 tons of fruits and vegetables every year. The produce is then served at WDW restaurants.
- When The Seas with Nemo & Friends pavilion first opened in 1986, its 5.7 million gallon tank was the largest saltwater tank in the world. In 2005, WDW’s tank dropped to the 2nd spot after the Georgia Aquarium surpassed them. If you were to empty all the water at The Seas with Nemo & Friends aquarium into one-gallon milk jugs, laying them side by side, the result would stretch 540 miles. This would equal the distance from Orlando to New Orleans!
- Test Track reaches speeds of up to 65 mph, making it the fastest ride at Disney World.
See our Epcot Secrets and Best Epcot Restaurants pages for more interesting insights on this Disney theme park.
Animal Kingdom Statistics
- There are more than 300 different species of animals at Animal Kingdom, with around 2000 total animals.
- Covering 580 acres, Animal Kingdom is roughly 5 times the size of Magic Kingdom and the largest theme park in the world in terms of acreage.
- It takes more power than a 747-jet engine to bring the Yeti on Expedition Everest to life.
See our Animal Kingdom Secrets and the Best Animal Kingdom Dining Locations pages for more interesting insights on this Disney theme park.
Hollywood Studios Statistics
- The theme park was initially named Disney-MGM Studios Theme Park before being re-branded as Disney’s Hollywood Studios on January 7, 2008
- The production facilities opened during the summer of 1988 while the entertainment facilities opened in May of 1989.
- “Ernest Saves Christmas” was the first movie to be filmed at Hollywood Studios
- Hollywood Studios covers 135 acres.
- Toy Story Land covers 11 acres
- Star Wars: Galaxy’s Edge land covers 14 acres
See our Hollywood Studios Secrets and the Best Hollywood Studios Dining Locations pages for more interesting insights on this Disney theme park.
More WDW Statistics
- The resort boasts over 600,000 square feet of function space throughout WDW for conventions and meetings
- WDW offers three 18-hole championship golf courses and a 9-hole walking course for family play
- The cost of an adult admission ticket was only $3.50 when Disney World first opened (it’s $116+ today)
- Disney spent $1 Billion to implement the MagicBands system.
- For FY2021, Disney had $67.418 billion in worldwide revenue.
- There are 150 shops and restaurants at Disney Springs. World of Disney is the largest retailer of Disney merchandise in the world.
- During the festive Christmas holiday season, more than 1,500-holiday trees, 8.5 million lights, 15 miles of garland, and 300,000 yards of ribbon are installed around Walt Disney World.
- Holding 750,000 gallons of water, Stormalong Bay – at Disney’s Beach Club Resort – is the largest sand-bottom pool in the world.
- Typhoon Lagoon is the second most visited water park in the world, while Blizzard Beach is the 3rd.
- Who was the 1st cartoon character to receive a star on the Hollywood Walk of Fame? Mickey Mouse, of course! This award was given on November 13, 1978.
- Disney World has fully closed 9 times in its history: Hurricane Floyd (Sept. 1999); 9-11 Terrorist Attacks (Sept. 2001); Hurricane Charley (Aug. 2004); Hurricane Frances (Sept. 2004); Hurricane Jeanne (Sept. 2004), Hurricane Matthew (Oct. 2016); Hurricane Irma (Sept. 2017); Coronavirus COVID-19 (March-July 2020); and Hurricane Ian (Sept. 2022). There have been a few additional partial-day closures (early closings or late openings) due to hurricanes, most recently in 2022 for the storm Nicole; a full list is on our Disney Vacations During Hurricane Season page.
- 43,000 Disney World Cast Members were furloughed in 2020 during the pandemic (out of 77,000)
- Disney lost an estimated $20 – $30 million per day during the coronavirus shutdown
We hope that you find these Disney World statistics interesting and inspiring! Feel free to browse other MagicGuides pages, including our Disney World Crowd Calendar , Best Disney World Hotels , Disney World Map , How to Plan at Disney Vacation , How to Become a Disney Travel Agent , and Disney Travel Planners pages.
If you need help planning and booking your magical Walt Disney World vacation, contact our friends at The Vacationeer . Their services are always helpful and totally free of charge! Click HERE for a free, no-obligation price quote .
Thank you for reading our page, and we hope you have a magical Walt Disney World vacation!
Related Posts:

Disney News » Disney Park Attendance Data
Annual Disney Park Attendance Statistics and Charts | Disney Parks Resources
Last Updated on: March 21st, 2024
Posted By: Craig Smith

Photo by Castles, Capes & Clones
Over the past half century, Disney has solidified itself as the undisputed leader in theme park attendance. Disney’s various theme parks are annually ranked among the top-visited parks in the world with the Magic Kingdom and Disneyland occupying the top two spots annually. Over the past four decades, the expansion of the Disney Parks empire beyond the borders of the United States has proven to not only increase the company’s footprint, but also place a number of additional Disney parks into the top attendance charts. I thought it would be fun to take a moment and look at just how many people actually visit the many Disney parks each year. Here is a quick rundown of what I was able to find for annual Disney park attendance.
For many more Disney statistics (close to 600 of them), please visit this Disney facts post .
Please note that some of these Disney parks attendance figures are easier to find than others, so some of these are based on news reports and not official company tallies. All stats are linked to their source unless it was sent to me directly from the company. No stat listed should be considered in making any type of investment decision. In other words: This is the best I can find, but I don’t guarantee anything.
Annual Disney Park Attendance Statistics
Disney park attendance total for 2022 (global):.
115.687 million visitors

Average number of Disney park visitors per month in 2022 (global):
9.640 million visitors per month
Average number of Disney park visitors per week in 2022 (global):
2.224 million visitors per week
Average number of Disney park visitors per day in 2022 (global):
316,950 visitors per day
Disney park attendance total for 2021 (global):
77.857 million visitors
Disney park attendance total for 2020 (global):
43.525 million visitors
Percentage decrease in Disney park attendance total from 2019-2020 (global):
Average number of disney park visitors per month in 2020 (global):.
3.627 million visitors per month
Average number of Disney park visitors per week in 2020 (global):
837,000 visitors per week
Average number of Disney park visitors per day in 2020 (global):
119,000 visitors per day
Total number of Disney park visitors in 2019 (global):
155.991 million visitors
Percentage increase in Disney Parks attendance total from 2018-2019:
Average number of disney parks visitors per month in 2019 (global):.
12.999 million visitors per month
Average number of Disney parks visitors per week in 2019 (global):
2.999 million visitors per week
Average number of Disney parks visitors per day in 2019 (global):
427,372 visitors per day
Total number of Disney park visitors in 2018 (global):
157 million visitors
Percentage increase in Disney Parks attendance total from 2017-2018:
Average number of disney parks visitors per month in 2018 (global):.
13.1 million visitors
Average number of Disney parks visitors per week in 2018 (global):
3.025 million visitors per week
Average number of Disney parks visitors per day in 2018 (global):
430,989 visitors per day
Total number of Disney park visitors in 2017 (global):
150 million visitors
Average number of Disney parks visitors per month in 2017 (global):
12.5 million visitors per month
Average number of Disney parks visitors per week in 2017 (global):
2.884 million visitors per week
Average number of Disney parks visitors per day in 2017 (global):
410,958 visitors per day
Disney World Attendance Statistics
Magic kingdom attendance total for 2022:.
17.133 million visitors
Percentage decrease in Magic Kingdom attendance total from 2021-2022:
")
Average number of Magic Kingdom visitors per month in 2022 (global):
1,427,750 million visitors per month
Average number of Magic Kingdom visitors per week in 2022 (global):
329,481 visitors per week
Average number of Magic Kingdom visitors per day in 2022 (global):
46,940 visitors per day
Magic Kingdom attendance total for 2021:
12.691 million visitors
Magic Kingdom attendance total for 2020:
6.941 million visitors
Percentage decrease in Magic Kingdom attendance total from 2019-2020:
Average number of magic kingdom visitors per month in 2020:.
578,000 visitors per month
Average number of Magic Kingdom visitors per week in 2020:
133,000 visitors per week
Average number of Magic Kingdom visitors per day in 2020:
19,000 visitors per day
Magic Kingdom attendance total for 2019:
20.963 million visitors
Percentage increase in Magic Kingdom attendance total from 2018-2019:
Average number of magic kingdom visitors per month in 2019:.
1.746 million visitors per month
Average number of Magic Kingdom visitors per week in 2019:
403,134 visitors per week
Average number of Magic Kingdom visitors per day in 2019:
57,432 visitors per day
Magic Kingdom attendance total for 2018:
20.859 million visitors
Percentage increase in Magic Kingdom attendance total from 2017-2018:
Average number of magic kingdom visitors per month in 2018:.
1.73 million visitors per month
Average number of Magic Kingdom visitors per week in 2018:
401,134 visitors per week
Average number of Magic Kingdom visitors per day in 2018:
57,147 visitors per day
Magic Kingdom attendance total for 2017:
20.45 million visitors
Percentage increase in Magic Kingdom attendance total from 2016-2017:
Average number of magic kingdom visitors per month in 2017:.
1.7 million visitors per month
Average number of Magic Kingdom visitors per week in 2017:
393,269 visitors per week
Average number of Magic Kingdom visitors per day in 2017:
56,027 visitors per day
Magic Kingdom attendance total for 2016:
20.4 million visitors
Magic Kingdom attendance total for 2015:
20.5 million visitors
Percentage drop in Magic Kingdom attendance total from 2015-2016:
Epcot attendance total for 2022:.
10 million visitors
Percentage decrease in Epcot attendance total from 2021-2022:

Average number of Epcot visitors per month in 2022 (global):
833,333 visitors per month
Average number of Epcot visitors per week in 2022 (global):
192,308 visitors per week
Average number of Epcot visitors per day in 2022 (global):
27,397 visitors per day
Epcot attendance total for 2021:
7.752 million visitors
Epcot attendance total for 2020:
4.044 million visitors
Percentage decrease in Epcot attendance total from 2019-2020:
Average number of epcot visitors per month in 2020:.
337,000 visitors per month
Average number of Epcot visitors per week in 2020:
77,000 visitors per week
Average number of Epcot visitors per day in 2020:
11,000 visitors per day
Epcot attendance total for 2019:
12.444 million visitors
Percentage increase in Epcot attendance total from 2018-2019:
Average number of epcot visitors per month in 2019:.
1.037 million visitors per month
Average number of Epcot visitors per week in 2019:
239,307 visitors per week
Average number of Epcot visitors per day in 2019:
34,093 visitors per day
Epcot attendance total for 2018:
Percentage increase in epcot attendance total from 2017-2018:, average number of epcot visitors per month in 2018:, average number of epcot visitors per week in 2018:, average number of epcot visitors per day in 2018:, epcot attendance total for 2017:.
12.2 million visitors
Percentage increase in Epcot attendance total from 2016-2017:
Average number of epcot visitors per month in 2017:.
1 million visitors per month
Average number of Epcot visitors per week in 2017:
234,615 visitors per week
Average number of Epcot visitors per day in 2017:
33,424 visitors per day
Epcot attendance total for 2016:
11.7 million visitors
Epcot attendance total for 2015:
11.8 million visitors
Percentage drop in Epcot attendance total from 2015-2016:
Disney’s animal kingdom attendance total for 2022:.
9.027 million visitors
Percentage decrease in Disney’s Animal Kingdom attendance total from 2021-2022:

Average number of Disney’s Animal Kingdom visitors per month in 2022 (global):
752,250 visitors per month
Average number of Disney’s Animal Kingdom visitors per week in 2022 (global):
173,596 visitors per week
Average number of Disney’s Animal Kingdom visitors per day in 2022 (global):
24,732 visitors per day
Disney’s Animal Kingdom attendance total for 2021:
7.194 million visitors
Disney’s Animal Kingdom attendance total for 2020:
4.166 million visitors
Percentage decrease in Disney’s Animal Kingdom attendance total from 2019-2020:
Average number of disney’s animal kingdom visitors per month in 2020:.
347,000 visitors per month
Average number of Disney’s Animal Kingdom visitors per week in 2020:
80,000 visitors per week
Average number of Disney’s Animal Kingdom visitors per day in 2020:
Disney’s animal kingdom attendance total for 2019:.
13.888 million visitors
Percentage increase in Disney’s Animal Kingdom attendance total from 2018-2019:
Average number of disney’s animal kingdom visitors per month in 2019:.
1.157 million visitors per month
Average number of Disney’s Animal Kingdom visitors per week in 2019:
267,076 visitors per week
Average number of Disney’s Animal Kingdom visitors per day in 2019:
38,049 visitors per day
Disney’s Animal Kingdom attendance total for 2018:
13.75 million visitors
Percentage increase in Disney’s Animal Kingdom attendance total from 2017-2018:
Average number of disney’s animal kingdom visitors per month in 2018:.
1.145 million visitors per month
Average number of Disney’s Animal Kingdom visitors per week in 2018:
264,423 visitors per week
Average number of Disney’s Animal Kingdom visitors per day in 2018:
37,671 visitors per day
Disney’s Animal Kingdom attendance total for 2017:
12.5 million visitors
Percentage increase in Disney’s Animal Kingdom attendance total from 2016-2017:
Average number of disney’s animal kingdom visitors per month in 2017:, average number of disney’s animal kingdom visitors per week in 2017:.
240,384 visitors per week
Average number of Disney’s Animal Kingdom visitors per day in 2017:
34,246 visitors per day
Disney’s Animal Kingdom attendance total for 2016:
10.8 million visitors
Disney’s Animal Kingdom attendance total for 2015:
10.9 million visitors
Percentage drop in Disney’s Animal Kingdom attendance total from 2015-2016:
Disney’s hollywood studios attendance total for 2022:.
10.9 million visitors
Percentage decrease in Disney’s Hollywood Studios attendance total from 2021-2022:

Average number of Disney’s Hollywood Studios visitors per month in 2022 (global):
908,333 visitors per month
Average number of Disney’s Hollywood Studios visitors per week in 2022 (global):
209,615 visitors per week
Average number of Disney’s Hollywood Studios visitors per day in 2022 (global):
29,863 visitors per day
Disney’s Hollywood Studios attendance total for 2021:
8.589 million visitors
Disney’s Hollywood Studios attendance total for 2020:
3.675 million visitors
Percentage decrease in Disney’s Hollywood Studios attendance total from 2019-2020:
Average number of disney’s hollywood studios visitors per month in 2020:.
306,000 visitors per month
Average number of Disney’s Hollywood Studios visitors per week in 2020:
70,000 visitors per week
Average number of Disney’s Hollywood Studios visitors per day in 2020:
10,000 visitors per day
Disney’s Hollywood Studios attendance total for 2019:
11.483 million visitors
Percentage drop in Disney’s Hollywood Studios attendance total from 2018-2019:
Average number of disney’s hollywood studios visitors per month in 2019:.
956,916 visitors per month
Average number of Disney’s Hollywood Studios visitors per week in 2019:
220,826 visitors per week
Average number of Disney’s Hollywood Studios visitors per day in 2019:
31,460 visitors per day
Disney’s Hollywood Studios attendance total for 2018:
11.258 million visitors
Percentage drop in Disney’s Hollywood Studios attendance total from 2017-2018:
Average number of disney’s hollywood studios visitors per month in 2018:.
938,166 visitors per month
Average number of Disney’s Hollywood Studios visitors per week in 2018:
216,500 visitors per week
Average number of Disney’s Hollywood Studios visitors per day in 2018:
30,843 visitors per day
Disney’s Hollywood Studios attendance total for 2017:
10.722 million visitors
Percentage drop in Disney’s Hollywood Studios attendance total from 2016-2017:
Average number of disney’s hollywood studios visitors per month in 2017:.
893,500 visitors per month
Average number of Disney’s Hollywood Studios visitors per week in 2017:
206,192 visitors per week
Average number of Disney’s Hollywood Studios visitors per day in 2017:
29,375 visitors per day
Disney’s Hollywood Studios attendance total for 2016:
10.8 million
Disney’s Hollywood Studios attendance total for 2015:
Percentage drop in disney’s hollywood studios attendance total from 2015-2016:, blizzard beach attendance total for 2022:.
101,000 visitors
Percentage decrease in Blizzard Beach attendance total from 2021-2022:
Blizzard beach attendance total for 2021:.
1.201 million visitors
Blizzard Beach attendance total for 2020:
316,000 visitors
Percentage decrease in Blizzard Beach attendance total from 2019-2020:
Average number of blizzard beach visitors per month in 2020:.
26,000 visitors per month
Average number of Blizzard Beach visitors per week in 2020:
6,000 visitors per week
Average number of Blizzard Beach visitors per day in 2020:
865 visitors per day
Blizzard Beach attendance total for 2019:
1.983 million visitors
Percentage drop in Blizzard Beach attendance total from 2018-2019:
Average number of blizzard beach visitors per month in 2019:.
165,250 visitors per month
Average number of Blizzard Beach visitors per week in 2019:
38,134 visitors per week
Average number of Blizzard Beach visitors per day in 2019:
5,432 visitors per day
Blizzard Beach attendance total for 2018:
2.003 million visitors
Percentage drop in Blizzard Beach attendance total from 2017-2018:
Average number of blizzard beach visitors per month in 2018:.
166,916 visitors per month
Average number of Blizzard Beach visitors per week in 2018:
38,519 visitors per week
Average number of Blizzard Beach visitors per day in 2018:
5,487 visitors per day
Blizzard Beach attendance total for 2017:
1.945 million visitors
Percentage drop in Blizzard Beach attendance total from 2016-2017:
Average number of blizzard beach visitors per month in 2017:.
162,083 visitors per month
Average number of Blizzard Beach visitors per week in 2017:
37,403 visitors per week
Average number of Blizzard Beach visitors per day in 2017:
5,328 visitors per day
Blizzard Beach attendance total for 2016:
2.1 million visitors
Blizzard Beach attendance total for 2015:
2.1 million visitors
Percentage drop in Blizzard Beach attendance total from 2015-2016:
Typhoon lagoon attendance total for 2022:.
1.915 million visitors
Percentage decrease in Typhoon Lagoon attendance total from 2021-2022:
Average number of typhoon lagoon visitors per month in 2022 (global):.
159,583 visitors per month
Average number of Typhoon Lagoon visitors per week in 2022 (global):
36,827 visitors per week
Average number of Typhoon Lagoon visitors per day in 2022 (global):
5,247 visitors per day
Typhoon Lagoon attendance total for 2021:
0 visitors (closed)
Typhoon Lagoon attendance total for 2020:
Percentage decrease in typhoon lagoon attendance total from 2019-2020:, average number of typhoon lagoon visitors per month in 2020:.
0 visitors per month
Average number of Typhoon Lagoon visitors per week in 2020:
0 visitors per week
Average number of Typhoon Lagoon visitors per day in 2020:
0 visitors per day
Typhoon Lagoon attendance total for 2019:
2.248 million visitors
Percentage drop in Typhoon Lagoon attendance total from 2018-2019:
Average number of typhoon lagoon visitors per month in 2019:.
187,333 visitors per month
Average number of Typhoon Lagoon visitors per week in 2019:
43,230 visitors per week
Average number of Typhoon Lagoon visitors per day in 2019:
6,158 visitors per day
Typhoon Lagoon attendance total for 2018:
2.271 million visitors
Percentage drop in Typhoon Lagoon attendance total from 2017-2018:
Average number of typhoon lagoon visitors per month in 2018:.
189,250 visitors per month
Average number of Typhoon Lagoon visitors per week in 2018:
43,673 visitors per week
Average number of Typhoon Lagoon visitors per day in 2018:
6,221 visitors per day
Typhoon Lagoon attendance total for 2017:
2.163 million visitors
Percentage drop in Typhoon Lagoon attendance total from 2016-2017:
Average number of typhoon lagoon visitors per month in 2017:.
180,250 visitors per month
Average number of Typhoon Lagoon visitors per week in 2017:
41,596 visitors per week
Average number of Typhoon Lagoon visitors per day in 2017:
5,926 visitors per day
Typhoon Lagoon attendance total for 2016:
2.3 million visitors
Typhoon Lagoon attendance total for 2015:
2.3 million visitors
Percentage drop in Typhoon Lagoon attendance total from 2015-2016:
Disneyland attendance statistics, disneyland attendance total for 2022:.
16,881 million visitors
Percentage decrease in Disneyland attendance total from 2021-2022:

Average number of Disneyland visitors per month in 2022 (global):
1.406 million visitors per month
Average number of Disneyland visitors per week in 2022 (global):
324,635 visitors per week
Average number of Disneyland visitors per day in 2022 (global):
46,249 visitors per day
Disneyland attendance total for 2021:
8.573 million visitors
Disneyland attendance total for 2020:
3.674 million visitors
Percentage decrease in Disneyland attendance total from 2019-2020:
Average number of disneyland visitors per month in 2020:, average number of disneyland visitors per week in 2020:, average number of disneyland visitors per day in 2020:, disneyland attendance total for 2019:.
18.67 million visitors
Percentage increase in Disneyland attendance total from 2018-2019:
Average number of disneyland visitors per month in 2019:.
1.555 million visitors per month
Average number of Disneyland visitors per week in 2019:
358,961 visitors per week
Average number of Disneyland visitors per day in 2019:
51,139 visitors per day
Disneyland attendance total for 2018:
Percentage increase in disneyland attendance total from 2017-2018:, average number of disneyland visitors per month in 2018:, average number of disneyland visitors per week in 2018:, average number of disneyland visitors per day in 2018:, disneyland attendance total for 2017:.
18.3 million visitors
Percentage increase in Disneyland attendance total from 2016-2017:
Average number of disneyland visitors per month in 2017:.
1.525 million visitors per month
Average number of Disneyland visitors per week in 2017:
351,923 visitors per week
Average number of Disneyland visitors per day in 2017:
50,136 visitors per day
Disneyland attendance total for 2016:
17.9 million visitors
Disneyland attendance total for 2015:
18.3 million visitors
Percentage drop in Disneyland attendance total from 2015-2016:
Disney california adventure attendance total for 2022:.
9 million visitors
Percentage decrease in Disney California Adventure attendance total from 2021-2022:

Average number of Disney California Adventure visitors per month in 2022 (global):
750,000 visitors per month
Average number of Disney California Adventure visitors per week in 2022 (global):
173,077 visitors per week
Average number of Disney California Adventure visitors per day in 2022 (global):
24,658 visitors per day
Disney California Adventure attendance total for 2021:
4.977 million visitors
Disney California Adventure attendance total for 2020:
1.919 million visitors
Percentage decrease in Disney California Adventure attendance total from 2019-2020:
Average number of disney california adventure visitors per month in 2020:.
159,000 visitors per month
Average number of Disney California Adventure visitors per week in 2020:
37,000 visitors per week
Average number of Disney California Adventure visitors per day in 2020:
5,000 visitors per day
Disney California Adventure attendance total for 2019:
9.861 million visitors
Percentage increase in Disney California Adventure attendance total from 2018-2019:
Average number of disney california adventure visitors per month in 2019:.
821,750 visitors per month
Average number of Disney California Adventure visitors per week in 2019:
189,634 visitors per week
Average number of Disney California Adventure visitors per day in 2019:
27,016 visitors per day
Disney California Adventure attendance total for 2018:
Percentage increase in disney california adventure attendance total from 2017-2018:, average number of disney california adventure visitors per month in 2018:, average number of disney california adventure visitors per week in 2018:, average number of disney california adventure visitors per day in 2018:, disney california adventure attendance total for 2017:.
9.574 million visitors
Percentage increase in Disney California Adventure attendance total from 2016-2017:
Average number of disney california adventure visitors per month in 2017:.
797,833 visitors per month
Average number of Disney California Adventure visitors per week in 2017:
184,115 visitors per week
Average number of Disney California Adventure visitors per day in 2017:
26,320 visitors per day
Disney California Adventure attendance total for 2016:
9.3 million visitors
Disney California Adventure attendance total for 2015:
9.4 million visitors
Percentage drop in Disney California Adventure attendance total from 2015-2016:

Image Credit: Disney
Tokyo Disney Resort attendance total for 2022:
22.1 million visitors
Average number of Tokyo Disney Resort visitors per month in 2022 (global):
1.841 million visitors per month
Average number of Tokyo Disney Resort visitors per week in 2022 (global):
425,000 visitors per week
Average number of Tokyo Disney Resort visitors per day in 2022 (global):
60,548 visitors per day
Tokyo Disney Resort attendance total for 2021:
12.1 million visitors
Tokyo Disney Resort attendance total for 2020:
7.56 million visitors
Average number of Tokyo Disney Resort visitors per month in 2020:
630,000 visitors per month
Average number of Tokyo Disney Resort visitors per week in 2020:
145,000 visitors per week
Average number of Tokyo Disney Resort visitors per day in 2020:
20,000 visitors per day
Tokyo Disney Resort attendance for 2017:
30.1 million visitors
Tokyo Disney Resort attendance for 2016:
30 million visitors
Tokyo Disney Resort attendance for 2015:
30.2 million visitors
Tokyo Disney Resort attendance for 2014:
31.3 million visitors
Tokyo Disneyland attendance total for 2022:
12 million visitors
Percentage decrease in Tokyo Disneyland attendance total from 2021-2022:
Average number of tokyo disneyland visitors per month in 2022 (global):, average number of tokyo disneyland visitors per week in 2022 (global):.
230,769 visitors per week
Average number of Tokyo Disneyland visitors per day in 2022 (global):
32,877 visitors per day
Tokyo Disneyland attendance total for 2021:
6.3 million visitors
Tokyo Disneyland attendance total for 2020:
4.160 million visitors
Percentage decrease in Tokyo Disneyland attendance total from 2019-2020:
Average number of tokyo disneyland visitors per month in 2020:.
346,000 visitors per month
Average number of Tokyo Disneyland visitors per week in 2020:
Average number of tokyo disneyland visitors per day in 2020:, tokyo disneyland attendance total for 2019:.
17.910 million visitors
Percentage increase in Tokyo Disneyland attendance total from 2018-2019:
Average number of tokyo disneyland visitors per month in 2019:.
1.492 million visitors per month
Average number of Tokyo Disneyland visitors per week in 2019:
344,423 visitors per week
Average number of Tokyo Disneyland visitors per day in 2019:
49,068 visitors per day
Tokyo Disneyland attendance total for 2018:
17.907 million visitors
Percentage increase in Tokyo Disneyland attendance total from 2017-2018:
Average number of tokyo disneyland visitors per month in 2018:, average number of tokyo disneyland visitors per week in 2018:.
344,365 visitors per week
Average number of Tokyo Disneyland visitors per day in 2018:
49,060 visitors per day
Tokyo Disneyland attendance total for 2017:
16.6 million visitors
Percentage increase in Tokyo Disneyland attendance total from 2016-2017:
Average number of tokyo disneyland visitors per month in 2017:.
1.383 million visitors per month
Average number of Tokyo Disneyland visitors per week in 2017:
319,230 visitors per week
Average number of Tokyo Disneyland visitors per day in 2017:
45,479 visitors per day
Tokyo Disneyland attendance total for 2016:
16.5 million visitors
Tokyo Disneyland attendance total for 2015:
Percentage drop in tokyo disneyland attendance total from 2015-2016:, tokyo disneysea attendance total for 2022:.
10.1 million visitors
Percentage decrease in Tokyo DisneySea attendance total from 2021-2022:
Average number of tokyo disneysea visitors per month in 2022 (global):.
841,667 visitors per month
Average number of Tokyo DisneySea visitors per week in 2022 (global):
194,231 visitors per week
Average number of Tokyo DisneySea visitors per day in 2022 (global):
27,671 visitors per day
Tokyo DisneySea attendance total for 2021:
5.8 million visitors
Tokyo DisneySea attendance total for 2020:
3.4 million visitors
Percentage decrease in Tokyo DisneySea attendance total from 2019-2020:
Average number of tokyo disneysea visitors per month in 2020:.
283,000 visitors per month
Average number of Tokyo DisneySea visitors per week in 2020:
65,000 visitors per week
Average number of Tokyo DisneySea visitors per day in 2020:
9,000 visitors per day
Tokyo DisneySea attendance total for 2019:
14.650 million visitors
Percentage increase in Tokyo DisneySea attendance total from 2018-2019:
Average number of tokyo disneysea visitors per month in 2019:.
1.22 million visitors
Average number of Tokyo DisneySea visitors per week in 2019:
281,730 visitors
Average number of Tokyo DisneySea visitors per day in 2019:
40,136 visitors
Tokyo DisneySea attendance total for 2018:
14.651 million visitors
Percentage increase in Tokyo DisneySea attendance total from 2017-2018:
Average number of tokyo disneysea visitors per month in 2018:, average number of tokyo disneysea visitors per week in 2018:.
281,750 visitors
Average number of Tokyo DisneySea visitors per day in 2018:
40,139 visitors
Tokyo DisneySea attendance total for 2017:
13.5 million visitors
Percentage increase in Tokyo DisneySea attendance total from 2016-2017:
Average number of tokyo disneysea visitors per month in 2017:.
1.125 million visitors
Average number of Tokyo DisneySea visitors per week in 2017:
259,615 visitors
Average number of Tokyo DisneySea visitors per day in 2017:
36,986 visitors
Tokyo DisneySea attendance total for 2016:
13.46 million visitors
Tokyo DisneySea attendance total for 2015:
13.6 million visitors
Percentage drop in Tokyo DisneySea attendance total from 2015-2016:
Disneyland paris attendance total for 2022:.
9.930 million visitors
Percentage decrease in Disneyland Paris attendance total from 2021-2022:

Average number of Disneyland Paris visitors per month in 2022 (global):
827,500 visitors per month
Average number of Disneyland Paris visitors per week in 2022 (global):
190,962 visitors per week
Average number of Disneyland Paris visitors per day in 2022 (global):
27,205 visitors per day
Disneyland Paris attendance total for 2021:
3.5 million visitors
Disneyland Paris attendance total for 2020:
4.03 million visitors
Average number of Disneyland Paris visitors per month in 2020:
335,000 visitors per month
Average number of Disneyland Paris visitors per week in 2020:
Average number of disneyland paris visitors per day in 2020:, disneyland paris attendance total for 2019:.
9.745 million visitors
Percentage increase in Disneyland Paris attendance total from 2018-2019:
Average number of disneyland paris visitors per month in 2019:.
812,083 visitors per month
Average number of Disneyland Paris visitors per week in 2019:
187,403 visitors per week
Average number of Disneyland Paris visitors per day in 2019:
26,698 visitors per day
Disneyland Paris attendance total for 2018:
9.843 million visitors
Percentage increase in Disneyland Paris attendance total from 2017-2018:
Average number of disneyland paris visitors per month in 2018:.
820,250 visitors per month
Average number of Disneyland Paris visitors per week in 2018:
189,288 visitors per week
Average number of Disneyland Paris visitors per day in 2018:
26,967 visitors per day
Disneyland Paris attendance total for 2017:
9.6 million visitors
Percentage increase in Disneyland Paris attendance total from 2016-2017:
Average number of disneyland paris visitors per month in 2017:.
800,000 visitors per month
Average number of Disneyland Paris visitors per week in 2017:
184,615 visitors per week
Average number of Disneyland Paris visitors per day in 2017:
26,301 visitors per day
Disneyland Paris attendance total for 2016:
8.4 million visitors
Disneyland Paris attendance total for 2015:
9.8 million visitors
Percentage drop in Disneyland Paris attendance total from 2015-2016:
Hong kong disneyland attendance total for 2022:, percentage decrease in hong kong disneyland attendance total from 2021-2022:, average number of hong kong disneyland visitors per month in 2022 (global):.
283,333 visitors per month
Average number of Hong Kong Disneyland visitors per week in 2022 (global):
65,385 visitors per week
Average number of Hong Kong Disneyland visitors per day in 2022 (global):
9,315 visitors per day
Hong Kong Disneyland attendance total for 2021:
2.8 million visitors
Hong Kong Disneyland attendance total for 2020:
1.7 million visitors
Percentage decrease in Hong Kong Disneyland attendance total from 2019-2020:
Average number of hong kong disneyland visitors per month in 2020:.
141,000 visitors per month
Average number of Hong Kong Disneyland visitors per week in 2020:
32,000 visitors per week
Average number of Hong Kong Disneyland visitors per day in 2020:
4,000 visitors per day
Hong Kong Disneyland attendance total for 2019:
5.695 million visitors
Percentage increase in Hong Kong Disneyland attendance total from 2018-2019:
Average number of hong kong disneyland visitors per month in 2019:.
474,583 visitors per month
Average number of Hong Kong Disneyland visitors per week in 2019:
109,519 visitors per week
Average number of Hong Kong Disneyland visitors per day in 2019:
15,602 visitors per day
Hong Kong Disneyland attendance total for 2018:
6.7 million visitors
Percentage increase in Hong Kong Disneyland attendance total from 2017-2018:
Average number of hong kong disneyland visitors per month in 2018:.
558,333 visitors per month
Average number of Hong Kong Disneyland visitors per week in 2018:
128,846 visitors per week
Average number of Hong Kong Disneyland visitors per day in 2018:
18,356 visitors per day
Hong Kong Disneyland attendance total for 2017:
6.2 million visitors
Percentage increase in Hong Kong Disneyland attendance total from 2016-2017:
Average number of hong kong disneyland visitors per month in 2017:.
516,700 visitors per month
Average number of Hong Kong Disneyland visitors per week in 2017:
119,230 visitors per week
Average number of Hong Kong Disneyland visitors per day in 2017:
16,986 visitors per day
Number of international guests at Hong Kong Disneyland in 2017:
1.6 million visitors
Hong Kong Disneyland attendance total for 2016:
6.1 million visitors
Hong Kong Disneyland attendance total for 2015:
6.8 million visitors
Percentage drop in Hong Kong Disneyland attendance total from 2015-2016:
Shanghai disney resort attendance total for 2022:.
5.3 million visitors
Percentage decrease in Shanghai Disney Resort attendance total from 2021-2022:
Average number of shanghai disney resort visitors per month in 2022 (global):.
441,667 visitors per month
Average number of Shanghai Disney Resort visitors per week in 2022 (global):
101,923 visitors per week
Average number of Shanghai Disney Resort visitors per day in 2022 (global):
14,521 visitors per day
Shanghai Disney Resort attendance total for 2021:
8.48 million visitors
Shanghai Disney Resort attendance total for 2020:
5.5 million visitors
Percentage decrease in Shanghai Disney Resort attendance total from 2019-2020:
Average number of shanghai disney resort visitors per month in 2020:.
458,000 visitors per month
Average number of Shanghai Disney Resort visitors per week in 2020:
105,000 visitors per week
Average number of Shanghai Disney Resort visitors per day in 2020:
15,000 visitors per day
Shanghai Disney Resort attendance total for 2019:
11.210 million visitors
Percentage increase in Shanghai Disney Resort attendance total from 2018-2019:
Average number of shanghai disney resort visitors per month in 2019:.
934,167 visitors per month
Average number of Shanghai Disney Resort visitors per week in 2019:
215,576 visitors per week
Average number of Shanghai Disney Resort visitors per day in 2019:
30,712 visitors per day
Shanghai Disney Resort attendance total for 2018:
Percentage increase in shanghai disney resort attendance total from 2017-2018:, average number of shanghai disney resort visitors per month in 2018:.
983,333 visitors per month
Average number of Shanghai Disney Resort visitors per week in 2018:
226,923 visitors per week
Average number of Shanghai Disney Resort visitors per day in 2018:
32,328 visitors per day
Shanghai Disney Resort attendance total for 2017:
11 million visitors
Percentage increase in Shanghai Disney Resort attendance total from 2016-2017:
Average number of shanghai disney resort visitors per month in 2017:.
916,700 visitors per month
Average number of Shanghai Disney Resort visitors per week in 2017:
211,538 visitors per week
Average number of Shanghai Disney Resort visitors per day in 2017:
30,136 visitors per day
Shanghai Disney Resort attendance total for 2016:
5.6 million visitors
For more Disney Statistics, please visit the following articles:
- Disney Company and Walt Disney Facts and Stats
- Disney Revenue Statistics
- Disney Interactive Statistics
- Disney TV Statistics
- ESPN Statistics
- Disney World Statistics
- Disneyland Statistics
- Shanghai Disney Statistics
- Disneyland Paris Statistics
- Tokyo Disney Resort Statistics
- Hong Kong Disneyland Resort Statistics
- Disney Movie Statistics
- Star Wars Statistics
- Marvel Statistics
- Disney Park Attendance Statistics
- Disney Vacation Club Statistics
- Disney Cruise Line Statistics
- Aulani Statistics
- Walt Disney Imagineering Statistics
- Important Dates in Disney History
- Facts About Mickey Mouse
- Epcot Fun Facts and Statistics
Disney Park(s) in this Post:
Get a free disney vacation quote.
Book your 2024 Disney vacation package now! With availability at great rates, don't miss out on the opportunity to experience the magic of Disney.
Contact us today to see what options are available to you!
About the Author

Craig Smith
- Annual Disney Park Attendance Statistics
- Disney Parks News
- Disney Parks Featured Articles
- Disney World Ride Closures
- Disney World History
- Disney World News
- Magic Kingdom Park Info News and Attractions
- Epcot Attractions News and History
- Disney’s Hollywood Studios Info News and Attractions
- Disney’s Animal Kingdom Info News and Attractions
- Disney Springs News and Attractions
- Disney’s Typhoon Lagoon Info News and Attractions
- Disney’s Blizzard Beach Info News and Attractions
- Disney World at Halloween
- Disney World at Christmas
- Disneyland Ride Closures
- Disneyland Weather Forecast
- Disneyland History
- Christmas at Disneyland
- Disneyland News
- Disneyland Park Info News and Attractions
- Disney California Adventure Park Info News and Attractions
- Downtown Disney Info News and Attractions
- Disneyland Paris
- Shanghai Disney
- Hong Kong Disneyland
- Tokyo Disneyland
- Disney Cruise Line
- Disney Vacation Club
- Upcoming Disney Movies
- Pixar Facts
- Disney Movie Featured Articles
- Marvel News
- Marvel Facts
- Star Wars News
- Disney+ Upcoming Movies and Shows
- Hulu Upcoming Shows and Movies
- Disney+ Statistics
- Disney TV & Streaming Articles
- Disney TV News
- Star Wars Characters
- Disney Products
- Disney Lorcana
- Disney Songs
- Disney News
- Sports & Recreation ›
- Parks & Outdoors
Industry-specific and extensively researched technical data (partially from exclusive partnerships). A paid subscription is required for full access.
Walt Disney World Magic Kingdom theme park attendance 2009-2022
Theme parks - additional information, attendance at the magic kingdom theme park (walt disney world florida) from 2009 to 2022 (in millions).
- Immediate access to 1m+ statistics
- Incl. source references
- Download as PNG, PDF, XLS, PPT
Additional Information
Show sources information Show publisher information Use Ask Statista Research Service
United States
2009 to 2021
Facility is gated (entry ticket required). Figures have been rounded.
Other statistics on the topic
Biggest companies in the world by market value 2023
TV, Video & Film
Revenue of the Walt Disney Company in 2023, by operating segment
Total assets of The Walt Disney Company 2006-2023
Quarterly Disney+ subscribers count worldwide 2020-2024
To download this statistic in XLS format you need a Statista Account
To download this statistic in PNG format you need a Statista Account
To download this statistic in PDF format you need a Statista Account
To download this statistic in PPT format you need a Statista Account
As a Premium user you get access to the detailed source references and background information about this statistic.
As a Premium user you get access to background information and details about the release of this statistic.
As soon as this statistic is updated, you will immediately be notified via e-mail.
… to incorporate the statistic into your presentation at any time.
You need at least a Starter Account to use this feature.
- Immediate access to statistics, forecasts & reports
- Usage and publication rights
- Download in various formats
You only have access to basic statistics. This statistic is not included in your account.
- Instant access to 1m statistics
- Download in XLS, PDF & PNG format
- Detailed references
Business Solutions including all features.
Other statistics that may interest you
- Walt Disney World Epcot theme park attendance 2009-2022
- Walt Disney World Animal Kingdom theme park attendance 2009-2022
- Walt Disney World Hollywood Studios Florida theme park attendance 2009-2022
- Disneyland theme park (California) attendance 2009-2022
- Tokyo Disneyland theme park attendance 2013-2022
- Disney's California Adventure theme park attendance 2009-2022
- Tokyo Disney Sea theme park attendance 2013-2022
- Most visited amusement and theme parks in North America 2022
- Disneyland Paris Walt Disney Studios Park theme park attendance in France 2010-2022
- Universal Orlando Islands of Adventure theme park attendance 2009-2022
- Universal Studios Orlando theme park attendance 2009-2022
- Seaworld Florida theme park attendance 2009-2022
- Universal Studios Hollywood theme park attendance 2009-2022
- Seaworld California theme park attendance 2009-2022
- Busch Gardens Tampa Bay theme park attendance 2009-2022
- Most visited public libraries in the U.S. in 2012
- Number of spa visits in the U.S. 2008-2022
- Number of visitor arrivals from the U.S. to Macao 2013-2023, by transport mode
- Leading real estate websites in the U.S. 2023, by monthly visits
- Lotte World Adventure theme park attendance South Korea 2009-2022
- Ocean Park Hong Kong theme park attendance 2009-2022
- Change in attendance at amusement and theme parks in Europe 2019-2022
- Most visited amusement and theme parks APAC 2019-2021
- Most visited Latin American amusement and theme parks 2019-2022
- Percentage change in amusement and theme park attendance in North America 2019-2022
- Change in attendance at amusement and theme parks worldwide 2019-2022, by facility
- Shanghai Disneyland theme park attendance in China 2016-2022
- Hong Kong Disneyland theme park attendance 2009-2022
- Tokyo Disneyland and DisneySea theme park attendance Japan FY 2013-2022
- Legoland Windsor theme park attendance in the United Kingdom (UK) 2009-2022
- Europa Park Rust theme park attendance in Germany 2009-2022
- De Efteling theme park attendance in Netherlands 2009-2022
- Everland theme park attendance South Korea 2009-2022
- Fantasilandia number of visitors 2012-2019
- Leisure and theme park attendance in England 2017, by attraction
- Alton Towers theme park attendance in the United Kingdom (UK) 2009-2022
- Most visited amusement and theme parks worldwide 2019-2022
- Merlin Entertainments global attendance growth 2012-2022
- Most visited amusement and theme parks in Europe 2019-2022
- Thorpe Park theme park attendance in the United Kingdom (UK) 2009-2022
- Chessington World of Adventures theme park attendance in the UK 2009-2022
- Attendance to Tivoli Gardens 2010-2020
- Italy: most visited amusement parks 2019
- Growth of attendance at amusement parks worldwide 2010
- Merlin Entertainments attendance worldwide 2011-2022
Other statistics that may interest you Statistics on
About the industry
- Premium Statistic Walt Disney World Epcot theme park attendance 2009-2022
- Premium Statistic Walt Disney World Animal Kingdom theme park attendance 2009-2022
- Premium Statistic Walt Disney World Hollywood Studios Florida theme park attendance 2009-2022
- Premium Statistic Disneyland theme park (California) attendance 2009-2022
- Basic Statistic Tokyo Disneyland theme park attendance 2013-2022
- Premium Statistic Disney's California Adventure theme park attendance 2009-2022
- Premium Statistic Tokyo Disney Sea theme park attendance 2013-2022
- Premium Statistic Most visited amusement and theme parks in North America 2022
- Premium Statistic Disneyland Paris Walt Disney Studios Park theme park attendance in France 2010-2022
About the region
- Premium Statistic Universal Orlando Islands of Adventure theme park attendance 2009-2022
- Premium Statistic Universal Studios Orlando theme park attendance 2009-2022
- Premium Statistic Seaworld Florida theme park attendance 2009-2022
- Premium Statistic Universal Studios Hollywood theme park attendance 2009-2022
- Premium Statistic Seaworld California theme park attendance 2009-2022
- Premium Statistic Busch Gardens Tampa Bay theme park attendance 2009-2022
- Basic Statistic Most visited public libraries in the U.S. in 2012
- Basic Statistic Number of spa visits in the U.S. 2008-2022
- Premium Statistic Number of visitor arrivals from the U.S. to Macao 2013-2023, by transport mode
- Premium Statistic Leading real estate websites in the U.S. 2023, by monthly visits
Selected statistics
- Premium Statistic Lotte World Adventure theme park attendance South Korea 2009-2022
- Premium Statistic Ocean Park Hong Kong theme park attendance 2009-2022
- Premium Statistic Change in attendance at amusement and theme parks in Europe 2019-2022
- Basic Statistic Most visited amusement and theme parks APAC 2019-2021
- Premium Statistic Most visited Latin American amusement and theme parks 2019-2022
- Premium Statistic Percentage change in amusement and theme park attendance in North America 2019-2022
Other regions
- Basic Statistic Change in attendance at amusement and theme parks worldwide 2019-2022, by facility
- Premium Statistic Shanghai Disneyland theme park attendance in China 2016-2022
- Premium Statistic Hong Kong Disneyland theme park attendance 2009-2022
- Premium Statistic Tokyo Disneyland and DisneySea theme park attendance Japan FY 2013-2022
- Premium Statistic Legoland Windsor theme park attendance in the United Kingdom (UK) 2009-2022
- Premium Statistic Europa Park Rust theme park attendance in Germany 2009-2022
- Premium Statistic De Efteling theme park attendance in Netherlands 2009-2022
- Premium Statistic Everland theme park attendance South Korea 2009-2022
- Premium Statistic Fantasilandia number of visitors 2012-2019
- Premium Statistic Leisure and theme park attendance in England 2017, by attraction
Related statistics
- Premium Statistic Alton Towers theme park attendance in the United Kingdom (UK) 2009-2022
- Basic Statistic Most visited amusement and theme parks worldwide 2019-2022
- Premium Statistic Merlin Entertainments global attendance growth 2012-2022
- Premium Statistic Most visited amusement and theme parks in Europe 2019-2022
- Premium Statistic Thorpe Park theme park attendance in the United Kingdom (UK) 2009-2022
- Premium Statistic Chessington World of Adventures theme park attendance in the UK 2009-2022
- Premium Statistic Attendance to Tivoli Gardens 2010-2020
- Premium Statistic Italy: most visited amusement parks 2019
- Basic Statistic Growth of attendance at amusement parks worldwide 2010
- Premium Statistic Merlin Entertainments attendance worldwide 2011-2022
Further related statistics
- Premium Statistic Attendance at U.S. nonprofit professional theatres 2002-2013
- Premium Statistic Most visited art museums worldwide 2019-2023
- Basic Statistic Popular music concerts: total attendance in the U.S. 2003-2013
- Basic Statistic Millions of U.S. adults visiting art/craft fairs and festivals in the U.S. 2002-2008
Further Content: You might find this interesting as well
- Attendance at U.S. nonprofit professional theatres 2002-2013
- Most visited art museums worldwide 2019-2023
- Popular music concerts: total attendance in the U.S. 2003-2013
- Millions of U.S. adults visiting art/craft fairs and festivals in the U.S. 2002-2008
Disney Generates Billions in the Florida Economy. Here’s How Much
“From day one, the experience and the relationship that Disney has offered us is better than anything I’ve ever seen.”
James Petrakis—the owner of the Polite Pig at Disney Springs at the Walt Disney World Resort in Orlando, Florida—is just one small business owner who has seen his business transformed by the economic impact of The Walt Disney Company.
But he’s not alone.
Walt Disney World Resort —one of the world’s most popular vacation destinations—generated $40 billion in economic impact across the state of Florida and more than a quarter of a million total jobs in fiscal year 2022. That’s according to a new study from Oxford Economics , which was announced on Tuesday.
The study noted that Disney—which has boosted Florida’s economy, tourism, and small businesses for the last 50 years—has generated 263,000 direct and indirect jobs in the state. That’s 1 out of every 32 jobs in Florida, including Disney’s workforce of 82,000 across the state.
In fact, the study showed that without Disney’s impact, Florida’s unemployment rate would jump from 3% to 5.4%. The company also generates $6.6 billion in tax revenue.
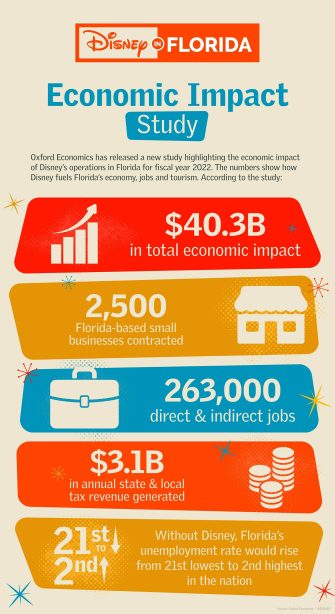
For Petrakis, his business is just one of the 2,500 Florida-based small businesses contracted to supply products and services to Disney World.
“Our business has grown in the last three years by about 25 to 30%,” he said. “We are pushing numbers that we never expected out of fast casual.”
The study—which was commissioned by Disney—also reflects the economic impact of Disney Signature Experiences in Florida, including Disney Vacation Club and Disney Cruise Line. However, Disney’s impact is felt throughout a wide range of goods and services — everything from the painters who help maintain Cinderella Castle to the vendors who supply some of the treats in the parks.
“I am incredibly proud of how Disney has created meaningful change and benefitted people’s lives in Florida for generations, not just in establishing our area’s theme park industry, but also in how we have worked with other sectors across the state to do the same,” said Jeff Vahle, President of Walt Disney World Resort. “The numbers speak for themselves on why Disney is so important to fueling jobs, the economy and tourism throughout our region, and the future investments we’re looking to make will continue to provide even more opportunities for Floridians.”
Disney also gives back to Florida nonprofits by contributing hundreds of millions of dollars throughout its history.
Last month, the company announced another round of donations totaling $1.5 million going to 19 organizations. In fiscal year 2022, Disney cast members donated more than 233,000 volunteer hours in Florida.
However, Disney’s impact on small businesses isn’t just on the east coast.

Anita Ron—CEO of California-based commercial cleaning company BriteWorks, Inc.—worked with Disney to help the construction clean-up efforts of Star Wars: Galaxy’s Edge at the Disneyland Resort in Anaheim, CA.
“Working with Disneyland Resort has impacted our company because we created jobs,” Ron said. “Working with Disneyland Resort helps us create more opportunities within our communities.”
And as Disney continues to invest in Experiences, so does its investment in small businesses.
Disney announced in September that it’s developing plans to accelerate and expand investment in its Experiences segment to nearly double capital expenditures over the course of approximately 10 years to roughly $60 billion.

Disney World Visitor Statistics 2022
Disney World is an expansive place and it has a reach far beyond little girls who love princesses. It is a place for the young and the young at heart!
When planning a Walt Disney World Vacation, you may be wondering what you will encounter when you are there. Will there be couples? Families? Little kids? Which park will be the busiest? When do people go?
Disney With Daves Daughters has conducted some surveys among over a thousand Disney fans to get information that will help you – and us! – know what to expect on your next Walt Disney World Vacation.
A note about our surveys: We conducted surveys in Facebook groups for people who are planning Walt Disney World vacations. The respondents are adults with computer and internet access. The respondents are people who have recently been to Walt Disney World or are about to go.
Let’s jump in.

Check out what's in this post!
What Disney Park is The Most Popular?
One of the most common questions is this one: what Disney Park is the most popular? There are four parks to choose from – Disney’s Magic Kingdom, EPCOT, Hollywood Studios, and Disney’s Animal Kingdom.
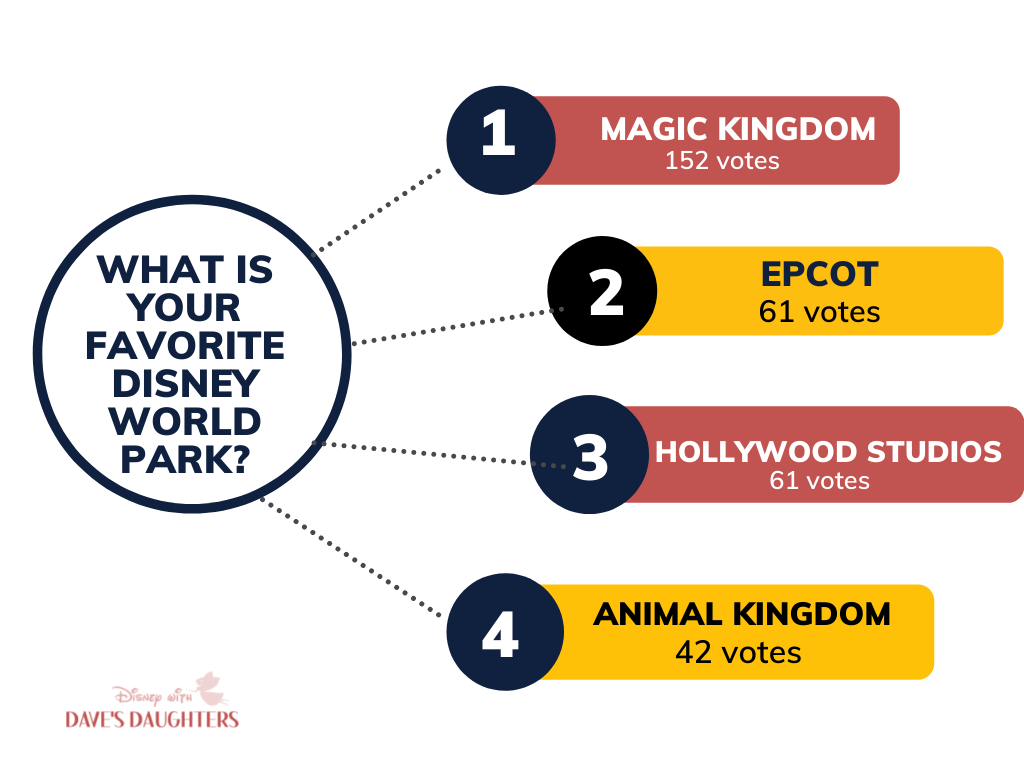
We surveyed 256 people who have recently been to Walt Disney World and asked them “What is your favorite park at Walt Disney World?”
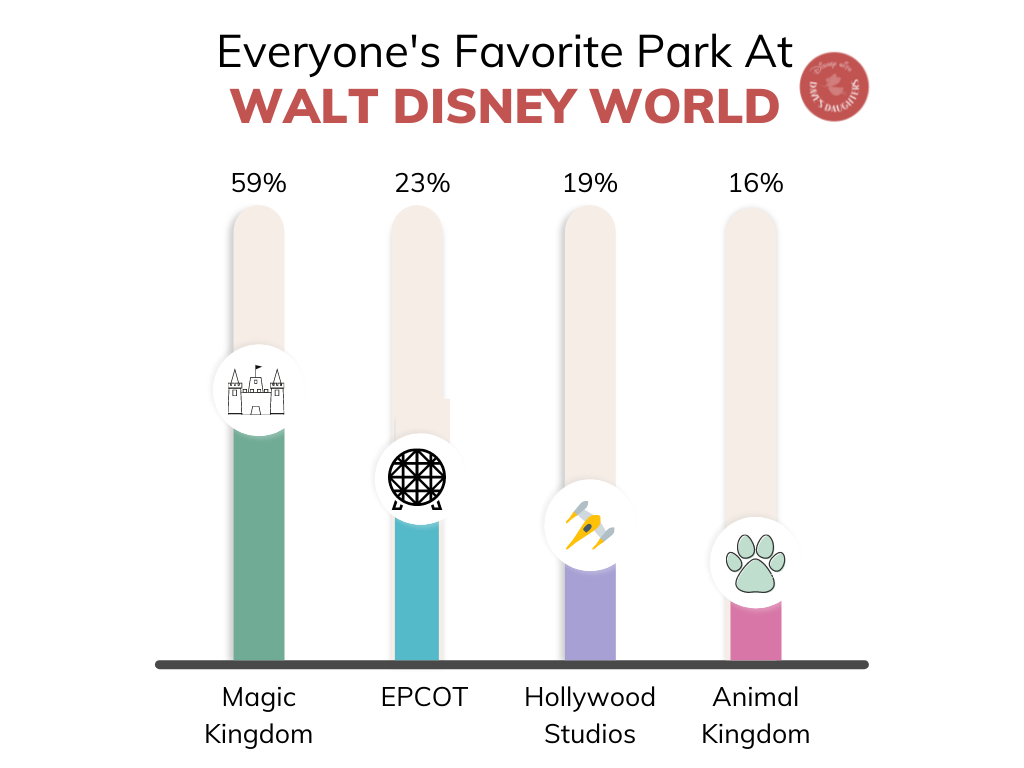
Magic Kingdom is the clear winner. 152 respondents said that the Magic Kingdom is their favorite park. Most love it because it is “classic Disney” – it has Cinderella’s castle and the classic Disney attractions.
EPCOT came in second with 61 vote, Hollywood Studios had 51 votes, and Disney’s Animal Kingdom had 42 votes.
It will be interesting to see how these change in the coming years. Hollywood Studios has been updated in the last several years with Toy Story Land and Star Wars – as more and more people experience these two worlds we wonder if more people will find Hollywood Studios to become more attractive.
EPCOT does seem to be the favorite park for adults who are visiting Disney World without kids. You can find out more about that here .
EPCOT is undergoing construction as of this writing and we wonder if it will become a new family favorite – or if it will continue to be the best place for adults to visit!
Things brings us to our next survey question:
Do You Bring Kids to Disney World?
We had 1,154 people respond to this question. People feel very strongly about kids and Walt Disney World.
We asked “How many kids will you be taking on your next Disney trip?” Answer options: 0, 1, 2, 3, 4, 5 or more
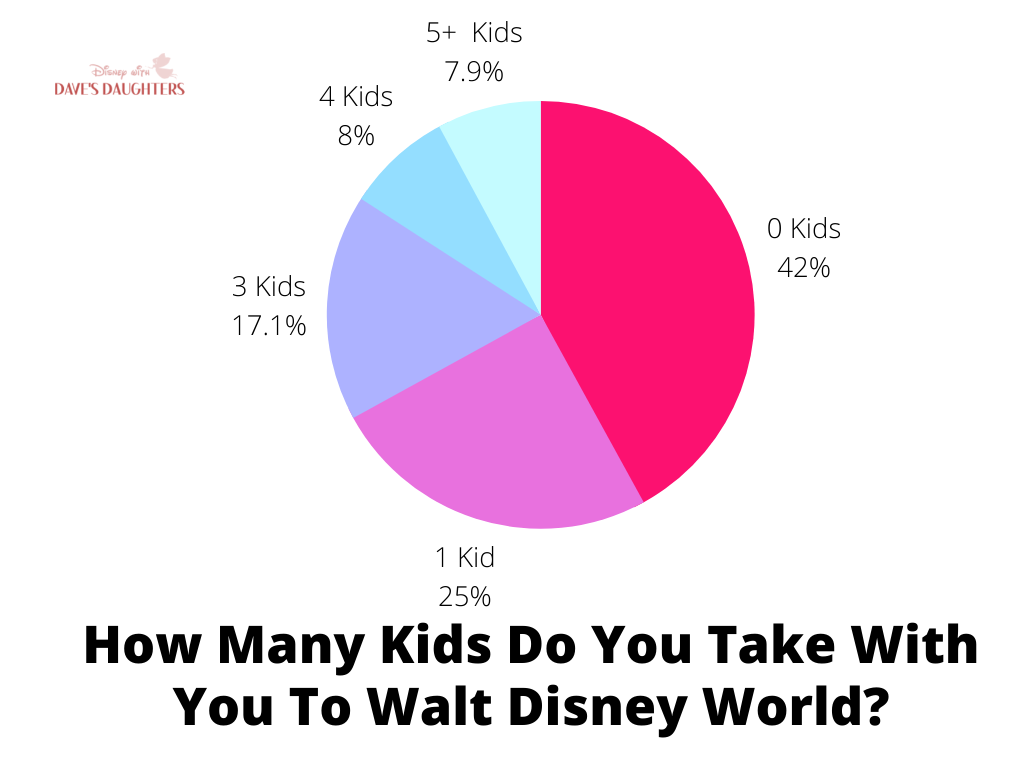
Does this surprise you as much as it surprised us? 42% of respondents – 336 people – said they are not taking ANY kids with them on their next trip to Walt Disney World!
Another 42 percent of respondents take 1-3 kids with them to Disney. 200 people said they will be taking one child with them, 354 said two kids, and 137 people said they will be taking 3 kids with them on their next trip.
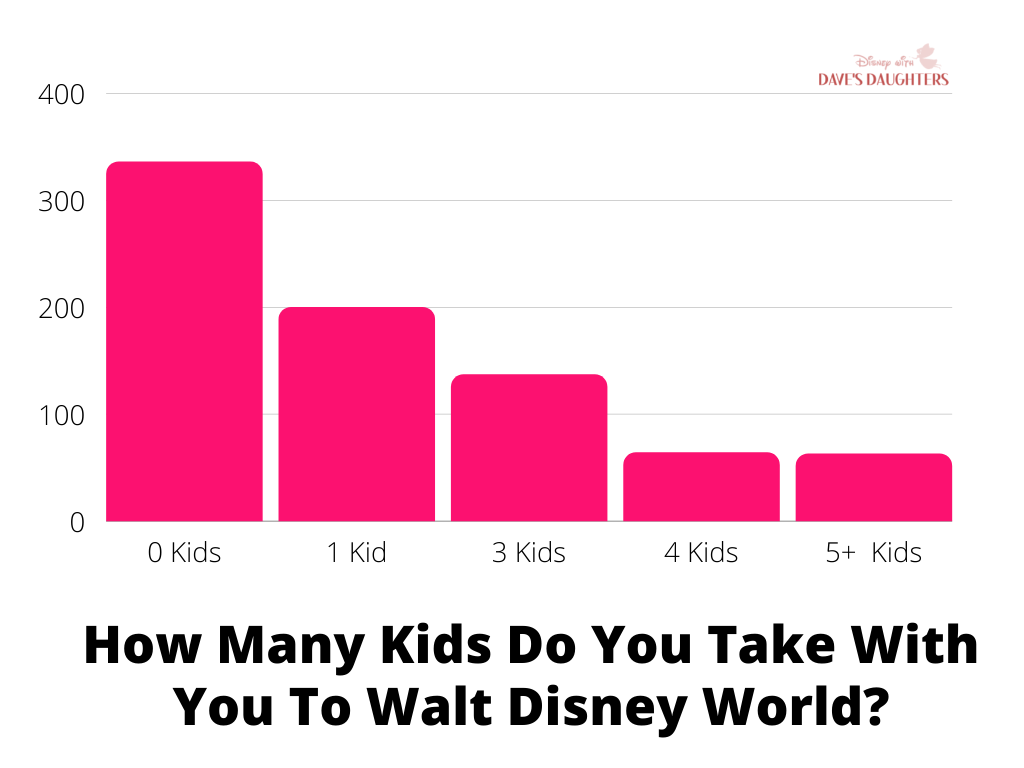
A smaller percentage take more than three kids. 64 people said they will be taking four kids with them on their next Disney trip, and 63 respondents said 5 or more kids. Those are mostly larger families or multiple family groups.
This brings us to our next survey question:
What Age Range Best Describes The Ages of Kids You Will Bring With You to Disney World?
We had a huge response to this question as well. We had 1,247 people respond. People are very opinionated about what ages of kids should – or should not – go to Disney World!
Our response options were:
- Toddler/Preschool
- Middle School
- High School
Unsurprisingly, almost 2/3 of people who bring kids to Disney World are between the ages of 1 and fifth grade. Personally, early elementary is our favorite age of kids to bring to Disney World!
We think five years old is the best age! They’re old enough to remember it and young enough for the magic to be extra special. We have been to Disney World with little kids, as adults with no kids, and with babies. In our opinion, no age is right or wrong age of kids to take to Disney World, but clearly there is a popular age range. Toddler and Elementary age kids would also find the Magic Kingdom to be the most fun, which could factor in to the Magic Kingdom also being the favorite park.
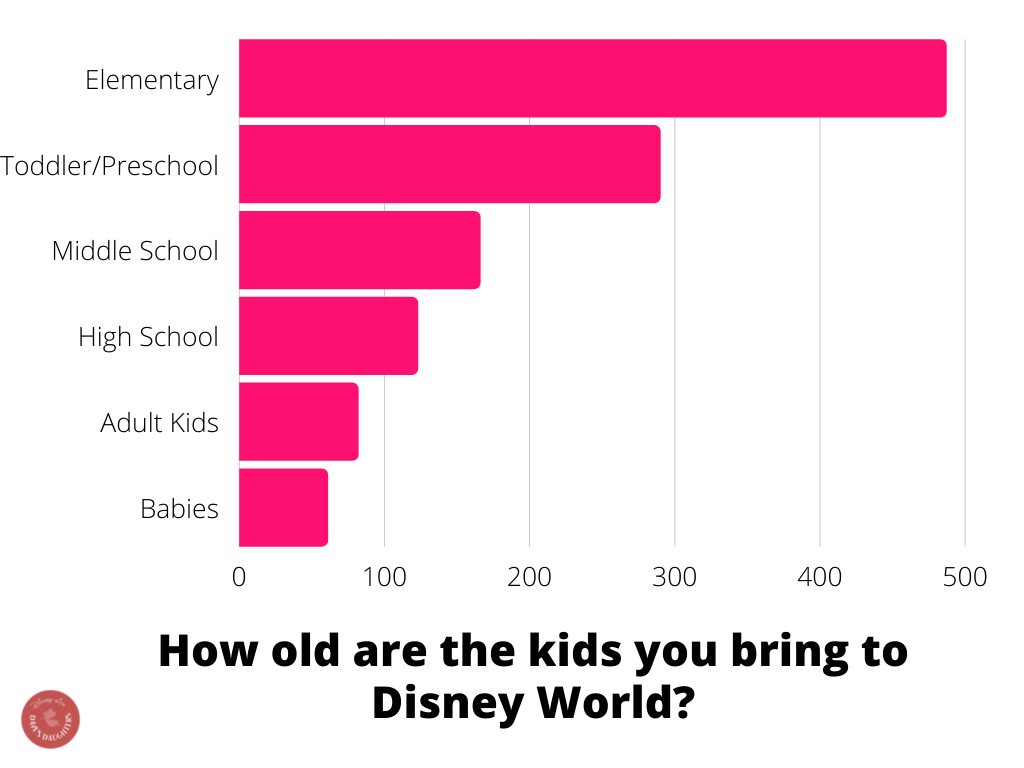
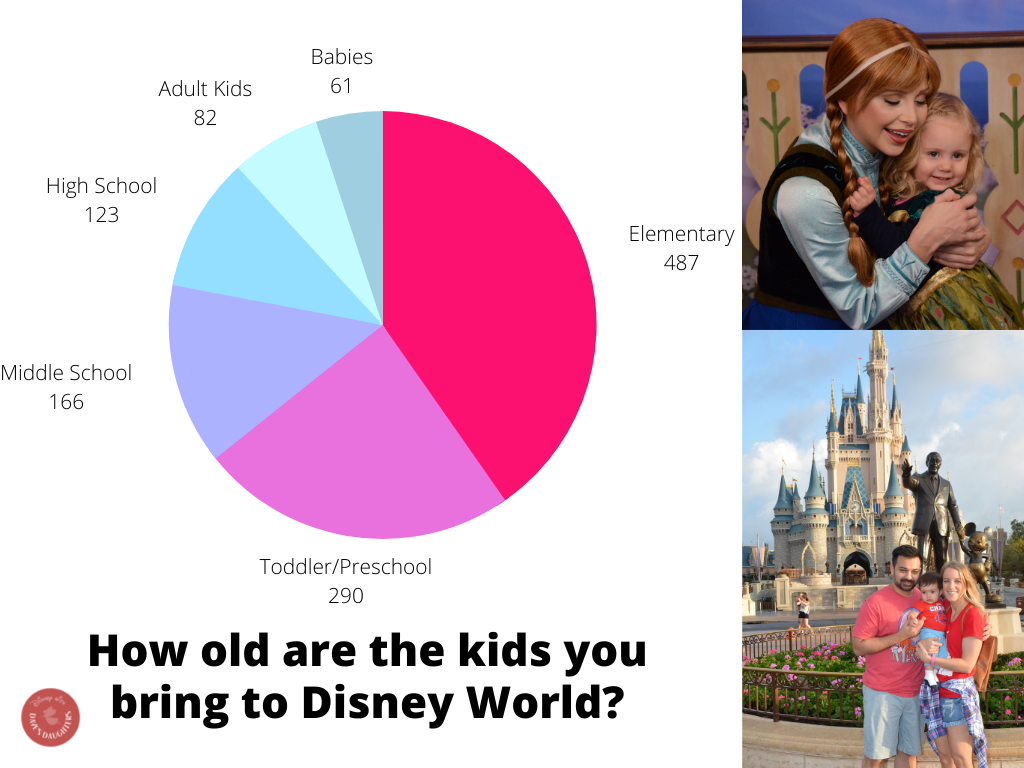
Lets break down the actual numbers. 487 respondents said they bring elementary age kids to Disney World and 290 said toddler/preschool. If you are one of the almost 25% of people bringing toddlers to Disney World, you will want to check out this post! It has everything you need to know about going to Disney with small kids.
As far as older kids go – 166 people said they will take middle school age kids, 123 said high school age, and 82 said adult kids! Only 61 people said they take babies to Disney World.
We were curious as to where people stay when they visit Walt Disney World. With the plethora of hotel options out there, what works for people?
On Your Last Disney Trip, Where Did You Stay?
We had 248 people respond to this survey question. We wanted to find out if people stay on or off site .
We also wanted to know which tier of hotel people chose if they stayed on site.
The answer options were:
- Off site hotel
- Airbnb/VRBO/similar
- Value Disney Resort
- Moderate Disney Resort
- Deluxe Disney Resort
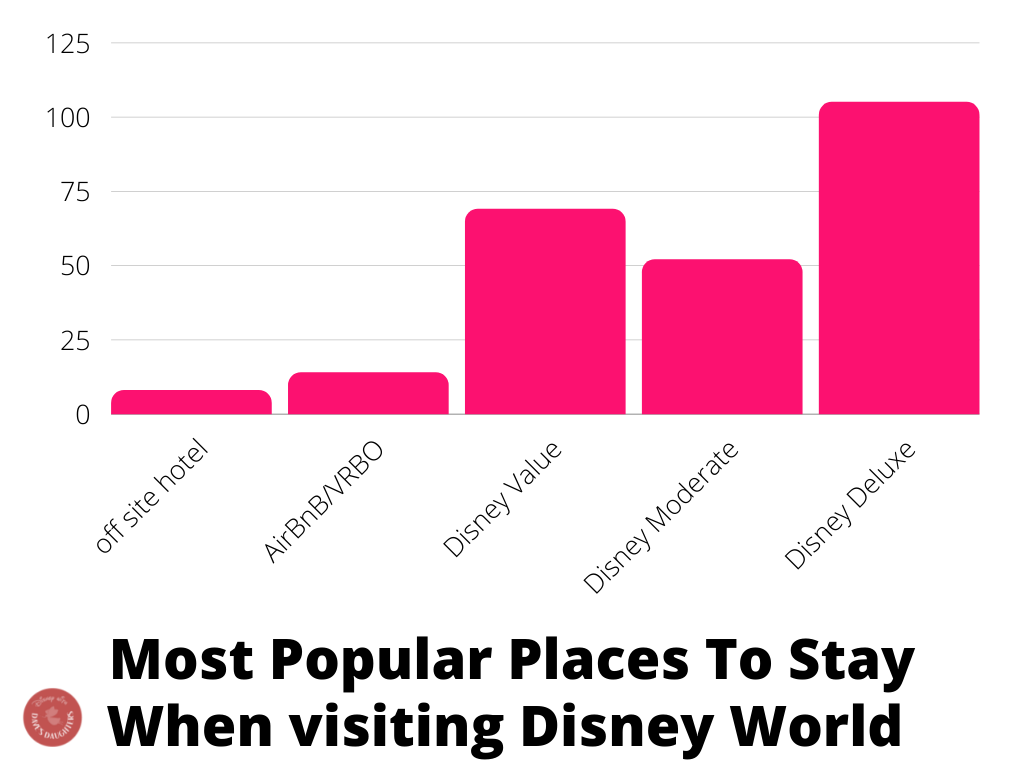
The VAST majority of people stay on the Walt Disney World properties, and of those, they stay at the Deluxe hotels. There are definite perks to choosing the Deluxe hotels (including extra evening hours at the parks), but the price can make these out of reach for many people.
Here is how the numbers broke down for us:
- 8 people said they stayed at an off site hotel
- 14 people said they stayed at an Airbnb, VRBO, or similar accomodations
- 69 people stayed at a Disney Value hotel
- 52 people stayed at a Disney Moderate hotel
- 105 people stayed at a Disney Deluxe hotel
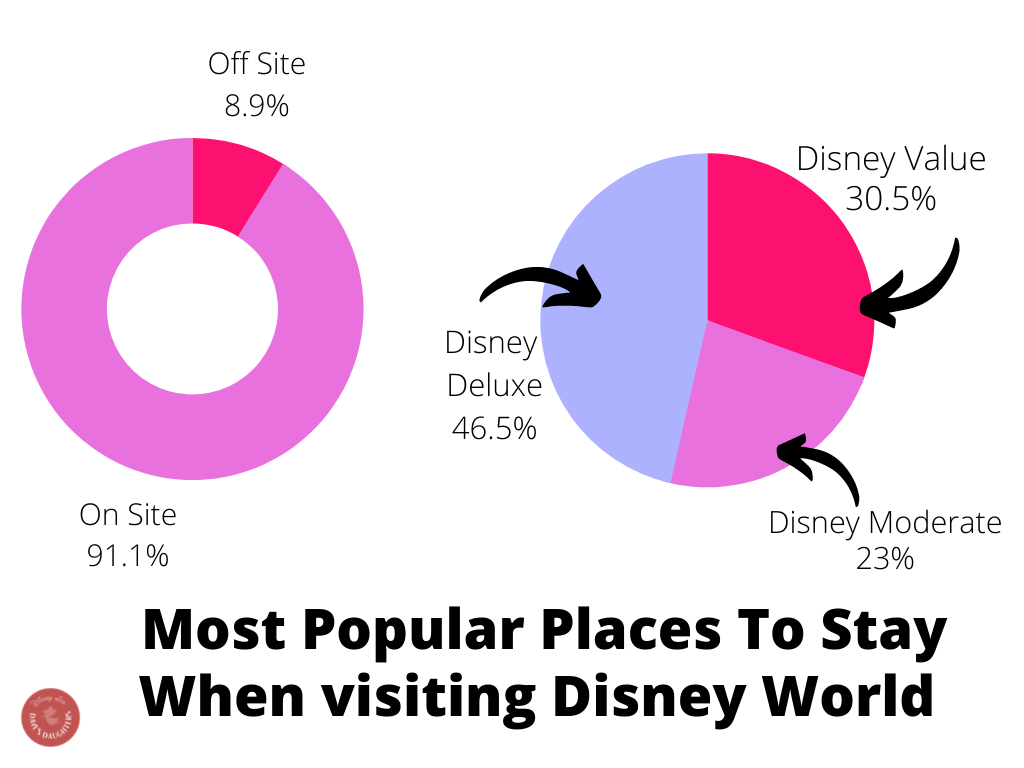
As you can see, over 90% of respondents stayed on site at Disney World. Of those, 46% of people stayed at a Walt Disney World Deluxe Resort. Where people choose to stay is dependent upon many factors, including price, kids , and proximity to the parks.
This brings us to our last survey question.
When Do You Plan To Visit Walt Disney World?
We had 478 people respond to this question. Our answer options were:
- EPCOT’s Food and Wine festival
- Spring Break
- Run Disney Event
- Other Disney Event
- Other time of year
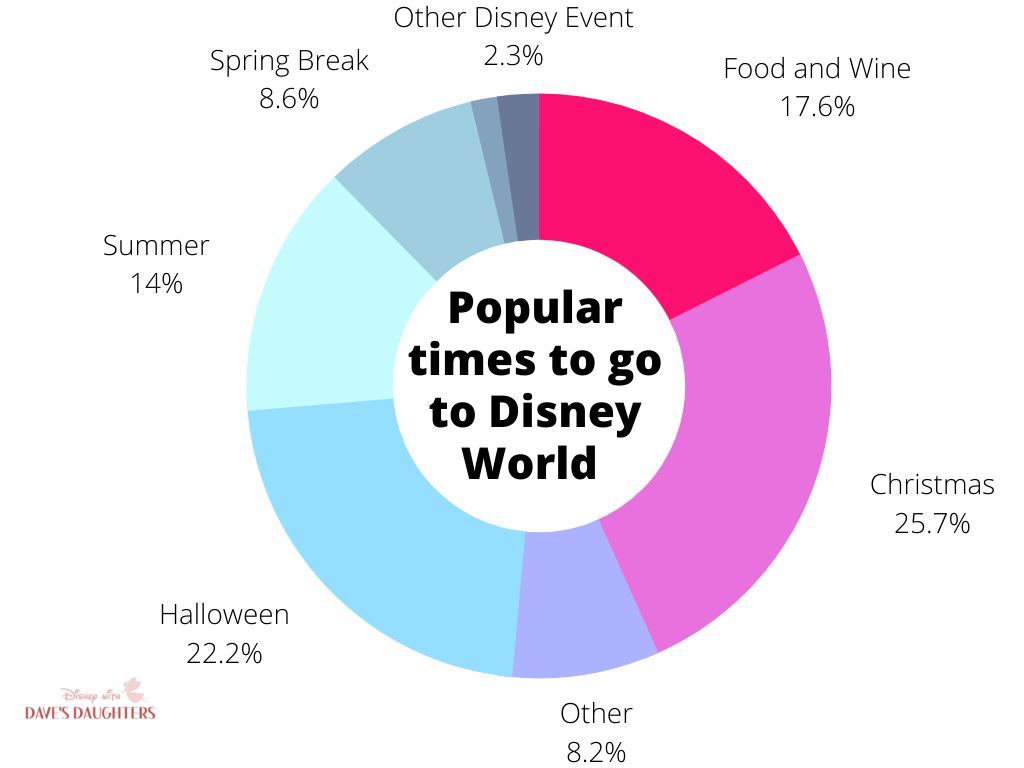
These answers fit with our Disney Crowd Calendar predictions. Summer used to be the absolute worst time to go (as far as crowds are concerned). It is now not as bad as it used to be. What makes summer bad is actually the heat and humidity!
These responses do show that Disney events do draw in crowds. The food and wine festival will bring in lots of adults. Halloween – Mickey’s Not So Scary Halloween – is an extremely popular time to go.
Disney has running events, cheerleading competitions, and other sporting events. These are all things to be aware of.
Overall these answers should help you know what to expect for your next trip to Walt Disney World!
As you begin to plan your next trip, we’re here to help! Here’s some posts to check out:
If you’re determining when to go, check out our Disney World Crowd Calendar .
If you already have a trip planned, figure out where to stay by looking at how to decide if you should Stay onsite vs offsite and also get our complete guide to Disney World Resort Hotels .
This post has key topics you need to know before you go so don’t miss it!
Dave and his daughters, Katie and Jen, have been going to Disney for 30+ years, all on a teacher's budget . They love helping families have the most magical Disney vacation ever by sharing all their expert family secrets. Feel free to send them a message or follow along on Instagram !
View all posts
Related Posts:
- Best Disney Nails
- Walt Disney World vs Disneyland: 15 Differences To…
- Disney Resort Levels
- Off-Site vs On-Site Disney World Hotels
- The Best Disney Springs Restaurants
- Everything You Need To Know About Disney's Genie+ -…
GITNUX MARKETDATA REPORT 2024
Disney World Visitor Statistics [Fresh Research]
- Last Updated: December 23, 2023
- How we write

Highlights: Disney World Visitor Statistics
- In 2019, Walt Disney World Resort in Florida had approximately 20.86 million visitors.
- The average daily attendance at Disney World’s Magic Kingdom in Orlando is approximately 57,000 visitors.
In 2019, the average visitor spent $132.43 for a day pass to the Disney World theme parks.
- In a 2017 survey, 75% of Disney World visitors reported being “very satisfied” with their experience.
Disney World guests are willing to wait an average of 45 minutes for attractions and rides.
There has been a 2.3% annual increase in visitors to Disney World from 2014 to 2019.
- The average visitor’s spending on souvenirs during a Disney World vacation is $69.30 per person.
In 2019, EPCOT at Walt Disney World had a 4.2% increase in attendance.
On average, single-day tickets to Disney World cost between $109 and $159.
Over 50% of Walt Disney World Resort visitors stay between 5 and 7 nights.
- During 2020’s COVID-19 pandemic, Disney World’s attendance dropped 80% compared to the previous year.
The average Disney World visitor clicks 120 photos per day.
Disney World in Orlando is the most visited theme park in the world.
Approximately 155,000 guests visit Disney World on a peak day during the holiday season.
- In 2018, Disney’s Animal Kingdom experienced the largest growth of any Disney theme park worldwide, with a 9.86% increase in attendance.
Disney World visitors consume about 50 million Coca-Cola products annually.
In 2017, approximately 42% of all U.S. households with children under age 18 had visited a Disney theme park.
Our Newsletter
The Business Week In Data
Sign up for our newsletter and become the navigator of tomorrow's trends. equip your strategy with unparalleled insights.
→ Learn more about our Newsletter
Table of Contents
Are you curious about the statistics behind Walt Disney World Resort in Florida? From attendance numbers to spending habits, this blog post will explore 20 fascinating facts and figures related to one of the world’s most popular tourist destinations.
We’ll look at how many visitors come each year, where they’re from, what they spend their money on, and more. So buckle up for a journey through some amazing Disney World visitor stats.
Disney World Visitor Statistics Overview
This statistic is a telling indication of the value that visitors place on a day pass to the Disney World theme parks. It speaks to the quality of the experience that Disney World provides, as well as the willingness of visitors to pay for it. This statistic is an important piece of the puzzle when it comes to understanding the overall success of Disney World as a tourist destination.
In a 2017 survey, 75% of Disney World visitors reported being “very satisfied” with their experience.
This statistic is a testament to the success of Disney World in providing a magical experience for its visitors. It shows that the majority of people who visit Disney World are highly satisfied with their experience, which is a strong indication that Disney World is doing something right. This statistic is an important piece of information for anyone writing a blog post about Disney World Visitor Statistics, as it provides a valuable insight into the overall satisfaction of Disney World visitors.
This statistic is a telling indication of the level of commitment Disney World guests have to experiencing the park’s attractions and rides. It speaks to the dedication of visitors to make the most of their time in the park, and the high regard they have for the experiences Disney World has to offer.
This statistic is a testament to the enduring popularity of Disney World, showing that the number of visitors has steadily grown over the past five years. It is a clear indication that Disney World continues to be a top destination for people from all over the world.
The average visitor’s spending on souvenirs during a Disney World vacation is $69.30 per person.
This statistic is a telling indication of the impact Disney World has on its visitors. It shows that people are willing to part with their hard-earned money to take home a piece of the Disney World experience. This statistic is a testament to the power of the Disney brand and the lasting memories it creates.
This statistic is significant in the context of Disney World Visitor Statistics because it indicates that EPCOT is becoming increasingly popular among visitors. The 4.2% increase in attendance shows that more people are choosing to visit EPCOT, which could be attributed to the park’s new attractions and experiences. This statistic is a testament to the success of EPCOT and its ability to draw in more visitors.
The cost of a single-day ticket to Disney World is an important factor in understanding the overall visitor statistics. It provides insight into the affordability of the park, which can influence the number of people who visit and the amount of money they are willing to spend. Additionally, it can help to identify potential trends in the types of visitors that are attracted to the park, as well as the types of activities they are likely to engage in.
This statistic is significant in understanding the typical Disney World Resort visitor’s experience. It indicates that the majority of visitors are spending a considerable amount of time at the resort, likely taking advantage of the many attractions and activities available. This suggests that Disney World Resort is a popular destination for extended vacations, and that visitors are likely to have a memorable and enjoyable experience.
During 2020’s COVID-19 pandemic, Disney World’s attendance dropped 80% compared to the previous year.
This statistic is a stark reminder of the impact that the COVID-19 pandemic has had on Disney World’s attendance. It serves as a powerful illustration of the drastic decline in visitors to the park, and the economic implications that come with it. It is a sobering reminder of the effects of the pandemic, and a reminder of the importance of taking the necessary precautions to protect ourselves and others.
This statistic is a telling indication of the sheer amount of memories that Disney World visitors are able to capture during their stay. It speaks to the sheer magnitude of the experience that Disney World provides, and how much of it can be captured in a single day. It also serves as a reminder of the importance of taking the time to document the moments that make up a Disney World vacation.
This statistic is a testament to the immense popularity of Disney World in Orlando, highlighting its status as a premier destination for tourists and families alike. It speaks to the success of the park in providing a magical experience that draws people from all over the world. This statistic is a powerful reminder of the impact Disney World has had on the tourism industry and the global economy.
This statistic is a testament to the immense popularity of Disney World, especially during the holiday season. It speaks to the sheer number of people who flock to the park to experience the magic of Disney, and it serves as a reminder of the immense impact Disney World has on the tourism industry.
In 2018, Disney’s Animal Kingdom experienced the largest growth of any Disney theme park worldwide, with a 9.86% increase in attendance.
This statistic is a testament to the success of Disney’s Animal Kingdom, demonstrating that the park is becoming increasingly popular among Disney World visitors. It is a clear indication that the park is doing something right, and is a great example of the overall success of Disney World as a whole.
The sheer volume of Coca-Cola products consumed by Disney World visitors each year is a testament to the immense popularity of the park. It’s a staggering figure that speaks to the sheer number of people who flock to the park annually, and the sheer amount of fun they have while they’re there. This statistic is a reminder of the immense impact Disney World has on the lives of its visitors, and the world at large.
This statistic is a telling indication of the popularity of Disney theme parks among families with young children. It shows that a large portion of households with children are taking advantage of the fun and entertainment that Disney parks have to offer. This statistic is important to consider when discussing Disney World Visitor Statistics, as it provides insight into the types of visitors that are drawn to the parks.
Disney World is one of the most popular tourist destinations in the world, with an average of 20.86 million visitors each year and 57,000 daily guests at its Magic Kingdom alone. On a peak day during holiday season, Disney World can see up to 155,000 people pass through its gates. The majority of these visitors are families with children under 18 years old (42%), but adults without kids make up 30% as well. International travelers account for 18.5%, while domestic tourists spend an average $132 per person on admission fees and souvenirs ($69).
The resort employs 77,000 “cast members” to serve their guests who wait 45 minutes on average for attractions or rides – all worth it according to 75% of survey respondents who reported being “very satisfied” after visiting Disney World in 2017. In 2019 there was a 2.3% annual increase in attendance compared to 2018 when Animal Kingdom experienced the largest growth worldwide (9%). Unfortunately due to COVID-19 pandemic this number dropped by 80%. Nevertheless over 50 million Coca Cola products were consumed annually before 2020 proving that Walt Disney’s dream still lives strong today.
0. – https://www.touringplans.com
1. – https://www.orlandoweekly.com
2. – https://www.creditdonkey.com
3. – https://www.travelingmom.com
4. – https://www.themeparkinsider.com
5. – https://www.nytimes.com
6. – https://www.usatoday.com
7. – https://www.statista.com
8. – https://www.morganstanley.com
9. – https://www.teaconnect.org
10. – https://www.travelandleisure.com
11. – https://www.wdwnews.com
12. – https://www.wdwprepschool.com
What is the average annual number of visitors to Disney World?
Around 58 million people visit Disney World each year on average.
Which Disney World park has the highest attendance among the four parks?
The Magic Kingdom Park has the highest attendance, with around 21 million visitors annually.
What percentage of Disney World visitors are international tourists?
Approximately 18-22% of Disney World visitors are international tourists.
What are the peak seasons when Disney World experiences the highest influx of visitors?
The peak seasons for Disney World are during Spring Break, Summer (June-August), and the weeks surrounding Christmas and New Year's.
What is the average time a visitor spends at Disney World's theme parks?
The average time a visitor spends at Disney World's theme parks is about 4-5 days.
We have not conducted any studies ourselves. Our article provides a summary of all the statistics and studies available at the time of writing. We are solely presenting a summary, not expressing our own opinion. We have collected all statistics within our internal database. In some cases, we use Artificial Intelligence for formulating the statistics. The articles are updated regularly.
See our Editorial Process.
Travel and Tourism Statistics: Explore more posts from this category

Cybersecurity In The Hospitality Industry Statistics
Adventure Travel Industry Statistics
Diversity In The Cruise Industry Statistics
Glamping Industry Statistics
Diversity In The Airbnb Industry Statistics
Vacation Industry Statistics
Airbnb Industry Statistics
Online Travel Agency Industry Statistics
Business Travel Industry Statistics
Online Travel Booking Industry Statistics
Global Tourism Industry Statistics
Travel App Industry Statistics
Travel Agency Industry Statistics
Online Travel Industry Statistics
Cruise Line Industry Statistics
Global Cruise Industry Statistics
Global Travel Industry Statistics
Luxury Hotel Industry Statistics
Resort Industry Statistics
Cybersecurity In The Travel Industry Statistics
... Before You Leave, Catch This! 🔥
Your next business insight is just a subscription away. Our newsletter The Week in Data delivers the freshest statistics and trends directly to you. Stay informed, stay ahead—subscribe now.
→ Learn more about "The Week in Data"
Disney’s Magical Economic Impact: How Walt Disney World Bolsters Florida’s Economy

Walt Disney World Resort, a name synonymous with magic and wonder, extends its enchantment far beyond the realms of entertainment and into the economic stratosphere of Florida. A recent study by Oxford Economics reveals an astounding fiscal impact, highlighting Disney’s role as not just a dream maker but also as a significant economic engine.
Disney’s Economic Magic in Numbers: In fiscal year 2022, Disney’s presence in Florida generated a staggering $40 billion in total economic impact. This includes a direct contribution to the employment sector, with over 263,000 jobs, amounting to 1 out of every 32 jobs in the state. Disney’s workforce alone in Florida is a robust 82,000, playing a pivotal role in Central Florida’s employment landscape. The ripple effect of Disney’s operations is so profound that without it, Florida’s unemployment rate would potentially leap from 3% to 5.4%.
Tax Contributions and Public Service Funding: Disney’s operations also significantly contribute to state and local tax revenues. In the fiscal year 2022, Disney generated $6.6 billion in tax revenue, including $3.1 billion in state and local taxes. These funds are vital in supporting local schools, law enforcement, public safety, parks, and infrastructure developments in Central Florida, further underlining Disney’s integral role in the region’s socio-economic fabric.
Supporting Small Businesses and Local Communities: Disney’s economic influence extends to over 2,500 Florida-based small businesses, fostering a thriving commercial environment. This support is part of Disney’s larger commitment to over 8,500 small businesses nationwide. Local entrepreneurs, from painters maintaining the iconic Cinderella Castle to family-run vendors in theme parks, all find growth opportunities through their association with Disney.
Investments and Future Plans: Looking towards the future, Disney plans to nearly double its capital expenditures to approximately $60 billion over the next decade. This investment will focus on expanding and enhancing park experiences and increasing cruise line capacity, promising further economic stimulation and job creation in Florida.

Recap and Reflection…
As an avid Disney enthusiast and a longtime observer of its magical influence, it’s truly fascinating to delve into the economic impact of Walt Disney World in Florida. Recently, detailed studies by Oxford Economics and an in-depth Economic Impact Study have shed light on this topic, revealing some remarkable facts.
These studies highlight how Walt Disney World isn’t just a place of joy and wonder; it’s a significant economic powerhouse. It’s astounding to realize the extent of its contribution to Florida’s economy. The resort has created an incredible number of jobs, both directly and indirectly, playing a pivotal role in employment opportunities for Florida residents. This isn’t just about numbers; it’s about livelihoods and families being supported, thanks to the magic of Disney.
Moreover, the ripple effect of Disney’s presence in Florida extends to numerous sectors. From local businesses thriving due to increased tourism, to the construction industry booming with continuous development and expansion of the resort, the economic benefits are widespread. It’s not just a theme park; it’s a hub of economic activity that touches every corner of the state.
The commitment of Walt Disney World to Florida’s economy is also evident in its substantial tax contributions, funding essential services and infrastructure. This financial input is vital for the state’s overall development, showcasing how Disney’s role in Florida is deeply woven into the very fabric of the state’s growth and prosperity.
Reflecting on these findings, it’s clear that Walt Disney World is much more than a vacation destination. It’s a driving force in Florida’s economy, fostering growth, and offering opportunities that resonate far beyond the boundaries of the parks.
The beauty of Disney’s impact lies in its ability to combine economic contributions with the creation of joy and memories. It’s a unique blend of business acumen and storytelling magic. This balance is what makes Disney a beloved entity, not just as a brand but as a community partner in Florida.
The positive influence of Disney on the local communities is profound. From supporting local charities to investing in educational initiatives, Disney’s role in enriching lives goes beyond the economic numbers. It’s about creating a better future for Florida, where dreams aren’t just for those who visit the parks, but for those who call Florida home.
In essence, Walt Disney World is a testament to the power of dreams and the incredible impact they can have on the real world. It’s a place where magic and reality converge to create something truly extraordinary for Florida and its people.
Share this:

Lou Mongello
- November 14, 2023
- disney's economic impact on Florida , Florida Economy , Oxford Economics , Walt Disney

About Lou Mongello

Lou Mongello is a former attorney who left the practice to pursue his passion, and is now a recognized Disney expert, author, speaker, and host of WDW Radio. Learn more…
Related Posts
Disneyland resort announces the thrilling return of pixar fest, live video tour of disney’s wilderness lodge resort, wdw radio # 781 – listener email: more muppets, secret disney cruise line desserts, tokyo disneyland, dinner crawl & more, live video from epcot let’s wander world showcase… and try a few of the hidden gem snacks… starting in my favorite pavilion.
© WDWRadio™ and Second Star Media™ WDW Radio is in no way part of, endorsed or authorized by, or affiliated with the Walt Disney Company or its affiliates. As to Disney artwork/properties: © Disney | Disclosure | Privacy Policy | #ChooseTheGood
- About WDW Radio
- WDW Radio Nation
- Dream Team Project
- Running Team
- Work with Lou
Contact Info
- [email protected]
- Orlando, Florida
Advertise and Partner with WDW Radio

© 2024 WDW Radio All Rights Reserved.
Effortless booking
Maximize online conversions with the most intuitive checkout online.
Expand revenue with our powerful Automated E-commerce tools.
Upgrade your website to industry’s best. Fresh websites. Fresh revenue.
Amplify visibility and expand earnings with integrated OTAs and local partners.
Streamline check-ins, limit risk, and amplify customer data with built-in digital waivers.
Transform data into insights. X-ray reporting gives you customer and business intelligence.
Manage high-volume walk-up customers effortlessly with POS, ticketing, and gated entry.
Automate management of staff schedules, assignments, and staff communications
Control your business precisely the way you want with endless yet easy configurability.
Allocate equipment used in various products. Prevent overbookings and maximize profits.
Grow with Xola in our constantly expanding universe of integrations and apps.
Harness customer data to drive marketing campaigns and generate repeat business.
Transform your guests into passionate brand advocates. Perfect your products & services.
Manage your business with the most powerful mobile suite in the industry.
Perfect the guest experience by giving your staff the industry’s most intuitive software.
Efficiently manage guest flow, minimize wait times, and ensure maximum satisfaction.
Ticketing & Entry
Revolutionize your guest experience: Effortless check-ins, interactive displays, secure payments.
Boost revenue with automated rave reviews, actionable insights, and loyal customer engagement.
Efficient ticketing, digital waivers, and fast check-ins enhance on-site operations and guest satisfaction.
Explore Xola Universe: 80+ apps, limitless integrations, endless growth opportunities.
Simplify check-in and boost your marketing efforts with our integrated automated digital waivers.
With SOC 2 Type II and CCPA compliance Xola exceeds industry security standards and insures your data protection.
Access real-time insights for business growth with our powerful reporting.
Remarkable and hassle-free guest experiences with waitlist and virtual queuing.

An overview of the best distribution channels
- Xola University
- Business Operations
Orlando Tourism Stats Round-up Post

Orlando is not only a world-famous theme park mecca, it’s the most-visited destination in America. The Orlando area welcomed a record-breaking 75 million visitors in 2018, which secured it a spot among the most popular cities around the world.
The Metro Orlando area is defined as a tri-county region consisting of Orange, Osceola, and Seminole Counties. The tri-county area covers 2,538 square miles and is home to more than 2 million residents.
Known for its pleasant weather and Disney theme parks, Orlando hosts the largest number of visitors to Florida each year. The city is fueled by its tourism industry, making it a great place to open a travel business.
Here are all the Orlando tourism statistics you need to know before opening your tour business.
How many tourists visit Orlando each year?
Orlando tourists in 2021, orlando tourists in 2020, orlando tourists in 2019, orlando monthly tourism numbers, orlando weekly tourism numbers, orlando daily tourism numbers.
How much does tourism bring to Orlando?
Which Demographics Want to Visit Orlando the Most?
How many americans visit orlando each year, top states that have the most tourists that visit orlando, how many international tourists visit orlando each year, top countries that have the most tourists that visit orlando, how much do tourists typically spend in orlando.
Share of tourism spending / revenue in Orlando by country of origin
How Many Hotel Rooms Are In Orlando?
How many tours and attractions are in Orlando?
Top 18 Orlando Theme Parks and Attractions by the numbers
Orlando became the first destination in the U.S. to surpass 70 million visitors in 2017. Visitation numbers continued rising until 2019.
In 2020, Orlando suffered from a lack of both domestic and international travelers due to the ongoing coronavirus pandemic. As its theme parks reopened and the U.S. began softening its travel restrictions, tourists started to return in 2021.
Now, the destination is back on track to set a new record. During the first quarter of 2022, Florida’s total visitor numbers were up 38% on the same period in 2021. This is excellent news for Orlando, the most-visited city in the state.
Tourism in Orlando began to make a comeback last year. The city welcomed 59.3 million visitors in 2021, compared to just 35 million the year prior. When the U.S. softened its border restrictions in November 2021, Orlando started seeing upticks in international visitors.
Orlando’s visitor count fell to 35.3 million in 2020, a 53% drop off from 2019. This was the lowest number of visitors to Orlando in over 20 years. International travel was down by 75% , largely due to the U.S. travel ban that barred most foreign travelers from entering the country.
Orlando welcomed a record 75.8 million visitors in 2019.
The Orlando International Airport, the busiest airport in Florida, saw 50.1 million travelers transiting through in 2019.
In 2019, an average of 6 million people visited Orlando every month. The destination’s busiest months — summer and the holidays — likely saw a lot more people, while slower periods could have seen less.
Meanwhile, an average of 1.5 million people visited Orlando every week in 2019.
Here are the number of daily visitors at the top 12 attractions in Orlando. Actual daily visitor numbers might be considerably higher during peak tourism seasons and holidays like Easter, Thanksgiving, and Christmas. These figures could also be considerably lower during slower seasons.
- Magic Kingdom — 57,000
- Disney’s Animal Kingdom — 38,000
- EPCOT — 34,000
- Disney’s Hollywood Studios — 31,000
- Universal Studios Orlando — 29,000
- Islands of Adventure — 28,000
- SeaWorld — 12,000
- Disney’s Typhoon Lagoon — 6,000
- Legoland — 6,000
- Disney’s Blizzard Beach — 5,000
- Universal’s Volcano Bay — 4,000
- Aquatica — 4,000
How much does tourism bring to Orlando?
Visitors to Orlando bring in over $4 billion in state and local taxes from hotels and businesses. The overall economic impact of visitors in Orlando is as high as $70 billion during a normal year. At its peak, the tourism industry was responsible for over 440,000 jobs.
Orlando’s 2021 rebound was driven by domestic visitors, with business and international tourist numbers still lagging.
The number of Americans visiting Orlando grew by 70% in 2021. Meanwhile, the number of business travelers only grew by about 50%. International travelers have yet to return in full force, with numbers growing only by 25%.
Of the 59.3 million visitors in 2021, about 50 million were domestic travelers visiting for fun. Another 7.5 million were domestic travelers on business trips. Only about 2.1 million visitors came from overseas.
In recent years, Orlando’s theme parks have noted a larger numbers of spring breakers .
Of Orlando’s 75.8 million visitors in 2019, over 69 million came from the U.S. In other words, Americans made up more than 90% of Orlando’s visitors that year.
In 2020, the number of American visitors dropped to 33.6 million . Yet in 2021, domestic travel rebounded and 57.2 million returned to Orlando.
Domestic visitors by the numbers:
- 57.2 million in 2021
- 33.6 million in 2020
- 69.3 million in 2019
Most of Orlando’s visitors in 2021 came from the U.S. The top origin states for domestic visitors to Florida in 2021 were Georgia (9.5%), New York (9.3%), and Alabama (6.4%).
Of Orlando’s 75.8 million visitors in 2019, about 6.5 million were international . In 2020, that number steeply dropped. Only 1.6 million International travelers visited the tri-county region in 2020. Numbers started to slowly recover in 2021 when 2 million international visitors traveled to Orlando, a 25% increase from 2020.
International visitors by the numbers:
- 2.1 million in 2021
- 1.6 million in 2020
- 6.5 million in 2019
In 2019, 1.2 million Canadians visited Orlando, representing 18% of the city’s international visitors. Canada was the tri-county region’s top international market.
The U.K. was the second top market with 1 million travelers, followed by Brazil with 830,000 visitors, Colombia with 303,000, and Argentina with 232,000.
As expected, international visitor numbers dropped dramatically across the board in 2020.
International travel started to pick back up in 2021. About 2 million international travelers visited Orlando last year, and 1.6 million of those visitors came from overseas.
In 2021, Orlando’s international visitor demographic began to shift. Mexico took the top spot with 323,000 visitors, followed by Colombia with 297,000 tourists . Only 79,000 visitors came from the U.K., which used to be one of the region’s top markets.
The average visitor spends $615 per trip to Orlando. Overall, visitors spend a total of about $44 billion , which generates an economic impact of nearly $71 billion.
Share of tourism spending/revenue in Orlando by country of origin
Tourists from Brazil and China are the top spenders in Orlando. Chinese visitors spend as much as $7,000 per visit, while Brazilians are spending an average of $5,000 .
How Many Hotel Rooms Are In Orlando?
There were about 129,000 hotel rooms in Orlando in 2021. The average occupancy rate was 57.8% .
Up until 2019, the destination was pushing its tourism industry to new heights, adding more rides and hotel rooms at record speeds. There were 120,000 hotel rooms in Orlando then — the second highest in the nation behind only Las Vegas — and even more were in the pipeline.
How many tours and attractions are in Orlando?
Theme parks:
There are 10 main theme parks in Orlando. Walt Disney World itself is home to four of these theme parks, including Magic Kingdom, Animal Kingdom, Epcot, and Hollywood Studios. Universal Orlando is home to two more theme parks: Universal Studios and Islands of Adventure.
Then there’s SeaWorld, Discovery Cove, LEGOLand, and Busch Gardens, which is technically in Tampa but often viewed as a part of Orlando’s attraction mecca.
Large attractions:
There are several more large attractions sprinkled in the mix — including the two most-visited water parks, America Blizzard Beach and Typhoon Lagoon. Both are located within Walt Disney World, where you’ll also find an entertainment, dining and retail Complex known as Disney Springs and three championship golf courses.
Meanwhile, Universal Studios and Islands of Adventure each have their own fair share of hit attractions like Harry Potters Diagon Alley and Harry Potters Hogsmeade, respectively. The water park Volcano Bay is also located within Universal.
Smaller tours:
There are dozens of smaller tours available in Orlando, giving visitors a wide variety of entertainment options other than theme parks. The region has a rich ecosystem that gives way to unique ecotourism tours like educational swamp visits and alligator encounters. There are scenic sightseeing tours by bus, trolley, or boat; airboat and kayak tours; walking tours; hot air balloon rides; and more.
Top 18 Orlando Theme Parks and Attractions by the numbers
Let’s take a look at the 18 most-visited theme parks, waterparks, and attractions in Orlando.
- Walt Disney World receives over 50 million visitors each year, making it the most visited vacation resort in the world. The major attraction is home to four theme parks, two water parks, more than two dozen resort hotels, golf courses, a camping resort, a shopping center, and more.
- Magic Kingdom was the world’s most-visited theme park in 2018, with a whopping 20.8 million visitors.
- Universal’s Universal Studios and Islands of Adventure welcome about 20 million visitors per year between the two theme parks, which are home to extremely popular attractions like the Wizarding World of Harry Potter.
- Disneyland Park at Disneyland Resort welcomed
- Disney’s Animal Kingdom was one of the top visited theme parks in Orlando in 2019, welcoming nearly 14 million visitors .
- The popularity of Pandora – The World of Avatar helped boost attendance at Disney’s Animal Kingdom in Disney World. Visitor numbers soared 10% to 13.7 million during the attraction’s first full year.
- Walt Disney World’s Epcot theme park followed with 12.4 million visitors in 2019.
- Hollywood Studios, one of the several theme parks at Walt Disney World Resort, welcomed 11.5 million visitors in 2019.
- Islands of Adventure — one of Universal’s two theme parks — welcomed 10.4 million visitors in 2019.
- Orlando’s SeaWorld sees about 5 million visitors every year.
- Disney’s Typhoon Lagoon water park attracted 2.2 million visitors in 2019.
- Disney’s Blizzard Beach welcomed nearly 2 million visitors in 2019.
- Universal’s Volcano Bay water park sold 1.8 million tickets in 2019.
- The Aquatica water park had 1.5 million visitors in 2019.
- Legoland welcomes 2 million visitors annually.
- SEA LIFE Orlando Aquarium has over 5,000 species of sea creatures and is one of the most-visited attractions in the city.
- About 300,000 people visit the Central Florida Zoo every year.
- Discovery Cove welcomes about 1,300 guests per day, making it one of the most popular attractions in Orlando.
These Orlando statistics prove that the destination has a bright future ahead. As the tourism industry recovers, Florida’s top destination is poised to achieve many record-breaking years.
Writer Carla Vianna
Related Articles

You’ve likely considered the pros and cons of listing your tours with a third-party website. While your own tour website

6 examples of how tour operators can use AI to automate tasks
We know there’s a lot of buzz around Artificial Intelligence (AI), and you may not think there’s anything in it

How to find the best tour booking software for your company
Thousands of businesses rely on a comprehensive booking management tool to streamline operations and enhance customer experience every day. With
Get the latest news and resources.
For tours and attractions delivered straight to your inbox each week.
Transform your business now.

- Getting Results.
- Newsletters
Economic boom: Walt Disney World’s $40B impact on Florida
Study reveals disney’s contributions to jobs, economy, business.
Landon McReynolds , Producer
BAY LAKE, Fla. – Oxford Economics published a new study Tuesday that shows Walt Disney World Resort generating $40 billion in economic impact across Florida in fiscal year 2022.
The comprehensive analysis (read report at bottom of this story) unveils the resourceful contributions of Disney, ranging from job creation to tax revenue, and highlights its critical role in shaping the economic landscape of the Sunshine State.
The study looked at results prior to the Reedy Creek Improvement District, established in 1967, becoming the Central Florida Tourism Oversight District with the appointment of a new board.
The study showcases Disney’s extensive reach, fostering a major economic engine that extends far beyond its Central Florida theme parks.
[EXCLUSIVE: Become a News 6 Insider (it’s FREE) | PINIT! Share your photos ]
With a total statewide economic impact of $40.3 billion, the research group said Disney played a crucial role in supporting 263,000 direct and indirect jobs—equivalent to 1 in every 32 jobs in the state. Researchers said Disney’s direct workforce of 82,000 employees across the state translates into a significant ripple effect, supporting an additional 1.7 jobs for every on-site position within Florida.
The group found that without Disney’s statewide job impact, Florida’s unemployment rate would surge from 3% to a 5.4%, positioning the state as one of the nation’s highest in unemployment.
“I am incredibly proud of how Disney has created meaningful change and benefitted people’s lives in Florida for generations, not just in establishing our area’s theme park industry, but also in how we have worked with other sectors across the state to do the same,” said Jeff Vahle, President, Walt Disney World Resort. “The numbers speak for themselves on why Disney is so important to fueling jobs, the economy and tourism throughout our region, and the future investments we’re looking to make will continue to provide even more opportunities for Floridians.”
Disney’s financial skill isn’t confined to job creation alone. It’s also benefited areas around Central Florida and beyond.
“Disney’s impact goes far beyond the gates of its theme parks and positively touches our lives in nearly every corner of our community. Disney not only pioneered Orlando’s theme park industry with its own investments over the last five decades, they also paved the way for others to invest in our city and help make it the tourism destination it is today. It’s been an honor working alongside Disney as they help continue to move Florida forward,” Orlando Mayor Buddy Dyer said.
Oxford’s study revealed a substantial tax contribution of $6.6 billion, with $3.1 billion in annual state and local tax revenue generated by Disney, its guests, employees and third-party businesses.
Notably, 2,500 Florida-based small businesses are contracted to supply products and services to Disney World, forming a major part of the over 8,500 small businesses nationwide contracted by The Walt Disney Company.
“From Day 1, the experience and the relationship that Disney has offered us is better than anything I’ve ever seen. Our business has grown in the last three years by about 25 to 30%. We are pushing numbers that we never expected out of fast casual,” said James Petrakis, owner of The Polite Pig at Disney Springs.
Walt Disney World Resort, among the largest employers in Florida, boasts a massive economic impact as an international destination.
It drives benefits across the state economy through direct operations, robust supply chains, substantial tax payments, and the spending of guests within the hospitality, transportation and retail sectors.
In fiscal year 2022, Disney paid and collected a combined $1.1 billion in state and local taxes to Orange and Osceola counties and the state of Florida, as well as to the Central Florida Tourism Oversight District.
“My connection with Disney World runs deep having been a cast member myself in its opening years, and what remains true after all this time, is Disney’s immense and positive impact on its employees and our community at large. In serving this community as long as I have, I can confidently say that Disney’s contributions have resulted in the progress and prosperity of Florida and all who call it home,” Orange County Mayor Jerry Demings said.
The economic engine is not ending anytime soon.
Just last week, Walt Disney Company CEO Bob Iger said the company is developing plans to “turbocharge” and expand investment in its experiences segment business to nearly double capital expenditures over the course of approximately 10 years to roughly $60 billion.
This includes enhancing and investing in domestic and international parks and cruise line capacity.
The Economic & Fiscal Contributions of Disney in Florida by Daniel R. Dahm on Scribd
Use the form below to sign up for the ClickOrlando.com In the Loop: Theme Park Scoops newsletter, sent every Friday morning.
Copyright 2023 by WKMG ClickOrlando - All rights reserved.
RELATED STORIES
Jollywood nights arrives at disney’s hollywood studios, disney’s contemporary resort unveils 100th anniversary celebration gingerbread display.
Recommended Videos

Disney World’s revenue keeps slumping, new report shows
R evenue increased for Walt Disney Co.’s theme parks globally in the fourth quarter, but the numbers lagged at Walt Disney World , the entertainment giant reported Wednesday.
Disney’s experiences division, which includes theme parks, hotels, Disney Cruise Line and merchandise, saw an uptick in revenue of 13% for the quarter ending Sept. 30. Domestic parks earned $5.4 billion, up 7%, while earnings at international parks were up 55% to $1.7 billion.
The report said Disney World suffered “lower results” without offering specific numbers. They were attributed to lower guest spending because of a decrease in hotel room rates, the cost of the accelerated depreciation for Star Wars: Galactic Starcruiser, the two-night theme experience that was shuttered in September, as well as inflation.
The company’s third-quarter report also indicated a slump at Disney World and pointed to the flattening of attendance and softening in other Florida tourism markets.
Higher attendance and higher ticket prices fueled the growth at Disneyland, officials said.
“Parks and experiences overall remains a growth story, and we are managing our portfolio exceptionally well,” Disney CEO Robert Iger said during an analyst call Wednesday afternoon.
“Even in the case of Walt Disney World, where we have a tough comparison to the prior year, when you look at this year’s numbers compared to pre-pandemic levels in fiscal ‘19, we’ve seen growth in revenue and operating income of over 25% and 30% respectively over the last five years,” Iger said.
Interim Chief Financial Officer Kevin Lansberry said Disney World numbers were suffering in comparison with those from the resort’s 50th anniversary celebration, which ended April 1.
Disney World will have “a little bit of that lapping effect that will continue for a little bit as we go through Q1,” he said. “But as I look out at the other domestic businesses … Disneyland continues to look exceptionally strong, as does Disney Cruise Line. So bookings, all of those continue to be very, very strong going forward.
“We continue to be bullish on the long-term positioning of our experiences business,” Lansberry added. “We expect those investments to ramp up towards the back half of that 10-year period, with more gradual increases in the first few years,” he said.
Iger repeated his $60 billion plan to “turbocharge” growth for the theme parks at multiple locations.
In an interview with CNBC’s Julia Burstin, Iger said the long-term success of the parks played a part in those investments.
“When we looked ahead and how we’ll allocate capital … we decided that a great place to place our bets or our capital is in the business that’s delivered the best results,” he said.
Fourth-quarter revenue for Walt Disney Co. overall was $21.2 billion, a 5% year-to-year increase.
The company reported an increase of almost 7 million subscribers to its Disney+ streaming service. The addition of theatrical releases “Elemental,” “The Little Mermaid” and “Guardians of the Galaxy Vol. 3” boosted the service, Iger said.
©2023 Orlando Sentinel. Visit at orlandosentinel.com. Distributed by Tribune Content Agency, LLC.

- All Resort Hotels
- Deluxe Villa
- Bay Lake Tower at Disney's Contemporary Resort
- Boulder Ridge Villas at Disney's Wilderness Lodge
- Copper Creek Villas & Cabins
- Disney's Animal Kingdom Villas - Jambo House
- Disney's Animal Kingdom Villas - Kidani Village
- Disney's Beach Club Villas
- Disney's BoardWalk Villas
- Disney's Old Key West Resort
- Disney's Polynesian Villas & Bungalows
- Disney's Riviera Resort
- Disney's Saratoga Springs Resort & Spa
- The Cabins at Disney's Fort Wilderness Resort - A Disney Vacation Club Resort
- The Villas at Disney's Grand Floridian Resort & Spa
- Deluxe Resorts
- Disney's Animal Kingdom Lodge
- Disney's Beach Club Resort
- Disney's BoardWalk Inn
- Disney's Contemporary Resort
- Disney's Grand Floridian Resort & Spa
- Disney's Polynesian Village Resort
- Disney's Wilderness Lodge
- Disney's Yacht Club Resort
- Disney Resort Hotels
- Disney's Caribbean Beach Resort
- Disney's Coronado Springs Resort
- Disney's Port Orleans Resort - French Quarter
- Disney's Port Orleans Resort - Riverside
- The Cabins at Disney's Fort Wilderness Resort
- Disney's All-Star Movies Resort
- Disney's All-Star Music Resort
- Disney's All-Star Sports Resort
- Disney's Art of Animation Resort
- Disney's Pop Century Resort
- The Campsites at Disney's Fort Wilderness Resort
- Other Select Deluxe Hotels
- Walt Disney World Dolphin Hotel
- Walt Disney World Swan Hotel
- Walt Disney World Swan Reserve Hotel
For Office Use Only - wdw en_US
- Interactive
- Floor Plans
The Most Magical Place On Earth
- Today's Park Hours
Park Hours for
Start planning: offers & more.

4-Day, 4-Park Magic Ticket from $99 Per Day, Plus Tax
Experience all 4 theme parks with this specially priced ticket (total price from $396, plus tax). One admission per theme park. One theme park per day.
Get Details
View All Offers

Save Up to 30% When You Stay 5 Nights or Longer
Save on rooms at select Disney Resort hotels, most nights from July 8 to October 3, 2024. Other savings are available for shorter stays.

Can't Miss Experiences
Luminous The Symphony Of Us at EPCOT
TRON Lightcycle / Run presented by Enterprise at Magic Kingdom Park
Avatar Flight of Passage at Disney’s Animal Kingdom
Star Wars Galaxy’s Edge at Disney’s Hollywood Studios
Make Your Way to the Magic
Plan Your Disney Vacation
Make a Theme Park Reservation
Dining to Delight Every Style, Taste & Budget
Save time waiting in line with Lightning Lane entry
Even More to Explore
Memory Maker Enjoy all the Disney PhotoPass memories captured during your vacation—for one price!
Download the My Disney Experience App
Shop the Stories You Love
Have Questions?
Connect with a planDisney panelist
Want a Vacation Recommendation?
Choose All Travel Styles That Apply
Step 1 of 4

IMAGES
VIDEO
COMMENTS
Four Magical Theme Parks and Resorts. Recreation. Amazing Dining Options. Shopping & More. Explore classic favorite attractions, dining, shopping and more. Book your visit today!
Visitors to Disney theme parks in the U.S. 2019-2022, by park. Published by Statista Research Department , Sep 18, 2023. Magic Kingdom was the most visited Disney theme park location in the United ...
Across all four theme parks at Walt Disney World, yearly attendance stands at an average of 58.8 million visitors. To break these Disney tourism stats down, here are some of the latest (2022) annual attendance numbers by park: Magic Kingdom: 17.1 million visitors. Epcot: 10 million visitors.
Disney World Resort (Hotel) Statistics. There are currently 36 resorts at WDW, including nine Disney Vacation Club properties. 26 of the resort hotels on Disney World property are actually owned and operated by WDW Resort itself. In total, Disney World has over 30,000 hotel rooms, 409 wilderness cabins, 799 campsites, and 3,293 DVC units.
Average number of Disney park visitors per day in 2022 (global): 316,950 visitors per day. Disney park attendance total for 2021 (global): 77.857 million visitors. Disney park attendance total for 2020 (global): 43.525 million visitors. Percentage decrease in Disney park attendance total from 2019-2020 (global): 72%.
The most visited theme park worldwide, Walt Disney World Magic Kingdom, located in Florida, reports increasing visitor numbers each year. However, this decreased slightly in 2016, during which ...
Figure 6 shows only 0.50% of visitors live less than a mile from the park. According to Fig. 7 most visitors' workplaces are also located at least 100 miles away from Disney World. I expected this to be the outcome since majority of the visitors' homes were located more than 100 miles away too.
The study noted that Disney—which has boosted Florida's economy, tourism, and small businesses for the last 50 years—has generated 263,000 direct and indirect jobs in the state. ... President of Walt Disney World Resort. "The numbers speak for themselves on why Disney is so important to fueling jobs, the economy and tourism throughout ...
How much do visitors spend at Walt Disney World every year? Visitors spend significant amounts at Walt Disney World every year. These expenditures include theme park tickets, which range from $109 to over $159 per day, as well as accommodation, dining, and shopping. 2; Although Disney does not share exact park-by-park spending details, it's recognised that the resort's revenue reaches ...
The country's theme parks drew 38.7 million visitors in 2022, with a trio of Japanese parks — one from Universal and two from Disney — snagging spots in the top 10. The most popular of the ...
Disney World Visitor Statistics 2022. February 15, 2022 (Updated: August 29, 2023) Disney World is an expansive place and it has a reach far beyond little girls who love princesses. It is a place for the young and the young at heart! When planning a Walt Disney World Vacation, you may be wondering what you will encounter when you are there.
Long lines and jam-packed crowds tend to go hand in hand at Central Florida's world-famous theme parks during the summer months, but Walt Disney World and Universal Orlando parkgoers may be in ...
It speaks to the sheer number of people who flock to the park to experience the magic of Disney, and it serves as a reminder of the immense impact Disney World has on the tourism industry. In 2018, Disney's Animal Kingdom experienced the largest growth of any Disney theme park worldwide, with a 9.86% increase in attendance.
Disney's Economic Magic in Numbers: In fiscal year 2022, Disney's presence in Florida generated a staggering $40 billion in total economic impact. This includes a direct contribution to the employment sector, with over 263,000 jobs, amounting to 1 out of every 32 jobs in the state. Disney's workforce alone in Florida is a robust 82,000 ...
Walt Disney World Resort is a significant contributor to the economic well-being and vitality of Central Florida. Walt Disney World Resort has contributed $1.146 billion in total state and local taxes paid and collected for FY2022. THE ENVIRONMENT Walt Disney World Resort is committed to minimizing its overall impact on the environment, focusing
Disney's Animal Kingdom was one of the top visited theme parks in Orlando in 2019, welcoming nearly 14 million visitors. The popularity of Pandora - The World of Avatar helped boost attendance at Disney's Animal Kingdom in Disney World. Visitor numbers soared 10% to 13.7 million during the attraction's first full year.
Study reveals Disney's contributions to jobs, economy, business. BAY LAKE, Fla. - Oxford Economics published a new study Tuesday that shows Walt Disney World Resort generating $40 billion in ...
Disney World Impacted By Florida's Dismal Tourism Numbers. The state of Florida suffered an over 60% drop in tourism in Quarter 2 of 2020, according to a new report by Visit Florida. The ...
"The numbers speak for themselves on why Disney is so important to fueling jobs, the economy and tourism throughout our region, and the future investments we're looking to make will continue ...
Disney's experiences division, which includes theme parks, hotels, Disney Cruise Line and merchandise, saw an uptick in revenue of 13% for the quarter ending Sept. 30. Domestic parks earned $5.4 ...
Buy Tickets & Passes. Book a Resort Hotel. For assistance with your Walt Disney World vacation, including resort/package bookings and tickets, please call (407) 939-5277. For Walt Disney World dining, please book your reservation online. 7:00 AM to 11:00 PM Eastern Time. Guests under 18 years of age must have parent or guardian permission to call.